Poland July 2024: Lexus (+116.3%) beats ranking record at #9
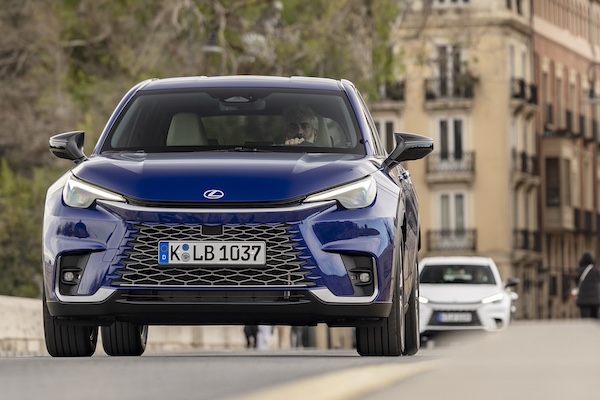
The Lexus LBX is inside the Polish Top 50 again.
Another outstanding month for the Polish new car market in July at +18.5% year-on-year to 42,122 units. The year-to-date volume is now up 16.6% to 312,986. In the brands charts, Toyota (+21.6%) improves its share year-on-year to 17.1%, an easy #1. Skoda (+1.6%) and Kia (-0.6%) are weak but Audi (+35%) impresses at #4 vs. #6 so far this year. Volkswagen (+8.1%) trails the market and falls to #5 ahead of Hyundai (+14.8%). Mercedes (+50.2%) and BMW (+55.8%) both soar but not as much as Lexus (+116.3%) signing a second ever Top 10 finish (alongside #10 last November) and highest ranking at #9. Opel (+68.5%), Cupra (+39.7%) and Ford (+36.5%) also beat the market below.
Model-wise, the Toyota Corolla (-3.9%) keeps the lead at 4.4% share, followed this month by the Kia Sportage (+27.5%) hitting its highest ever Polish ranking also reached in April 2022. The Toyota Yaris (+20.8%) remains in third position above the Hyundai Tucson (+20.8%) and Toyota Yaris Cross (+42.8%). The Toyota C-HR (+185.9%), Dacia Duster (+55.3%) and Cupra Formentor (+35.6%) also outpace the market in the remainder of the Top 10. Notice also the Audi A4 (+164.3%) up to a fantastic 13th place, the Lexus NX (+103.1%) and Hyundai i20 (+151.9%).
Previous month: Poland June 2024: MG HS up to #12 in euphoric market
One year ago: Poland July 2023: Audi (+51.5%), Volvo (+49.6%) shine in slow market
Full July 2024 Top 15 brands and Top 50 models below.
Poland July 2024 – brands:
PosBrandJul-24%/23Jun2024%/23PosFY231Toyota7,21217.1%+ 21.6%158,47518.7%+ 20.3%112Skoda4,25010.1%+ 1.6%234,60811.1%+ 15.0%223Kia3,2967.8%– 0.6%519,4576.2%– 11.4%434Audi3,0507.2%+ 35.0%616,3105.2%+ 8.5%665Volkswagen2,9777.1%+ 8.1%319,4906.2%– 1.2%346Hyundai2,7876.6%+ 14.8%418,0535.8%+ 19.2%557Mercedes2,4375.8%+ 50.2%715,4764.9%+ 52.6%888BMW2,3275.5%+ 55.8%816,0105.1%+ 21.7%779Lexus1,3023.1%+ 116.3%128,3702.7%+ 34.6%121310Dacia1,2823.0%+ 20.0%1010,4023.3%– 5.1%10911Volvo1,1042.6%– 4.4%1310,7233.4%+ 36.8%91112Cupra9962.4%+ 39.7%n/a9960.3%#VALUE!n/an/a13Ford9272.2%+ 36.5%156,9732.2%+ 8.4%141414Opel8932.1%+ 68.5%n/a6,2742.0%+ 6.9%151515Renault8882.1%– 16.2%99,1702.9%+ 11.5%1110n/aMazda7621.8%– 7.4%117,6842.5%+ 14.9%1312
Poland July 2024 – models:
PosModel Jul-24%/23Jun2024%/23PosFY231Toyota Corolla1,8364.4%– 3.9%115,7915.0%+ 27.0%112Kia Sportage1,4323.4%+ 27.5%68,0152.6%+ 9.9%553Toyota Yaris1,3613.2%+ 20.8%38,1712.6%– 12.6%434Hyundai Tucson1,2132.9%+ 15.4%57,6562.4%+ 33.0%765Toyota Yaris Cross1,0872.6%+ 42.8%49,1252.9%+ 13.8%346Skoda Octavia1,0712.5%– 26.1%212,3844.0%+ 35.4%227Toyota C-HR9522.3%+ 185.9%117,6372.4%+ 42.8%878VW T-Roc8572.0%+ 4.1%84,9111.6%– 1.6%10109Cupra Formentor7921.9%+ 35.6%154,8681.6%+ 32.5%111310Dacia Duster7471.8%+ 55.3%95,4461.7%– 3.7%9811Skoda Superb7181.7%+ 41.1%104,3421.4%+ 12.8%131512Skoda Fabia7061.7%+ 32.2%193,9571.3%– 9.8%151213Audi A46661.6%+ 164.3%342,8570.9%+ 47.3%283714Kia Ceed6031.4%– 11.7%283,0701.0%– 28.1%231115Skoda Kamiq5981.4%+ 64.3%164,5711.5%+ 26.6%121416Lexus NX5321.3%+ 103.1%173,1941.0%+ 20.9%213117Audi Q55311.3%+ 38.6%232,2960.7%+ 3.7%383218Audi Q35301.3%+ 68.8%302,5020.8%+ 14.9%363419Toyota RAV45231.2%+ 19.1%77,7092.5%+ 73.4%6920VW Tiguan5111.2%+ 22.5%273,9471.3%+ 28.6%162121Hyundai i204761.1%+ 151.9%382,5670.8%+ 37.8%344622Kia Xceed4551.1%+ 6.8%332,5930.8%– 11.3%332423Toyota Corolla Cross4371.0%– 7.8%292,8110.9%– 13.7%301624Volvo XC604351.0%– 5.6%243,9821.3%+ 9.4%141725Ford Focus4321.0%n/a143,0761.0%+ 120.5%22 n/a26Skoda Kodiaq4121.0%+ 19.1%223,3451.1%+ 18.1%191927Hyundai i304041.0%– 21.4%183,4511.1%– 3.0%181828BMW X53920.9%+ 94.1%492,1840.7%+ 17.2%444029Mazda CX-303890.9%n/a n/an/an/an/a n/a n/a30VW Golf3890.9%+ 20.8%362,6060.8%+ 3.7%322931BMW 5 Series3840.9%n/a n/a1,9570.6%n/a49 n/a32Skoda Scala3780.9%– 15.2%352,8590.9%+ 6.2%272333MG HS3690.9%n/a122,1890.7%n/a43n/a34Skoda Karoq3570.8%– 29.4% n/a2,9630.9%– 12.3%252035Toyota Aygo X3520.8%+ 68.4% n/a2,1790.7%+ 5.6%453836Toyota Proace City Verso3510.8%n/a41n/an/an/a n/a n/a37Volvo XC403340.8%– 13.5% n/a2,8780.9%+ 69.2%26 n/a38Mercedes GLC3100.7%n/a482,2620.7%n/a40 n/a39Dacia Sandero3090.7%– 10.4%402,8530.9%– 7.8%292240VW Passat3070.7%+ 7.3%462,0110.6%– 21.0%472541BMW 3 Series2950.7%+ 11.7% n/a2,2430.7%+ 14.1%413542Lexus LBX2770.7%new37n/an/anew n/a –43Kia Stonic2680.6%– 22.8% n/an/an/an/an/a4344Audi A32670.6%– 23.9%432,9991.0%+ 35.1%242745Mercedes GLC Coupe2660.6%n/a n/an/an/an/a n/a n/a46Hyundai Kona2660.6%+ 1.1% n/a2,4000.8%n/a373947Opel Crossland X2560.6%n/a39n/an/an/a n/a n/a48VW T-Cross2530.6%n/a42n/an/an/a n/a n/a49Audi A62480.6%n/a n/an/an/an/a n/a4750Peugeot 20082370.6%n/a n/an/an/an/an/a n/a n/aSuzuki Vitara2350.6%– 40.5%312,5170.8%+ 12.5%3530 n/aDacia Jogger2260.5%+ 10.2%n/a1,9550.6%+ 2.8%5041 n/aRenault Clio2190.5%– 14.1%502,1430.7%– 0.6%4626n/aToyota Camry2030.5%– 46.3% n/a2,2010.7%+ 28.5%4233 n/aRenault Captur1730.4%– 45.3% n/a2,7360.9%+ 19.8%3136 n/aNissan Qashqai1650.4%– 64.3%263,9051.2%+ 45.2%1728 n/aSuzuki SX4 S-Cross1400.3%– 36.9%251,9910.6%n/a48 n/a n/aCitroen C31020.2%– 50.2%322,2630.7%n/a39 n/a n/aMazda CX-5460.1%– 86.1%133,3231.1%+ 78.2%2044
Source: SAMAR

