
Austria February 2026: Dacia Bigster and Skoda Elroq strong in market up 8.5%
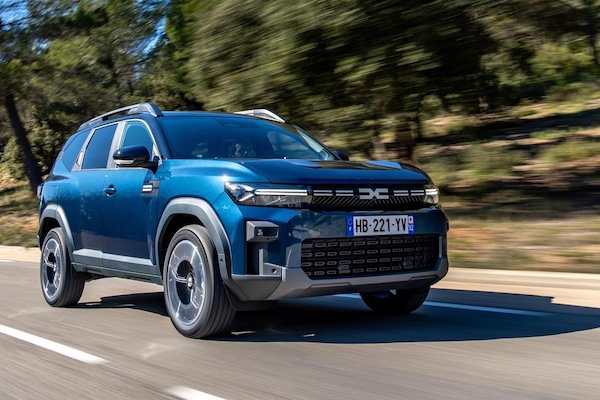
Fifth Top 5 finish for the Dacia Bigster in Austria.
21,288 new cars hit Austrian roads in February, another solid 8.5% year-on-year improvement. After a double-digit gain in January, the year-to-date volume is up 10.4% to 44.217. Volkswagen (+1.7%) remains in the brands lead even though it can’t quite capitalise on the market growth. In contrast Skoda (+16.9%) and Audi (+10.4%) pushed ahead and complete the podium as it was also the case in January. BMW (-21%) is in a rut at #4 while Dacia (+13%) is up four spots on last month to round out the Top 5. Peugeot (+44.3%), Cupra (+21.7%) and Toyota (+15%) also make themselves noticed in the remainder of the Top 10. Below, BYD (+62.8%) at #12, Fiat (+89.4%), MG (+136.1%) and Leapmotor (+463.6%) are among carmakers standing out.
Model-wise, the VW Golf (-13.9%) repeats at #1 for what is only its third win in the past 12 months, it is followed by the Skoda Octavia (-27.5%) in even worse shape. The Toyota Yaris/Cross (+102.7%) doubles its sales year-on-year and surges 15 spots on January to #3. The Dacia Bigster (+40000%) celebrates one year in market with a splendid 4th position, already its 5th Top 5 finish in Austria. The VW Pplo (+23.5%) is down 5 ranks on last month but soars YoY, as do the Audi Q3 (+214.8%), Skoda Elroq (+623.5%), Enyaq (+82.4%), VW Bus (+72.5%), Seat Leon (+71%) and Audi A1 (+169.5%).
Previous month: Austria January 2026: VW Golf at highest in 1.5 years, sales up 12.1%
One year ago: Austria February 2025: Audi Q8 inside Top 5, Renault 5 in Top 20
Full February 2026 Top 54 All brands and Top 20 models below.
Austria February 2026 – brands:
PosBrandFeb-26%/25Jan2026%/25PosFY251Volkswagen2,96213.9%+ 1.7%17,37816.7%+ 25.9%112Skoda2,34611.0%+ 16.9%25,00511.3%+ 11.2%223Audi1,6307.7%+ 10.4%33,3227.5%+ 2.9%344BMW1,1975.6%– 21.0%42,5455.8%– 16.4%435Dacia1,0795.1%+ 13.0%91,9204.3%+ 1.9%756Mercedes1,0675.0%+ 26.7%62,0264.6%+ 8.9%667Seat9854.6%+ 2.3%52,3295.3%+ 6.6%588Cupra8864.2%+ 21.7%81,7283.9%+ 2.4%8109Toyota8363.9%+ 15.0%101,5183.4%+ 3.8%10910Peugeot7523.5%+ 44.3%71,6053.6%+ 54.8%91211Opel7453.5%+ 18.3%141,2992.9%+ 21.5%121412BYD7263.4%+ 62.8%111,3723.1%+ 48.2%111513Renault6623.1%– 6.8%171,1482.6%– 14.8%141114Ford6463.0%– 3.9%121,2712.9%– 0.2%131315Kia5712.7%+ 32.8%161,0782.4%+ 29.3%151716Hyundai4712.2%– 6.2%207651.7%– 35.8%19717Citroen4522.1%+ 7.1%159902.2%+ 33.1%162018Fiat3751.8%+ 89.4%188381.9%+ 144.3%182319Mazda3381.6%– 20.7%216151.4%– 21.8%211620Suzuki3131.5%– 44.8%225581.3%– 40.1%222221Tesla2811.3%+ 7.3%138421.9%+ 72.2%171822Volvo2741.3%+ 35.6%196601.5%+ 31.5%202123MG2291.1%+ 136.1%234631.0%+ 44.7%231924Land Rover1660.8%+ 61.2%273000.7%+ 35.1%253125Jeep1440.7%+ 46.9%253080.7%+ 54.8%242726Leapmotor1240.6%+ 463.6%312190.5%+ 895.5%283227Honda1150.5%+ 32.2%302120.5%+ 24.0%293028Mitsubishi1140.5%– 6.6%262720.6%+ 53.7%262529Omoda1130.5%new322080.5%new305730Nissan1080.5%– 68.7%351480.3%– 75.8%342431Porsche930.4%– 18.4%282020.5%– 24.1%312832Mini900.4%– 27.4%331800.4%– 26.8%322633Alfa Romeo820.4%– 46.4%291790.4%– 25.4%332934Jaecoo770.4%new242460.6%new274235Xpeng500.2%new39750.2%new364336Smart370.2%+ 5.7%36760.2%+ 26.7%353437Polestar320.2%– 33.3%37690.2%– 31.7%373338Lexus270.1%– 3.6%34670.2%+ 52.3%383739KGM/SsangYong230.1%– 30.3%38500.1%+ 22.0%393640Subaru180.1%– 14.3%41280.1%– 22.2%413541DS160.1%+ 60.0%40330.1%+ 65.0%403942Lamborghini100.0%+ 233.3%42170.0%+ 240.0%424043MAN60.0%n/a4790.0%n/a444844Alpine50.0%– 28.6%4590.0%– 47.1%433845Ferrari40.0%– 55.6%4860.0%– 53.8%454146Bentley20.0%– 60.0%4930.0%– 66.7%494447DFM20.0%new5030.0%new506148Aion10.0%new –10.0%new535849BAIC10.0%– 75.0% –10.0%– 75.0%545050Cadillac10.0%n/a –10.0%n/a556451Chrysler 10.0%+ 0.0% –10.0%– 66.7%565552DFSK10.0%+ 0.0% –10.0%– 66.7%574753Forthing10.0%new5120.0%new515954Maserati10.0%n/a5220.0%n/a5254
Austria February 2026 – models:
PosModelFeb-26%/25Jan2026%/25PosFY251VW Golf5072.4%– 13.9%12,0114.5%+ 73.4%122Skoda Octavia4612.2%– 27.5%49272.1%– 35.9%313Toyota Yaris/Cross4522.1%+ 102.7%187431.7%+ 55.8%854Dacia Bigster4011.9%+ 40000.0%117521.7%+ 75100.0%7165Dacia Sandero3781.8%– 4.8%n/a5961.3%– 31.4%15106Seat Ibiza3611.7%– 29.8%67991.8%– 30.1%447VW Polo3521.7%+ 23.5%21,0802.4%+ 101.1%2118Skoda Fabia3451.6%– 0.9%57921.8%+ 9.2%599Audi Q33401.6%+ 214.8%106981.6%+ 240.5%10n/a10BYD Seal3311.6%+ 19.1%136501.5%– 1.4%131511BMW X13181.5%– 5.1%77031.6%– 1.0%9312Skoda Elroq3181.5%+ 623.5%126601.5%+ 385.3%111713Skoda Karoq2901.4%+ 8.2%86591.5%– 3.7%12814VW Bus2761.3%+ 72.5% n/a5111.2%+ 34.5%191215VW Tiguan2661.2%– 17.6%165641.3%– 15.4%16616Seat Leon2651.2%+ 71.0%96271.4%+ 85.0%141417Skoda Enyaq2591.2%+ 82.4%n/a5291.2%+ 57.0%172018Audi A32381.1%+ 41.7%n/an/an/an/an/an/a19Tesla Model Y2261.1%+ 36.1%37691.7%+ 145.7%6720Audi A12211.0%+ 169.5%n/an/an/an/an/an/an/aSkoda Kodiaq2081.0%+ 35.9%175031.1%+ 67.7%20n/an/aVW T-Roc2061.0%– 22.0%145141.2%+ 10.3%18n/an/aBYD Sealion1630.8%+ 66.3%n/a2850.6%+ 81.5%n/an/an/aVW ID.31590.7%– 25.7%n/a2900.7%+ 0.0%n/an/a
Source: Statistik Austria

More Stories
Powerful Reasons Mercedes-AMG’s Latest GT Project Matters More Than You Think
From its base in Affalterbach, Mercedes-AMG has, recently, lifted the lid on a striking new direction for its GT line-up....
Top 5 Brands for Tailor-Made Car Accessories
Your vehicle deserves accessories that match your unique style and specific needs. While mass-produced car accessories serve basic functions, tailor-made...
How Car Finance Protects Your Buying Power in 2026
For many UK buyers, financing a vehicle isn’t just a way to “afford” a better car. It can be a deliberate choice to keep cash...
Hyundai Venus and Earth Concepts Signal a Bold New Ioniq Future for China
Hyundai has never been shy about taking a design risk, but the new Venus and Earth concepts feel like a...
A Chance To Win Tickets To The Wonderful Concours des Légendes 2026
We are delighted to offer you, our readers, another exciting competition. Are you signed up to our newsletter here, and...
How CGI Transforms Automobile Design & Prototyping
Car design has always depended on a mix of imagination, engineering, and revision. A sketch can set the direction, but...