
Australia February 2026: China becomes #1 country of origin, Toyota off -27.8% to lowest share in 3 years
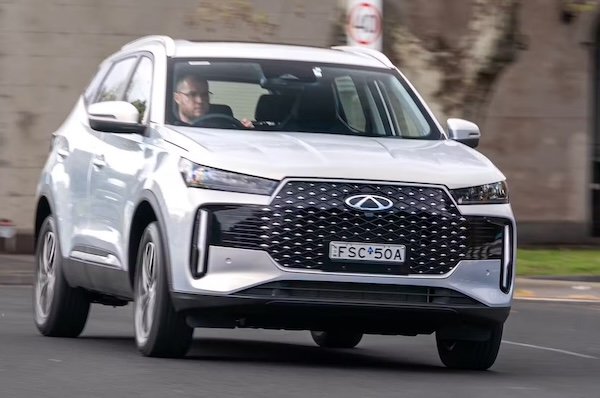
The Chery Tiggo 4 is up to #3 year-to-date in Australia.
New vehicle sales in Australia are down -2.7% year-on-year in February to 94,131 units, leading to a year-to-date volume off -1.3% to 181,884. Petrol sales fall -17.7% to 33,309, diesel limits its fall to -1.6% and 26,963 units and HEVs are off -9.6% to 13,868 but PHEVs soar 20.2% to 5,854. The best performing propulsion is by far BEVs: up a stunning 95.9% to 11,134 for a strong 11.8% market share. SUVs stabilise their share at 60.3% vs. 60.4% in February 2025 due to sales down -2.9% to 56,767. Light commercials are also in negative at -0.7% to 21,191 and 22.5% share vs. 22.1% a year ago and passenger cars edge down -2.4% to 13,170 and 14% share vs. 13.9% last year. Meanwhile heavy commercials are off -12.9% to 3,003 and 3.2% share vs. 3.6% a year ago.
If Victoria is stable (24,732) all other regions are in negative this month (excluding Tesla and Polestar). New South Wales is down -7.6% to 27,524, Queensland down -2.8% to 19,644, Western Australia off -3.9% to 9,841, South Australia at -8.7% to 5,673, Tasmania down -6.4% to 1,384, Australian Capital Territory down -18.7% to 1,187 and Northern Territory off -15.8% to 727. Worryingly, private sales trail the market at -7.7% to 45,182 but fleet sales do the same at -3.4% to 34,444. Only rental sales are dynamic at +35.4% to 5,786 while government sales are down -13.4% to 2,297. The big event of the month is China becoming the biggest source of cars sold in Australia, thanks to sales up 50.5% to 25,781. Meanwhile, Japan is down -31.3% to 21,671, Thailand is up 6.7% to 19,493, South Korea down -2.9% to 11,913 and Germany up 9.8% to 4,272.
The new generation has so far failed to boost Hilux sales in Australia.
After losing -22.3% in January, Toyota (-27.8%) continues its fall to hell with just 14.5% share this month, its lowest in three years: since March 2023 when it hit 13.6% (January 2026 share was incorrect and amended to 16.3%). Toyota suffers from RAV4’s stock drying up (-83.6%) before the new generation hits dealerships at the end of March, and an imploding Prado (-53.3%). Mazda (-19.9%) is also in a rut but manages to stay in 2nd place with 7.5% share. Ford (+9%) is solid and back up one spot on last month to #3 but is stuck in 4th place year-to-date (#2 over the Full Year 2025). Kia (+0.04%) is stable but sister brand Hyundai (+4.5%) is catching up. BYD (+62.2%) lodges another fantastic score and stays in 6th place above a struggling Mitsubishi (-22.3%). Below GWM (+24.9%) at 5% share, Chery (+93.2%) manages an incredible 13th consecutive record volume at 3,938. Isuzu Ute (+23.7%) is also strong while Tesla (+105.7%) is resurgent at #11. A couple of Chinese carmakers make themselves noticed: newcomer Geely breaks its ranking, volume and share records, Zeekr is up 560.6% and Denza lands at #32 with 309 sales.
Model-wise, the Ford Ranger (+7.1%) delivers a satisfying performance at #1, widening the gap with the Toyota Hilux (+0.2%) which has (so far?) failed to benefit from its new generation. The Tesla Model Y (+202.1%) triples its sales year-on-year and shoots up to #3, its highest ranking since last September (#3 also). The Chery Tiggo 4 (+116.8%) repeats at a record #4, a ranking it has held for three of the past four months. It also equals its all-time high share (2.5%) and breaks its volume record (2,315), climbing to #3 year-to-date. The Mazda CX-5 (+8.6%) once again shows surprising form given it will be replaced by a new generation later this year. The GWM Haval Jolion (+38.1%) stays inside the Top 10 with the Ford Everest (+47.3%) and Hyundai Tucson (+15.8%) also showing brilliant form.
Previous month: Australia January 2026: Chinese (+62.9%) pull market up, Toyota down -22.3%
One year ago: Australia February 2025: BYD Shark 6 lands with a bang
Full February 2026 Top 56 All brands and Top 20 models below.
Australia February 2026 – brands:
PosBrandFeb-26%/25Jan2026%/25PosFY251Toyota 13,60614.5%– 27.8%127,91615.3%– 25.1%112Mazda 7,0427.5%– 19.9%214,7348.1%– 13.9%233Ford 6,9077.3%+ 9.0%413,0237.2%– 1.1%424Kia 6,7107.1%+ 0.0%313,3107.3%+ 7.1%345Hyundai 6,2666.7%+ 4.5%512,1226.7%+ 5.7%556BYD5,3235.7%+ 62.2%610,3245.7%+ 161.0%687Mitsubishi4,7555.1%– 22.3%89,1025.0%– 22.9%868GWM4,6895.0%+ 24.9%79,1985.1%+ 28.0%779Chery3,9384.2%+ 93.2%97,7184.2%+ 99.2%91310Isuzu Ute3,3843.6%+ 23.7%116,3133.5%+ 12.6%11911Tesla3,2743.5%+ 105.7%243,7752.1%+ 61.9%151512MG3,2543.5%– 13.0%106,3773.5%– 14.7%101013Subaru 2,6562.8%– 24.4%124,9922.7%– 22.4%121114Mercedes2,1432.3%+ 8.8%144,2922.4%+ 15.2%131615Volkswagen2,1392.3%– 2.1%154,0252.2%– 10.5%141416Nissan1,7751.9%– 50.1%163,6462.0%– 44.7%171217BMW1,6021.7%– 9.5%133,7562.1%+ 18.4%161718Honda 1,4451.5%+ 18.6%172,6671.5%+ 7.6%181919LDV1,1651.2%+ 1.0%182,1251.2%– 9.4%192220Suzuki 9541.0%– 28.2%191,8621.0%– 32.5%202021Geely8930.9%new221,6130.9%new232722Audi8620.9%– 24.7%201,7180.9%– 20.4%211823Lexus8530.9%– 19.1%211,7080.9%– 15.6%222124Omoda Jaecoo8150.9%new231,5060.8%new243225Zeekr6540.7%+ 560.6%251,1230.6%+ 1034.3%253626Volvo6300.7%+ 1.8%261,0460.6%– 11.3%262427Land Rover4640.5%– 26.0%308000.4%– 22.5%282328Mini4320.5%– 0.5%288270.5%+ 5.6%272529Porsche3700.4%– 27.5%277670.4%– 21.6%292630Skoda3490.4%+ 11.9%296910.4%+ 7.8%302831Renault3370.4%– 5.3%316370.4%– 17.8%312932Denza3090.3%new –3090.2%#DIV/0!365733Chevrolet2750.3%– 15.4%335340.3%– 17.5%333134Ram2660.3%+ 3.9%325430.3%+ 8.2%323335KGM2390.3%– 43.6%344470.2%– 39.3%343036Cupra2170.2%+ 17.3%354170.2%+ 12.1%353437Polestar1450.2%+ 16.0%363050.2%+ 47.3%373538Genesis1290.1%+ 17.3%382480.1%+ 15.3%383939JAC1030.1%– 49.5%392210.1%– 45.8%394040Foton990.1%new372190.1%new405141Fiat990.1%– 34.0%411960.1%– 41.1%413742Peugeot850.1%– 14.1%431500.1%– 27.2%434143Deepal710.1%new401700.1%new424544Jeep670.1%– 67.8%421330.1%– 62.3%443845Leapmotor460.0%+ 58.6%441070.1%+ 109.8%454246GMC320.0%new45710.0%new464647Alfa Romeo310.0%– 24.4%46650.0%– 13.3%474448Maserati230.0%+ 21.1%47430.0%+ 0.0%484849Ferrari160.0%– 27.3%48340.0%+ 36.0%494950Bentley150.0%+ 0.0%50270.0%+ 35.0%505251Aston Martin150.0%– 40.0%51220.0%– 31.3%525052Lamborghini130.0%– 55.2%49250.0%– 53.7%514753Farizon130.0%new52200.0%new53 –54Rolls-Royce70.0%– 30.0%53130.0%– 13.3%545555Jaguar40.0%– 91.3%5570.0%– 91.9%564356McLaren30.0%– 66.7%5470.0%– 36.4%5554
Australia February 2026 – models:
PosModelFeb-26%/25Jan2026%/25PosFY251Ford Ranger4,3254.6%+ 7.1%17,7284.2%– 6.8%112Toyota Hilux3,6253.9%+ 0.2%26,4253.5%– 7.1%233Tesla Model Y2,7913.0%+ 202.1%763,0791.7%+ 121.7%13104Chery Tiggo 42,3152.5%+ 116.8%44,5492.5%+ 118.1%3115Mazda CX-52,0992.2%+ 8.6%34,3882.4%+ 15.4%486Isuzu D-Max2,0922.2%+ 3.5%83,8902.1%– 5.3%647Mitsubishi Outlander2,0702.2%– 13.2%54,0452.2%– 9.6%598Hyundai Kona2,0232.1%+ 7.1%73,8622.1%+ 21.1%779Mitsubishi Triton2,0172.1%+ 42.0%133,6822.0%+ 39.3%91710GWM Haval Jolion1,8041.9%+ 38.1%93,5932.0%+ 38.6%101411Ford Everest1,7781.9%+ 47.3%63,6912.0%+ 27.9%8512Hyundai Tucson1,7051.8%+ 15.8%123,4341.9%+ 18.2%111213Kia Sportage1,4051.5%– 27.1%182,6701.5%– 28.9%141514Toyota Corolla1,3961.5%– 10.6%113,1311.7%– 0.4%121615MG ZS1,3371.4%– 22.3%172,6041.4%– 11.2%161316BYD Sealion 71,3271.4%+ 745.2%202,4981.4%+ 1491.1%182517Isuzu MU-X1,2921.4%+ 81.2%162,6031.4%+ 73.6%172018Toyota Prado1,2731.4%– 53.3%142,6651.5%– 52.2%15619Toyota Camry1,1531.2%+ 138.7%322,0281.1%+ 108.9%213620GWM Haval H61,1421.2%+ 4.4%242,1791.2%+ 19.7%2026
Source: VFACTS, Electric Vehicle Council


More Stories
Turkiye March 2026: Toyota C-HR and VW Taigo at all-time high
The Toyota C-HR is up to a record #2 in Turkiye in March. The Turkish new light vehicle market continues...
Argentina March 2026: Toyota and Peugeot 208 in the lead in strongest market in 8 years
The new Toyota Yaris Cross lands at #12. The Argentinean new light vehicle market edges up 0.3% year-on-year in March...
Israel March/Q1 2026: Jaecoo places 7, 5 and 8 in Top 10, Chinese at 38.3% share
The Jaecoo 5 is #1 in Israel in February and March. According to our local partner cartube.co.il, 26,356 new light...
Norway March 2026: BEVs at record 98.4%, Tesla hits highest share in 3 years
The Tesla Model Y holds 24.2% of the Norwegian market in March. After two month handicapped by an increase in...
Chevy Camaro Comeback Rumored as GM Preps New Buick Sedan and Next Cadillac CT5
General Motors may be getting ready to give car enthusiasts something they have been missing. As first reported by Automotive...
Ford Recalls More Than 422,000 Trucks and SUVs Over Windshield Wiper Defect
Ford has issued another significant recall, this time involving more than 422,000 trucks and SUVs because of a windshield wiper...