
New Zealand November 2025: Toyota RAV4 #1, Suzuki Fronx in Top 10
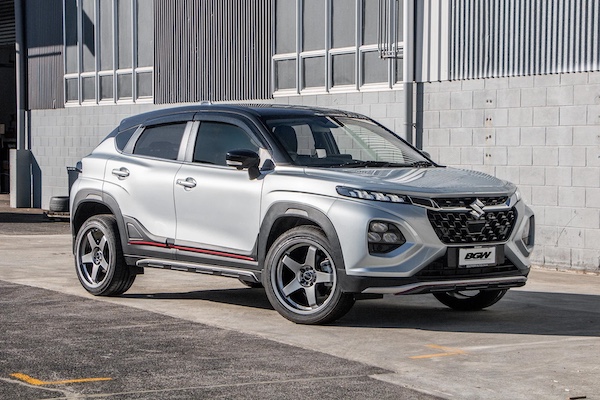
Second ever Top 10 finish in New Zealand for the Suzuki Fronx.
New vehicle sales in New Zealand drop -12.8% year-on-year in November to 13,615 units, yet the year-to-date tally remains in clear positive at +8.5% to 128,769. Toyota (-14%) single handedly pulls the market down, with the next 9 carmakers up. BYD (+224.8%) is the most dynamic of all and is inside the Top 10 for the 6th time this year. Kia (+128.7%) is also very dynamic YoY at #4, but that’s compared to a particularly low year-ago result. Honda (+46.2%), Mazda (+36.5%), Hyundai (+35.9%), Mitsubishi (+30.8%), MG (+26.5%) and Suzuki (+25.3%) also shine while Ford (+11.7%) is more discreet but still manages a double-digit gain and at 13.3% share, it is two percentage points above its YTD level.
Model-wise, the Toyota RAV4 (-33%) remains the dominant force with 9.2% share, the steep fall being due to a record November 2024 at 12% share. The Ford Ranger (+26.5%) follows, ahead of the Toyota Hilux (+12.7%) and Mitsubishi ASX (+67.6%), replicating the YTD Top 4. Excellent result also for the Ford Everest at #5 and 3.9% share vs. 2.4% so far this year. The Mitsubishi Outlander (+167.3%) does even better at #6 while the Toyota Yaris Cross (+3.9%) edges up YoY at #7. Second ever Top 10 finish for the new Suzuki Fronx at #8. The BYD Shark 6 is just outside the Top 20.
Previous month: New Zealand October 2025: RAV4, Yaris Cross, Corolla push Toyota to highest in almost 6 years
One year ago: New Zealand November 2024: Toyota RAV4 hits record share
Full November 2025 Top 20 brands and models below.
New Zealand November 2025 – brands:
PosBrandNov-25%/24Oct2025%/24PosFY241Toyota3,51925.8%– 14.0%131,11424.2%+ 11.7%112Ford 1,81713.3%+ 11.7%214,52111.3%– 9.3%223Mitsubishi1,3289.8%+ 30.8%313,12510.2%+ 1.1%334Kia7735.7%+ 128.7%48,6286.7%+ 6.5%445Mazda5914.3%+ 36.5%64,5753.6%+ 23.4%686Suzuki5804.3%+ 25.3%94,6663.6%– 6.3%557Hyundai4773.5%+ 35.9%54,0013.1%+ 3.6%878Honda4273.1%+ 46.2%83,3962.6%+ 21.5%11109BYD3932.9%+ 224.8%143,5102.7%+ 317.9%102210MG3682.7%+ 26.5%73,8733.0%+ 37.5%91111Volkswagen3162.3%– 0.3%152,2501.7%– 28.3%13912GWM2762.0%+ 37.3%103,3732.6%+ 21.9%121213Nissan2071.5%– 15.2%114,4063.4%+ 5.8%7614Chery1811.3%new128940.7%new249315Subaru1681.2%+ 14.3%162,1351.7%+ 24.5%141516Mercedes1521.1%– 39.9%132,0941.6%– 8.0%151417BMW1501.1%+ 94.8%181,6941.3%+ 27.7%161618Tesla1481.1%+ 604.8%n/a1,3931.1%+ 34.3%181819Isuzu1471.1%– 29.7%191,6831.3%– 31.6%171320Audi1270.9%+ 51.2%201,2461.0%+ 20.9%2120
New Zealand November 2025 – models:
PosModelNov-25%/24Oct2025%/24PosFY241Toyota RAV41,2579.2%– 33.0%110,3958.1%+ 9.0%122Ford Ranger 1,0307.6%+ 26.5%28,8946.9%– 13.4%213Toyota Hilux6214.6%+ 12.7%37,8556.1%+ 14.3%334Mitsubishi ASX5584.1%+ 67.6%74,6353.6%+ 31.5%455Ford Everest5273.9%+ 37.6%63,1092.4%+ 43.7%7106Mitsubishi Outlander4253.1%+ 167.3%44,0783.2%+ 31.0%567Toyota Yaris Cross3482.6%+ 3.9%5n/an/an/an/a138Suzuki Fronx3022.2%newn/an/an/anewn/a –9Hyundai Tucson2722.0%n/a91,6261.3%n/a14n/a10Toyota Corolla2712.0%– 35.3%81,8701.5%+ 8.5%111211Kia Seltos2241.6%+ 286.2%123,1612.5%+ 6.2%6712Toyota Highlander2171.6%– 1.8%n/an/an/an/an/a2013Mitsubishi Triton2031.5%– 21.6%102,9932.3%– 26.1%8414Mazda CX-51961.4%+ 12.6%221,5081.2%– 5.1%171615Toyota Hiace1831.3%+ 52.5%111,9331.5%+ 16.4%101516Toyota Prado1641.2%– 18.4%201,5931.2%n/a15n/a17MG ZS1631.2%+ 20.7%171,8661.4%+ 32.3%121818Toyota Yaris1621.2%+ 26.6%16n/an/an/an/an/a19Kia Sportage1591.2%+ 261.4%14n/an/an/an/a1420Mercedes Sprinter1551.1%+ 25.0%n/an/an/an/an/an/an/aBYD Shark 61391.0%newn/a1,7541.4%new13 –n/aFord Transit1180.9%+ 16.8%251,1970.9%– 12.5%2019n/aFiat Ducato850.6%– 56.0%n/an/an/an/an/an/an/aIsuzu D-Max830.6%– 11.7%n/a7810.6%– 37.2%n/an/an/aNissan Navara810.6%– 28.9%n/a2,2381.7%+ 23.2%911
Source: Auto Talk


More Stories
How Mechanical Design Influences the Feel of a Vehicle
You know that feeling. You slide into the driver’s seat. You press the start button. The vehicle comes alive. It...
Competition Time. Chance to win a Smallest Cog goodies bundle.
The Smallest Cog Unveils Exciting New Merchandise Range Inspired by Richard Hammond’s iconic restoration workshop, The Smallest Cog’s exclusive new...
Florida Tolls Could Vanish for Residents as Tourists Pick Up the Tab
Florida drivers may eventually cruise the Turnpike without paying a cent at the toll gantries if a new idea from...
Extending Vehicle Lifespan Through Proven Engine Technology
We all want our cars to last. A vehicle is a major investment. It gets us to work. It takes...
China retail November 2025: Fang Cheng Bao, Lynk & Co hit all-time highs, market off -16.8% on high year ago basis
This content is for members only. Visit the site and log in/register to read.
China imports November 2025: Market down -20%, BMW 7 Series (+88.9%) and 2 Series (+53.8%) shoot up
This content is for members only. Visit the site and log in/register to read.