
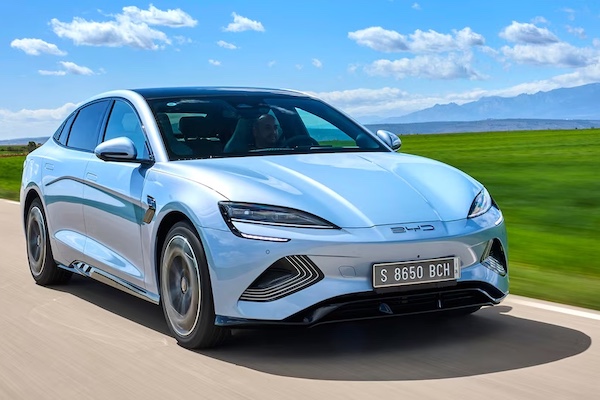
Singapore November 2025: BYD up 116.5%, Toyota down -25.2%
BYD sales are up 116.5% year-on-year in November.
4,395 new light vehicles hit Singaporean roads in November, a strong 21.9% year-on-year uptick leading to a year-to-date volume up 23.2% to 46,288. BYD (+116.5%) signs a 10th straight month in pole position, now outselling #2 Toyota (-25.2%), in great difficulty, 2.3 to 1. Mercedes (-0.2%) is stable year-on-year but up two spots on October to #3, distancing Tesla (+81.7%), also up two to #4 and Honda (+14.9%) down two to #5. Zeekr (+423.5%) remains inside the Top 10 vs. #19 year-to-date, with Suzuki (+352.9%), MG (+347.1%), Chery (+247.8%) and Subaru (+156.7%) all lodging surreal gains.
Previous month: Singapore October 2025: BYD reaches record 26.5% share, beats Toyota 2 to 1
One year ago: Singapore November 2024: Tesla, Porsche, BYD among biggest gainers in market up 41.9%
Full November 2025 Top 48 All brands ranking below.
Singapore November 2025 – brands:
PosBrandNov-25%/24Oct2025%/24PosFY241BYD1,10025.0%+ 116.5%19,62320.8%+ 89.9%122Toyota (incl Lexus)48511.0%– 25.2%26,44213.9%– 0.4%213Mercedes4159.4%– 0.2%54,4569.6%– 4.8%434Tesla4079.3%+ 81.7%63,1676.8%+ 51.5%665Honda3718.4%+ 14.9%34,2679.2%+ 25.3%556BMW2986.8%– 20.5%44,61210.0%– 0.0%347Mazda1092.5%+ 0.0%111,1082.4%– 3.4%898Hyundai1012.3%– 32.7%91,3352.9%– 29.9%779Kia1002.3%+ 31.6%171,0862.3%– 2.3%91010Zeekr892.0%+ 423.5%75841.3%+ 612.2%192711Chery801.8%+ 247.8%106461.4%+ 625.8%152612Subaru771.8%+ 156.7%156021.3%+ 64.0%171613Suzuki771.8%+ 352.9%263520.8%+ 59.3%212014MG761.7%+ 347.1%128131.8%+ 60.0%121515Audi671.5%+ 24.1%136561.4%+ 17.8%141316GAC661.5%+ 112.9%148861.9%+ 202.4%111917Xpeng631.4%+ 14.5%87991.7%+ 199.3%131818Nissan611.4%– 29.1%189882.1%– 33.1%10819Porsche581.3%– 45.3%166171.3%+ 18.9%161220Volvo431.0%+ 10.3%195971.3%+ 18.5%181421Dongfeng390.9%+ 1200.0%242730.6%+ 9000.0%234022Volkswagen290.7%– 79.9%205351.2%– 10.1%201123Mini260.6%– 16.1%232630.6%+ 35.6%242124Skoda200.5%– 42.9%252840.6%– 7.8%221725AvatR180.4%new22610.1%new31 –26Geely160.4%new39300.1%new37 –27Maxus160.4%+ 60.0%211900.4%+ 131.7%252828Land Rover130.3%+ 62.5%271800.4%+ 16.9%262329Leapmotor130.3%new49140.0%new44 –30Peugeot100.2%+ 66.7%41830.2%– 52.0%302231Polestar90.2%– 72.7%301380.3%+ 17.9%272532Smart60.1%+ 20.0%43550.1%+ 103.7%323233Chevrolet50.1%n/a4090.0%+ 800.0%474834Cupra50.1%new34380.1%new34 –35Deepal50.1%new281010.2%new28 –36Citroen40.1%+ 100.0%31370.1%– 50.0%353037Alfa Romeo30.1%+ 0.0%4770.0%– 66.7%494138Great Wall30.1%+ 0.0%33920.2%– 35.2%292439Bentley20.0%+ 0.0%36210.0%– 8.7%383640Lotus20.0%– 33.3%37200.0%– 16.7%403841Eveasy10.0%new29120.0%new46 –42Ferrari10.0%n/a44210.0%– 27.6%393343Jaguar10.0%+ 0.0%32160.0%– 40.7%423544Lamborghini10.0%+ 0.0%38160.0%+ 14.3%434245Maserati10.0%– 50.0% –360.1%– 58.6%362946Opel10.0%n/a42530.1%+ 35.9%333147Seres10.0%n/a –40.0%+ 300.0%525348Skyworth10.0%new35190.0%new4155
Source: LTA

More Stories
Powerful Reasons Mercedes-AMG’s Latest GT Project Matters More Than You Think
From its base in Affalterbach, Mercedes-AMG has, recently, lifted the lid on a striking new direction for its GT line-up....
Top 5 Brands for Tailor-Made Car Accessories
Your vehicle deserves accessories that match your unique style and specific needs. While mass-produced car accessories serve basic functions, tailor-made...
How Car Finance Protects Your Buying Power in 2026
For many UK buyers, financing a vehicle isn’t just a way to “afford” a better car. It can be a deliberate choice to keep cash...
Hyundai Venus and Earth Concepts Signal a Bold New Ioniq Future for China
Hyundai has never been shy about taking a design risk, but the new Venus and Earth concepts feel like a...
A Chance To Win Tickets To The Wonderful Concours des Légendes 2026
We are delighted to offer you, our readers, another exciting competition. Are you signed up to our newsletter here, and...
How CGI Transforms Automobile Design & Prototyping
Car design has always depended on a mix of imagination, engineering, and revision. A sketch can set the direction, but...