
Slovakia October 2025: Citroen (+89.4%), Ford (+31.7%) highlight negative market
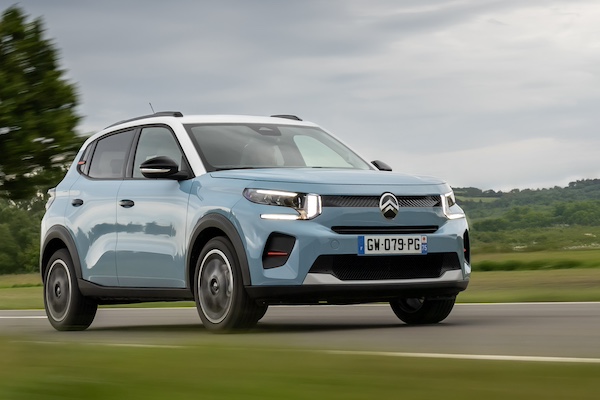
The Citroen C3 is up 478.9% in October.
Note: September data is also included in the data section of this article.
New car sales in Slovakia skid -8.3% year-on-year in October to 8,215 units, meaning the year-to-date tally is now down -1.1% to 75,669. No surprises on top of the brands ranking: Skoda (-9.2%) dominates with 22.7% share vs. 20.9% so far this year. Kia (-10.7%) stays at #2 while Toyota (+0.3%) overtakes Volkswagen (-21.6%) to third place. Hyundai (-33.3%) struggles at #5 unlike Citroen (+89.4%), Dacia (+22.9%), Ford (+31.7%) and Mercedes (+14%).
Model-wise, the Skoda Octavia (+21%) is above the competition at 5.3% share, distancing the Skoda Fabia (-22%) up two spots on last month to #2. The Kia Sportage (+7%) is up three to #3 whereas the next three models all freefall: the Skoda Karoq loses -18.6%, the Kia Ceed is at -18.7% and the Hyundai i30 at -35.8%. The Skoda Scala (-1%) resists better but the Skoda Kodiaq (-19.3%) and Kamiq (-44.4%) disappoint. The Toyota Yaris Cross (+229.5%), Ford Kuga (+140.7%) and Toyota Corolla Cross (+193.8%) surge.
Previous post: Slovakia August 2025: Kia Ceed edges past Skoda Octavia
One year ago: Slovakia October 2024: Skoda, Volkswagen help push market up 14.8%
Full September and October 2025 Top 41 All brands and Top 259 All models below.
Slovakia September 2025 – brands:
PosBrandSep-25%/24Aug1Skoda1,52121.2%+ 10.8%12Kia6869.5%– 1.3%33Volkswagen6378.9%+ 8.7%24Toyota6158.6%– 1.9%45Hyundai5427.5%– 6.2%56Mercedes3034.2%+ 33.5%127Dacia2954.1%+ 34.7%68Peugeot2884.0%+ 10.3%109Ford2773.9%+ 79.9%710Citroen2593.6%+ 47.2%811Audi2223.1%+ 23.3%1112BMW1942.7%+ 19.0%1313Renault1922.7%+ 24.7%1414Suzuki1712.4%+ 85.9%915Opel1502.1%– 26.8%1516MG1061.5%+ 29.3%1617Nissan1031.4%+ 35.5%1718Ssangyong801.1%– 2.4%1919Cupra550.8%+ 150.0%2220Honda540.8%– 19.4%1821Volvo520.7%– 10.3%2522Alfa Romeo490.7%+ 512.5%2423Seat440.6%– 33.3%2024Land Rover390.5%– 25.0%2625Lexus380.5%– 47.2%2126Jeep380.5%+ 22.6%2727Fiat330.5%– 58.8%2828Porsche310.4%+ 29.2%2929Mazda280.4%– 53.3%2330Mitsubishi280.4%+ 180.0%3431BYD170.2%new3132Leapmotor120.2%new3233Subaru100.1%– 50.0%3034Mini80.1%+ 33.3%3335Xpeng30.0%new3536MAN30.0%n/a3837DS20.0%– 77.8%3638DR20.0%new –39FAW10.0%new41
Slovakia September 2025 – models:
PosModelSep-25%/24Aug1Skoda Octavia4025.6%+ 80.3%22Kia Ceed2894.0%+ 15.1%13Skoda Karoq2473.4%+ 61.4%84Skoda Fabia2443.4%– 27.2%35Hyundai i302122.9%– 10.2%76Kia Sportage1802.5%– 22.4%47Skoda Scala1652.3%– 11.8%98Skoda Kamiq1582.2%– 30.7%129Skoda Kodiaq1361.9%+ 13.3%2010Ford Kuga1221.7%+ 617.6%1811Toyota RAV41211.7%+ 86.2%2212Toyota Yaris1111.5%+ 13.3%1613VW Tiguan991.4%– 40.0%1314Hyundai Tucson991.4%– 10.0%615Dacia Sandero991.4%+ 3.1%4216Dacia Duster971.3%+ 1.0%1517VW T-Roc971.3%+ 136.6%2118Toyota Corolla951.3%– 14.4%1919Toyota Yaris Cross941.3%+ 80.8%1420Suzuki SX4 S-Cross891.2%+ 134.2%1121Peugeot 208831.2%+ 16.9%3222Skoda Superb821.1%– 21.2%2723Citroen C4821.1%+ 82.2%3124VW Golf811.1%+ 88.4%1725VW T-Cross771.1%– 18.9%526Toyota Corolla Cross761.1%+ 16.9%2327Hyundai i20731.0%– 23.2%1028Kia Stonic670.9%– 1.5%2629Suzuki Vitara660.9%+ 61.0%4630Hyundai Bayon660.9%+ 106.3%6731Nissan Qashqai650.9%+ 3.2%2832MG ZS640.9%+ 56.1%2433Peugeot 3008630.9%+ 23.5%8634Audi Q3630.9%+ 117.2%5635Skoda Elroq610.8%new2936Toyota C-HR600.8%– 33.3%3537Audi Q5600.8%+ 57.9%6938Mercedes GLC590.8%+ 43.9%6339Opel Frontera580.8%new3440VW Taigo570.8%+ 21.3%3741Kia Proceed 550.8%+ 189.5%5242Dacia Jogger540.8%+ 100.0%4443VW Tayron530.7%new5444SsangYong Korando470.7%– 4.1%3045Citroen C3470.7%+ 30.6%3346Alfa Romeo Junior450.6%+ 4400.0%3847Ford Puma440.6%+ 144.4%4548Renault Trafic430.6%+ 65.4%3949Citroen Berlingo420.6%– 20.8%7450VW Touareg420.6%+ 20.0%4351Kia Xceed410.6%– 35.9%5752Renault Clio410.6%– 10.9%7853Dacia Bigster410.6%new2554Mercedes GLE400.6%+ 66.7%6555Hyundai Kona390.5%+ 50.0%4156Peugeot 2008380.5%– 40.6%5057Mercedes GLS370.5%+ 60.9%8158Citroen C3 Aircross360.5%+ 100.0%6059Peugeot 508350.5%+ 105.9%7560Nissan X-Trail350.5%+ 337.5%5861Jeep Avenger340.5%+ 126.7%7062Mercedes V Class320.4%+ 300.0%8763Citroen C5 Aircross300.4%+ 650.0%4864VW Touran290.4%– 32.6%4065Renault Austral290.4%+ 20.8%10166Cupra Terramar280.4%n/a7267BMW X5270.4%+ 3.8%8868Peugeot 5008270.4%+ 125.0%10469Ford Transit/Tourneo Custom270.4%+ 200.0%5170Mitsubishi ASX270.4%+ 440.0%18471Toyota Proace City Verso270.4%+ 575.0%7972VW Multivan260.4%+ 160.0%4973Opel Grandland260.4%+ 766.7%5374Mercedes GLA250.3%+ 38.9%13575Opel Mokka250.3%+ 92.3%9376BMW 2 Series Active/Gran Tourer250.3%+ 1150.0%15477Ford Courier240.3%– 17.2%11678Renault Captur240.3%– 11.1%6679MG HS240.3%+ 26.3%5580BMW X3220.3%+ 83.3%6881Mercedes A Class220.3%+ 83.3%17082Opel Astra220.3%+ 83.3%16583Hyundai Santa Fe210.3%+ 0.0%8984Audi A3210.3%+ 40.0%4785Porsche Cayenne210.3%+ 162.5%9186Audi Q8200.3%– 39.4%8587Honda HR-V200.3%– 9.1%10388Citroen Spacetourer200.3%+ 11.1%9589Volvo XC60200.3%+ 25.0%6490Renault Symbioz200.3%new11291BMW 4 Series190.3%+ 90.0%8092Hyundai i10180.3%– 65.4%12793VW Passat180.3%– 52.6%7194VW Caddy180.3%– 33.3%8295Mercedes GLB180.3%+ 63.6%14296Peugeot Rifter180.3%new10697Ford Focus Combi170.2%– 15.0%13998Land Rover Defender170.2%– 15.0%7699Audi Q7170.2%+ 0.0%108100BMW 5 Series170.2%+ 88.9%102101BYD Sealion 7170.2%new99102Kia Sorento160.2%– 44.8%73103Seat Leon160.2%+ 6.7%59104VW ID.7160.2%+ 33.3%122105Kia Picanto160.2%+ 77.8%133106Lexus ES160.2%+ 128.6%153107Peugeot Traveller160.2%+ 128.6%77108Seat Arona150.2%– 6.3%92109Mercedes CLA150.2%+ 0.0%168110Skoda Enyaq150.2%+ 150.0%98111BMW X7140.2%– 26.3%90112Fiat Panda140.2%+ 180.0%125113Toyota Land Cruiser140.2%n/a179114Ford Transit/Tourneo Connect130.2%– 70.5%109115Seat Ateca 130.2%– 55.2%117116MG 3130.2%– 31.6%134117Volvo XC40130.2%– 18.8%120118SsangYong Torres130.2%+ 8.3%128119Audi A6130.2%+ 18.2%110120Ford Explorer130.2%+ 85.7%194121Suzuki Swift130.2%+ 85.7%94122Toyota Aygo X120.2%– 82.1%113123Ssangyong Rexton120.2%+ 33.3%183124Audi A5120.2%+ 140.0%61125Fiat 600120.2%+ 200.0%97126VW Caravelle120.2%n/a150127BMW X1110.2%– 60.7%115128Skoda Enyaq Coupe110.2%– 35.3%158129Cupra Formentor110.2%– 8.3%107130Cupra Leon110.2%+ 57.1%111131Renault 5110.2%new181132Range Rover Sport100.1%+ 66.7%124133Ford Capri100.1%new131134Peugeot 30890.1%– 70.0%126135Honda ZR-V90.1%– 55.0%121136Honda CR-V90.1%– 50.0%36137Mazda CX-3090.1%– 47.1%83138Lexus RX90.1%– 10.0%84139BMW 2 Series90.1%+ 50.0%186140Opel Vivaro90.1%+ 80.0%140141Audi Q690.1%+ 800.0%156142Honda Jazz90.1%+ 800.0%148143Kia EV390.1%new195144Leapmotor C1090.1%new160145Kia EV490.1%new –146Renault Arkana80.1%+ 60.0%138147Mini 80.1%+ 100.0%129148Opel Corsa70.1%– 89.6%62149Mercedes Vito70.1%– 46.2%202150BMW 3 Series70.1%– 30.0%161151Mazda CX-6070.1%– 30.0%132152Volvo EX3070.1%– 22.2%224153Honda Civic70.1%+ 16.7%143154Mercedes S Class70.1%+ 16.7%174155Fiat Doblo70.1%+ 600.0%196156Hyundai Inster70.1%new240157Volvo XC9060.1%– 57.1%141158Mercedes E Class60.1%– 50.0%136159Porsche Macan60.1%– 40.0%222160BMW X660.1%+ 100.0%123161BMW 7 Series60.1%+ 200.0%207162Mazda CX-8060.1%+ 200.0%149163VW ID.360.1%+ 200.0%191164BMW iX160.1%+ 500.0% –165Toyota Proace50.1%– 90.7%114166Lexus NX50.1%– 86.8%100167Mercedes G Class50.1%– 76.2%119168Ssangyong Tivoli50.1%– 58.3%151169Mercedes C Class50.1%– 54.5%147170Subaru Crosstrek50.1%– 37.5%118171BMW X450.1%+ 0.0%167172Renault Rafale50.1%+ 0.0%155173Cupra Ateca50.1%+ 150.0% –174Mercedes CLE50.1%+ 150.0%173175MG S550.1%new244176Lexus LBX40.1%– 42.9%152177Lexus UX40.1%– 42.9%137178Mazda640.1%– 42.9% –179Land Rover Discovery40.1%– 33.3%163180Land Rover Discovery Sport40.1%+ 0.0%226181Renault Megane40.1%+ 0.0% –182Mercedes EQE40.1%+ 33.3%223183BMW iX340.1%+ 100.0% –184Mercedes EQS40.1%+ 300.0% –185Dacia Spring40.1%n/a197186Hyundai Ioniq940.1%new252187Mercedes Maybach40.1%n/a250188VW ID.430.0%– 72.7%96189BMW X230.0%– 66.7%221190Audi A130.0%– 62.5% –191Subaru Outback30.0%– 57.1%145192Renault Espace30.0%– 50.0%190193BMW XM30.0%– 40.0%185194Jeep Compass30.0%– 40.0%130195BMW i430.0%– 25.0%146196Ford Mustang30.0%– 25.0%205197Ford Transit30.0%– 25.0% –198Opel Combo30.0%– 25.0%220199Alfa Romeo Stelvio30.0%+ 0.0%175200Nissan Juke30.0%+ 0.0%171201Range Rover Velar30.0%+ 50.0%189202Suzuki Across30.0%+ 200.0%198203Hyundai Staria30.0%n/a241204Leapmotor T0330.0%new164205MAN TGE30.0%n/a213206SsangYong Actyon30.0%new215207Xpeng G930.0%new199208DS 720.0%– 77.8%188209Renault Kangoo20.0%– 75.0%144210VW ID.520.0%– 71.4%178211Kia EV620.0%– 66.7%200212Subaru Forester20.0%– 33.3%204213Mercedes EQB20.0%+ 0.0% –214Audi Q220.0%+ 100.0%162215Mercedes B Class20.0%+ 100.0%209216Mercedes Citan20.0%+ 100.0% –217Volvo V6020.0%+ 100.0%247218Citroen Jumpy20.0%n/a –219DR 5.020.0%new –220Mercedes AMG GT20.0%n/a208221Mercedes EQA20.0%n/a228222Volvo EX9020.0%new –223Kia Niro10.0%– 92.9%166224Range Rover10.0%– 91.7%172225Mazda210.0%– 83.3%169226Mazda310.0%– 83.3%105227BMW IX10.0%– 80.0%206228VW Polo10.0%– 80.0%201229Kia EV910.0%– 66.7%192230Porsche Panamera10.0%– 66.7%242231Alfa Romeo Giulia10.0%– 50.0%236232Audi A710.0%– 50.0%229233Audi A810.0%– 50.0%210234Porsche 91110.0%– 50.0%157235Ford Mustang Mach-E10.0%+ 0.0% –236Jeep Wrangler10.0%+ 0.0% –237Porsche Taycan10.0%+ 0.0%231238Volvo C4010.0%+ 0.0% –239BMW i510.0%n/a193240FAW Hongqi EHS710.0%new251241Mercedes Sprinter10.0%n/a176242Mitsubishi Outlander10.0%n/a212243Renault 410.0%new –244Renault Scenic E-Tech10.0%new –245Volvo S6010.0%n/a –246Porsche 718 Spyder10.0%n/a247Morelo Empire Liner10.0%new –
Slovakia October 2025 – brands:
PosBrandOct-25%/24Sep2025 1-10%/24PosFY241Skoda1,86122.7%– 9.2%115,82120.9%– 0.2%112Kia7629.3%– 10.7%27,2439.6%– 0.0%333Toyota7609.3%+ 0.3%46,7398.9%– 10.9%424Volkswagen7238.8%– 21.6%37,2609.6%+ 1.5%245Hyundai5186.3%– 33.3%55,9087.8%– 17.1%556Citroen3754.6%+ 89.4%102,7563.6%+ 36.8%7127Dacia3223.9%+ 22.9%72,8753.8%– 12.9%668Ford2953.6%+ 31.7%92,3553.1%+ 37.1%10139Mercedes2613.2%+ 14.0%62,5873.4%– 4.9%9710Audi2402.9%– 7.3%112,0802.7%+ 45.4%121511Suzuki2362.9%+ 17.4%141,6562.2%– 17.6%141112BMW2332.8%+ 8.9%122,1662.9%– 1.3%111013Peugeot2162.6%– 48.7%82,6853.5%– 2.0%8814Renault1632.0%– 9.9%131,8252.4%– 3.1%13915Opel1431.7%– 24.3%151,5862.1%+ 10.8%151616MG1051.3%– 30.0%161,2651.7%+ 18.4%161717Fiat1021.2%+ 20.0%273560.5%– 26.4%272418Volvo1011.2%+ 24.7%217341.0%+ 2.7%192219Ssangyong981.2%– 17.6%188811.2%– 5.1%181820Mazda861.0%– 9.5%296110.8%– 39.0%241921Cupra770.9%+ 234.8%196040.8%+ 77.1%252722Lexus700.9%– 32.7%256480.9%– 26.5%232123Honda610.7%– 6.2%206650.9%+ 23.8%212324Seat580.7%– 38.9%236670.9%– 22.0%202025Alfa Romeo570.7%+ 418.2%223240.4%+ 256.0%283226Nissan550.7%– 71.2%171,0131.3%– 26.5%171427Jeep540.7%– 20.6%266550.9%+ 99.7%222828Land Rover490.6%– 5.8%245120.7%+ 9.4%262529Porsche280.3%– 17.6%282860.4%+ 5.5%292930BYD260.3%new31900.1%new33 –31Subaru250.3%+ 25.0%332840.4%– 22.4%302632Leapmotor140.2%new32370.0%new36 –33DongFeng110.1%+ 1000.0% –460.1%+ 31.4%353534DS70.1%+ 0.0%37580.1%+ 1.8%343335Mitsubishi60.1%– 45.5%301850.2%+ 17.1%313036Mini60.1%– 45.5%341150.2%+ 4.5%323137Xpeng60.1%new35140.0%new39 –38DR20.0%new3880.0%new42 –39Voyah10.0%n/a –200.0%+ 566.7%374040MAN10.0%n/a36190.0%+ 171.4%383841FAW10.0%new3930.0%new43 –
Slovakia October 2025 – models:
PosModelOct-25%/24Sep2025 1-10%/24PosFY241Skoda Octavia4385.3%+ 21.0%13,7545.0%+ 2.6%112Skoda Fabia3364.1%– 22.0%42,6243.5%– 19.5%323Kia Sportage2903.5%+ 7.0%62,0782.7%– 3.4%554Skoda Karoq2843.5%– 18.6%32,2593.0%+ 10.9%475Kia Ceed2663.2%– 18.7%23,0134.0%+ 19.0%246Hyundai i302242.7%– 35.8%51,7092.3%– 44.2%737Skoda Scala2022.5%– 1.0%71,6902.2%– 7.6%888Skoda Kodiaq1882.3%– 19.3%91,7792.4%+ 14.0%6109Skoda Kamiq1802.2%– 44.4%81,6532.2%– 24.4%9610Toyota Yaris Cross1451.8%+ 229.5%198611.1%+ 4.6%212511Ford Kuga1421.7%+ 140.7%107791.0%+ 42.7%253612Toyota Corolla Cross1411.7%+ 193.8%266690.9%+ 23.7%314113Hyundai Tucson1351.6%– 8.8%141,4261.9%+ 9.1%101214Toyota Corolla1211.5%– 18.8%181,2781.7%– 12.6%121115Toyota RAV41131.4%+ 76.6%119681.3%– 6.7%192016Citroen C41121.4%+ 10.9%236700.9%+ 34.5%303917Suzuki SX4 S-Cross1121.4%+ 45.5%208081.1%– 14.0%242118Citroen C31101.3%+ 478.9%451,0911.4%+ 1.8%152219Dacia Bigster1081.3%new534520.6%new48 –20Skoda Superb1061.3%– 20.9%221,0491.4%– 6.3%161421VW T-Cross1031.3%– 51.2%251,1321.5%– 24.7%141322Suzuki Vitara981.2%+ 19.5%295910.8%– 18.5%352923VW Taigo981.2%+ 30.7%408421.1%+ 9.6%222724VW Tiguan921.1%– 39.9%131,0351.4%– 14.3%171525Toyota C-HR891.1%– 36.4%366960.9%– 32.8%281926Toyota Yaris871.1%– 25.6%129921.3%+ 32.3%182427Skoda Elroq811.0%new356320.8%new32 –28VW Golf811.0%– 30.8%249601.3%– 8.0%201729Kia Stonic801.0%+ 27.0%286140.8%– 19.6%332830Citroen Berlingo750.9%+ 257.1%494190.6%+ 147.9%529131Dacia Sandero730.9%– 7.6%156860.9%– 20.0%292332Dacia Duster710.9%– 49.6%161,1481.5%– 37.2%13933VW Tayron710.9%new434260.6%new51 –34MG ZS680.8%+ 21.4%328161.1%+ 19.6%232635Peugeot 208650.8%– 38.7%217751.0%+ 1.4%263036VW T-Roc650.8%+ 4.8%175130.7%– 0.2%414237Audi Q3640.8%+ 4.9%344840.6%+ 49.4%426038Dacia Jogger570.7%+ 42.5%425140.7%– 8.1%403339Fiat Panda550.7%+ 816.7%112950.1%+ 239.3%14022040Opel Frontera550.7%new393120.4%new60 –41Alfa Romeo Junior540.7%+ 2600.0%462740.4%+ 9033.3%6928042Hyundai i20520.6%– 58.4%271,4181.9%+ 16.2%111643SsangYong Korando520.6%– 25.7%445310.7%– 0.6%383744VW Touareg490.6%– 10.9%504130.5%+ 38.1%535645Hyundai Kona480.6%+ 4.3%554670.6%– 26.9%443446Jeep Avenger480.6%– 2.0%615700.8%+ 277.5%369047BMW X3460.6%+ 187.5%803010.4%+ 63.6%659348Kia Xceed460.6%– 23.3%514650.6%– 32.1%453149Mercedes GLE460.6%+ 76.9%543680.5%– 13.6%564850Mercedes GLC430.5%+ 10.3%384640.6%+ 14.9%464751VW Multivan410.5%+ 95.2%725240.7%+ 129.8%397152Mercedes GLS400.5%+ 48.1%572440.3%– 12.5%766953Nissan Qashqai400.5%– 69.9%316960.9%– 28.9%271854BMW X5390.5%+ 39.3%672590.3%– 12.5%736655Ford Transit/Tourneo Custom390.5%+ 18.2%696000.8%+ 129.0%346856Cupra Formentor380.5%+ 153.3%1292040.3%+ 3.6%928957Peugeot 2008380.5%– 67.8%564780.6%– 27.0%433558Citroen C5 Aircross370.5%+ 362.5%632230.3%+ 162.4%8613059Fiat 600370.5%+ 54.2%1251470.2%+ 276.9%11517560Ford Transit/Tourneo Connect370.5%+ 27.6%1141510.2%+ 6.3%11310661Renault Trafic360.4%+ 80.0%483400.4%– 32.1%573862Skoda Enyaq360.4%+ 1100.0%1102120.3%+ 116.3%8913563Mazda CX-30350.4%– 16.7%1371710.2%– 24.0%1097664Cupra Terramar330.4%+ 3200.0%662430.3%+ 24200.0%7823165Ford Courier330.4%– 2.9%772030.3%+ 19.4%939466Audi A6320.4%+ 166.7%1191740.2%+ 37.0%10811967Volvo XC40320.4%+ 14.3%1171780.2%+ 18.7%1059868Audi A3310.4%+ 0.0%842630.3%+ 83.9%7111069VW Passat310.4%+ 6.9%933040.4%+ 67.0%648870VW Touran310.4%– 74.2%644380.6%+ 18.1%504671Mercedes G Class280.3%+ 3.7%1672380.3%+ 18.4%818572Peugeot 3008280.3%– 67.4%335490.7%+ 44.9%374573Volvo XC60280.3%+ 27.3%892410.3%+ 11.1%797774Citroen C3 Aircross270.3%– 6.9%582020.3%+ 77.2%9412475Peugeot 5008270.3%+ 17.4%681150.2%– 17.3%12911876Seat Leon270.3%– 20.6%1032910.4%+ 11.1%676377Audi Q5260.3%– 27.8%372930.4%+ 70.3%669278Kia Sorento260.3%– 55.2%1023070.4%– 0.3%625879Renault Austral260.3%+ 44.4%651950.3%– 14.1%987580VW Caddy260.3%– 18.8%942270.3%– 23.6%846181Opel Mokka250.3%+ 0.0%751880.2%+ 23.7%10210882BMW 5 Series240.3%+ 71.4%1002140.3%+ 2.4%887883Hyundai Bayon240.3%– 25.0%302870.4%– 28.3%685084Renault Captur240.3%– 63.6%784430.6%+ 7.8%494485Audi A5230.3%+ 283.3%1241800.2%+ 210.3%10317186Lexus NX230.3%– 56.6%1662390.3%– 37.4%805287Peugeot Rifter230.3%n/a96980.1%n/a137 –88Toyota Land Cruiser230.3%+ 91.7%1131210.2%+ 95.2%12710989Land Rover Defender220.3%– 18.5%981770.2%+ 2.3%10610090BMW X6210.3%+ 75.0%160950.1%– 9.5%14114191Honda HR-V210.3%+ 133.3%871930.3%+ 25.3%10010592Kia Proceed 210.3%– 19.2%413950.5%+ 9.1%545593SsangYong Torres210.3%+ 5.0%1181510.2%+ 19.8%11411694Suzuki Swift210.3%– 27.6%1211990.3%+ 21.3%959595BYD Sealion 7200.2%new101840.1%new150 –96Renault Symbioz200.2%new901210.2%new126 –97Audi Q8190.2%– 52.5%863060.4%+ 66.3%638798Ford Puma190.2%– 53.7%473370.4%+ 4.0%585799MG HS190.2%– 72.9%792610.3%– 2.6%7267100Opel Corsa190.2%– 24.0%1483280.4%– 15.5%5951101BMW X1180.2%+ 12.5%1272320.3%+ 16.0%8386102Hyundai Santa Fe180.2%– 58.1%832040.3%+ 46.8%91103103Volvo XC90180.2%– 5.3%1571890.2%– 6.4%10183104Opel Grandland170.2%+ 54.5%733100.4%+ 362.7%61147105VW ID.7170.2%+ 183.3%1041750.2%+ 75.0%107142106Honda ZR-V160.2%– 33.3%135980.1%– 12.5%138123107Lexus ES160.2%+ 45.5%106940.1%– 6.9%142139108Lexus LBX160.2%+ 77.8%1761290.2%+ 84.3%124156109Mercedes GLA160.2%+ 100.0%741460.2%+ 15.9%116111110Seat Ateca 160.2%– 59.0%1151950.3%– 13.3%9973111Audi Q7150.2%– 59.5%991970.3%+ 45.9%96102112BMW X7150.2%– 37.5%1111640.2%– 28.4%11281113Mazda3150.2%+ 15.4%226930.1%– 7.0%147134114Mercedes V Class150.2%– 55.9%622660.4%+ 10.8%7062115Peugeot 508150.2%– 67.4%592320.3%– 13.1%8259116Seat Arona150.2%+ 7.1%1081690.2%– 28.7%11070117Toyota Aygo X150.2%– 78.6%1223760.5%– 1.8%5549118Citroen Spacetourer140.2%– 26.3%881460.2%+ 128.1%117155119Mazda CX-80140.2%+ 600.0%1621290.2%+ 3125.0%123222120Porsche Cayenne140.2%+ 0.0%851280.2%+ 21.9%125138121Dacia Spring130.2%+ 550.0%185750.1%+ 33.9%159172122Opel Astra130.2%– 38.1%822060.3%+ 16.4%9099123Kia EV3120.1%new143940.1%new143284124Mercedes E Class120.1%+ 100.0%1581120.1%– 11.8%131117125Renault 5120.1%new131610.1%new175 –126Renault Arkana120.1%– 45.5%1461110.1%– 32.3%132101127Subaru Crosstrek120.1%+ 300.0%170640.1%+ 23.1%172144128Toyota Proace City Verso120.1%+ 500.0%712150.3%– 61.2%8743129BMW 3 Series110.1%– 31.3%1501320.2%+ 3.1%121114130Dongfeng Box S31110.1%new –420.1%new197315131Honda CR-V110.1%– 57.7%1362440.3%+ 21.4%7780132MG 3110.1%– 26.7%1161320.2%+ 149.1%120179133Nissan X-Trail110.1%– 76.6%602530.3%– 5.2%7465134Opel Vivaro110.1%+ 175.0%140930.1%+ 365.0%146221135Peugeot Traveller110.1%+ 175.0%1071450.2%+ 195.9%118185136Ssangyong Rexton110.1%– 35.3%1231080.1%– 0.9%134122137Volvo V60110.1%n/a217190.0%– 5.0%238242138Mazda CX-60100.1%– 44.4%1511040.1%– 54.2%13582139Renault Clio100.1%– 16.7%522450.3%– 13.1%7553140Renault Rafale100.1%– 41.2%1721400.2%+ 288.9%119166141Skoda Enyaq Coupe100.1%+ 0.0%1281690.2%+ 52.3%111128142Toyota Proace100.1%– 88.8%1654640.6%– 19.4%4732143Audi Q690.1%+ 200.0%141580.1%+ 241.2%176247144Fiat Doblo90.1%– 18.2%155810.1%+ 575.0%153234145Leapmotor C1090.1%new144240.0%new224 –146Subaru Outback90.1%– 43.8%1911180.2%– 53.7%12874147Audi Q280.1%+ 100.0%214410.1%– 21.2%200183148BMW 7 Series80.1%+ 33.3%161700.1%– 16.7%167153149BMW X480.1%– 33.3%171410.1%– 51.2%199152150Ford Explorer80.1%+ 33.3%120510.1%+ 64.5%182214151Lexus UX80.1%– 11.1%177640.1%– 22.9%173149152Mercedes GLB80.1%– 38.5%951310.2%– 2.2%122115153Peugeot 30880.1%– 68.0%1341960.3%– 45.9%9754154Range Rover Sport80.1%+ 60.0%1321140.2%+ 11.8%130136155Ssangyong Tivoli80.1%– 33.3%168720.1%– 54.7%165104156BMW 2 Series70.1%– 61.1%139650.1%– 25.3%169151157Ford Focus Combi70.1%– 41.7%97780.1%– 34.5%156127158Honda Jazz70.1%+ 600.0%142740.1%+ 164.3%161219159Lexus RX70.1%– 66.7%1381100.1%– 45.5%13384160Mazda670.1%+ 0.0%178170.0%– 79.3%242158161Mercedes CLA70.1%+ 75.0%109730.1%– 9.9%163159162Mercedes S Class70.1%– 46.2%154450.1%– 41.6%191148163Porsche 91170.1%n/a234680.1%+ 47.8%168196164Range Rover70.1%+ 40.0%224540.1%– 26.0%179161165Renault Kangoo70.1%+ 40.0%209750.1%– 25.7%160129166Volvo EX9070.1%new222230.0%new229 –167Audi A160.1%+ 200.0%190250.0%– 39.0%223202168Audi Q460.1%+ 200.0% –210.0%– 41.7%234205169Ford Capri60.1%new133560.1%new177329170Honda Civic60.1%+ 0.0%153560.1%+ 30.2%178193171Kia EV460.1%new145150.0%new246 –172Mini 60.1%– 14.3%147940.1%+ 30.6%144163173Range Rover Velar60.1%+ 500.0%201480.1%+ 128.6%186226174SsangYong Actyon60.1%new206190.0%new237 –175VW ID.460.1%– 62.5%188770.1%– 31.3%157132176BMW 2 Series Active/Gran Tourer50.1%+ 25.0%76710.1%+ 6.0%166173177BMW IX50.1%+ 400.0%227390.1%+ 0.0%202198178BMW iX150.1%+ 400.0%164250.0%– 21.9%222215179BMW X250.1%+ 0.0%189800.1%+ 19.4%155165180BMW XM50.1%+ 66.7%193240.0%– 22.6%225212181BYD Seal 550.1%new –50.0%new288 –182Cupra Leon50.1%– 28.6%1301030.1%– 4.6%136131183Kia EV650.1%– 37.5%211730.1%– 42.5%164121184Kia Picanto50.1%– 68.8%105840.1%– 7.7%151140185Mazda250.1%+ 150.0%225460.1%– 14.8%188180186Mercedes AMG GT50.1%+ 400.0%220180.0%– 45.5%239208187Mercedes C Class50.1%+ 0.0%169810.1%+ 26.6%154170188Mercedes T-class50.1%n/a –150.0%+ 150.0%248285189Suzuki Across50.1%+ 400.0%202330.0%+ 200.0%208248190Volvo EX3050.1%– 16.7%152490.1%– 35.5%185162191VW ID.350.1%+ 25.0%163640.1%– 8.6%171167192Xpeng G950.1%new207110.0%new257 –193BMW 4 Series40.0%– 78.9%911780.2%– 4.8%10497194DS 740.0%+ 0.0%208500.1%+ 13.6%184194195Hyundai Inster40.0%new156640.1%new170 –196Hyundai Ioniq940.0%new18690.0%new271 –197Jeep Compass40.0%– 75.0%194450.1%– 61.5%192133198Mercedes A Class40.0%+ 100.0%81870.1%+ 7.4%148146199Mercedes EQB40.0%– 20.0%213230.0%– 30.3%228213200MG 440.0%– 33.3% –330.0%– 34.0%210188201Porsche Panamera40.0%– 33.3%230330.0%+ 120.0%209243202Subaru Forester40.0%+ 300.0%212870.1%+ 107.1%149195203BMW iX230.0%n/a –80.0%+ 300.0%278317204DS 430.0%+ 0.0% –40.0%– 66.7%294262205Ford Mustang Mach-E30.0%+ 200.0%235270.0%+ 42.1%219233206Hyundai i1030.0%– 88.9%922240.3%– 5.1%8579207Hyundai Staria30.0%n/a203370.0%– 2.6%203203208Kia Niro30.0%– 83.3%223740.1%– 49.3%162113209Land Rover Discovery Sport30.0%– 25.0%180330.0%+ 26.9%207224210Leapmotor B1030.0%new –30.0%new309 –211Mercedes Citan30.0%+ 0.0%216450.1%– 34.8%193154212Mercedes EQA30.0%+ 200.0%221210.0%– 25.0%232218213Mercedes Vito30.0%+ 200.0%149760.1%+ 40.7%158177214Mitsubishi ASX30.0%– 50.0%70810.1%+ 42.1%152174215Mitsubishi Outlander30.0%n/a242210.0%n/a233 –216Nissan Juke30.0%– 66.7%200440.1%– 51.6%195137217Opel Combo30.0%– 50.0%198970.1%+ 120.5%139168218Porsche Macan30.0%– 72.7%159420.1%– 46.2%196160219Renault Espace30.0%+ 0.0%192290.0%+ 3.6%213209220Alfa Romeo Giulia20.0%+ 100.0%231180.0%+ 38.5%240259221BMW 1 Series20.0%– 71.4% –460.1%+ 24.3%189184222DR 5.020.0%new21980.0%new275 –223Hyundai Ioniq 520.0%– 60.0% –340.0%– 33.3%206187224Kia EV920.0%– 66.7%229310.0%– 48.3%212178225Leapmotor T0320.0%new204100.0%new264 –226Mercedes B Class20.0%+ 0.0%215120.0%– 25.0%252241227Mercedes EQE20.0%+ 0.0%182220.0%– 69.9%230169228Mercedes Sprinter20.0%+ 100.0%241240.0%+ 26.3%226232229MG S520.0%new175150.0%new247 –230Range Rover Evoque20.0%– 60.0% –420.1%+ 27.3%198204231Toyota BZ4X20.0%+ 0.0% –620.1%+ 129.6%174210232Toyota Prius20.0%n/a –120.0%n/a256 –233VW Caravelle20.0%n/a126280.0%n/a215 –234VW ID.520.0%+ 100.0%210310.0%– 36.7%211190235VW Polo20.0%– 66.7%228280.0%– 67.8%217150236Alfa Romeo Stelvio10.0%– 50.0%199280.0%– 30.0%216201237Audi A810.0%+ 0.0%23380.0%– 27.3%276246238BMW i410.0%– 83.3%195520.1%– 14.8%180176239BMW i710.0%– 50.0% –70.0%– 36.4%284268240BYD Seal 6 DM-I Touring10.0%new –10.0%new321 –241Cupra Ateca10.0%n/a17370.0%– 76.7%282223242FAW Hongqi EHS710.0%new24030.0%new301 –243Fiat 500X10.0%– 88.9% –70.0%– 84.8%285189244Ford Focus10.0%– 66.7% –110.0%– 45.0%261225245Hyundai Ioniq 6 10.0%– 50.0% –290.0%– 14.7%214216246Jeep Grand Cherokee10.0%n/a –90.0%+ 28.6%272278247Jeep Wrangler10.0%n/a236220.0%+ 100.0%231263248Land Rover Discovery10.0%– 80.0%179440.1%+ 10.0%194186249MAN TGE10.0%n/a205190.0%+ 171.4%236283250Mercedes CLE10.0%– 83.3%174400.1%– 16.7%201191251MG Cyberster10.0%+ 0.0% –80.0%+ 700.0%280316252Nissan Townstar10.0%– 50.0% –100.0%– 61.5%268211253Peugeot 20710.0%n/a –10.0%n/a334 –254Renault 410.0%new24370.0%new283 –255Renault Megane E-Tech10.0%– 83.3% –30.0%– 90.0%306207256Renault Scenic E-Tech10.0%new24480.0%new277 –257Voyah Free10.0%n/a –200.0%+ 566.7%235305258VW ID.BUZZ10.0%+ 0.0% –160.0%+ 0.0%245249259Xpeng P710.0%new –30.0%new308 –
Source: ZAP

More Stories
Denmark March 2026: Skoda best-selling carmaker for the first time
The Skoda Elroq is the favourite model of Danish car buyers in March. New car sales in Denmark jump 26.6%...
Powerful Reasons Mercedes-AMG’s Latest GT Project Matters More Than You Think
From its base in Affalterbach, Mercedes-AMG has, recently, lifted the lid on a striking new direction for its GT line-up....
Top 5 Brands for Tailor-Made Car Accessories
Your vehicle deserves accessories that match your unique style and specific needs. While mass-produced car accessories serve basic functions, tailor-made...
How Car Finance Protects Your Buying Power in 2026
For many UK buyers, financing a vehicle isn’t just a way to “afford” a better car. It can be a deliberate choice to keep cash...
Hyundai Venus and Earth Concepts Signal a Bold New Ioniq Future for China
Hyundai has never been shy about taking a design risk, but the new Venus and Earth concepts feel like a...
A Chance To Win Tickets To The Wonderful Concours des Légendes 2026
We are delighted to offer you, our readers, another exciting competition. Are you signed up to our newsletter here, and...