
New Zealand October 2025: RAV4, Yaris Cross, Corolla push Toyota to highest in almost 6 years
The Toyota Yaris Cross ranks #5 in New Zealand in October.
New vehicle sales in New Zealand are up 13.3% year-on-year in October to 14,240, leading to a year-to-date tally up 8.1% to 115,035. Toyota (+32%) surges ahead to 29.9% share vs. 24% year-to-date. This is the Japanese carmaker’s highest NZ share since December 2019 (30.5%). Ford (+8.8%) is more discreet but is back to #2 ahead of Mitsubishi (-2.1%). Kia (-35.1%) struggles at #4 while Hyundai (+73.8%) closes out the Top 5 in spectacular fashion. GWM (+24.6%), MG (+20.8%) and Mazda (+15.7%) also beat the market in the remainder of the Top 10.
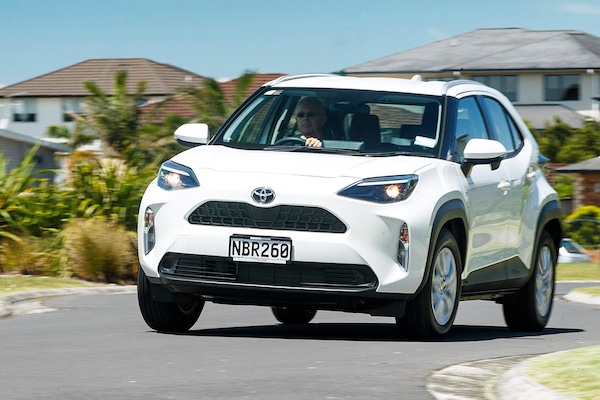
Over in the models charts, the Toyota RAV4 (+20.8%) threepeats at #1, hitting its highest share since November 2024 at 11.5% (vs. 12%). The RAV4 easily dominates the YTD charts with 7.9% share. The Ford Ranger (+14.2%) is stuck at #2 while the Toyota Hilux (+16.4%) is back up to #3, a ranking it also holds YTD. The Mitsubishi Outlander (+37.5%) shines at #4 with 4.1% share and the Toyota Yaris Cross (+206.7%) triples its sales year-on-year to hit #5, its 2nd highest ever ranking below the #4 of September 2024. The Toyota Corolla (+81.3%) and Ford Everest (+75.7%) also impress below.
Previous month: New Zealand September 2025: Mitsubishi (+51.6%) at highest in over three years, sales up 19.1%
One year ago: New Zealand October 2024: Toyota RAV4 repeats at #1 with 10.8% share, 81% rentals
Full October 2025 Top 25 brands and Top 25 models below.
New Zealand October 2025 – brands:
PosBrandOct-25%/24Sep2025%/24PosFY241Toyota4,25229.9%+ 32.0%127,59524.0%+ 16.1%112Ford 1,62911.4%+ 8.8%312,70411.0%– 11.7%223Mitsubishi1,3959.8%– 2.1%211,79710.3%– 1.4%334Kia8435.9%– 35.1%47,8556.8%+ 1.2%445Hyundai6314.4%+ 73.8%63,5243.1%+ 0.4%876Mazda5674.0%+ 15.7%53,9843.5%+ 21.7%787MG3782.7%+ 20.8%83,5053.0%+ 38.8%9118Honda3542.5%+ 11.3%102,9692.6%+ 18.7%12109Suzuki3512.5%– 12.5%74,0863.6%– 9.6%6510GWM2842.0%+ 24.6%93,0972.7%+ 20.7%111211Nissan2621.8%– 31.1%144,1993.7%+ 7.1%5612Chery2591.8%new137130.6%new269313Mercedes2531.8%– 13.9%151,9421.7%– 4.1%141414BYD2191.5%+ 112.6%173,1172.7%+ 333.5%102215Volkswagen1941.4%– 36.0%111,9341.7%– 31.5%15916Subaru1861.3%+ 17.7%191,9671.7%+ 25.4%131517LDV1381.0%+ 206.7%211,1651.0%+ 84.9%202618BMW1340.9%+ 19.6%181,5441.3%+ 23.5%161619Isuzu1330.9%– 26.5%161,5361.3%– 31.8%171320Audi1270.9%+ 23.3%201,1191.0%+ 18.2%212021Fiat1040.7%+ 62.5%284470.4%– 15.5%312522Lexus1030.7%– 16.3%221,2571.1%+ 18.0%181723Jaecoo1030.7%+ 68.9%268030.7%+ 405.0%254224Mini950.7%– 5.9%238330.7%+ 16.5%232325Land Rover920.6%+ 187.5%249620.8%+ 5.5%2221
New Zealand October 2025 – models:
PosModelOct-25%/24Sep2025%/24PosFY241Toyota RAV41,63611.5%+ 20.8%19,1387.9%+ 19.2%122Ford Ranger 8365.9%+ 14.2%27,8646.8%– 16.9%213Toyota Hilux7595.3%+ 16.4%57,2346.3%+ 14.5%334Mitsubishi Outlander5904.1%+ 37.5%33,6533.2%+ 23.7%565Toyota Yaris Cross5523.9%+ 206.7%12n/an/an/an/a136Ford Everest5063.6%+ 75.7%72,5822.2%+ 45.1%8107Mitsubishi ASX4293.0%– 20.1%44,0773.5%+ 27.7%458Toyota Corolla3192.2%+ 81.3%61,5991.4%+ 22.6%13129Hyundai Tucson2802.0%n/a111,3541.2%n/a17n/a10Mitsubishi Triton2441.7%– 2.8%82,7902.4%– 26.5%7411Toyota Hiace2241.6%+ 72.3%101,7501.5%+ 13.6%101512Kia Seltos2091.5%– 61.6%92,9372.6%+ 0.7%6713Hyundai Santa Fe2011.4%n/an/an/an/an/an/an/a14Kia Sportage1961.4%– 34.4%15n/an/an/an/a1415GWM Haval H61841.3%n/a161,4771.3%n/a15n/a16Toyota Yaris1811.3%n/a19n/an/an/an/an/a17MG ZS1741.2%+ 41.5%131,7031.5%+ 33.5%111818Chery Tiggo 4 Pro1671.2%new17n/an/anewn/a –19Toyota Corolla Cross1651.2%– 23.3%n/a1,2501.1%+ 5.8%192120Toyota Prado1431.0%– 24.3%201,4291.2%n/a16n/a21Suzuki Swift1401.0%– 31.4%n/a1,5761.4%– 32.4%14822Mazda CX-51381.0%– 44.6%n/a1,3121.1%– 7.3%181623Honda ZR-V1361.0%n/an/an/an/an/an/an/a24Mazda31280.9%n/an/an/an/an/an/an/a25Ford Transit1240.9%+ 40.9%n/a1,0790.9%– 14.8%2019n/aBYD Shark 61110.8%newn/a1,6151.4%new12 –n/aMercedes Sprinter1070.8%– 47.0%n/an/an/an/an/an/an/aFiat Ducato1020.7%+ 85.5%n/an/an/an/an/an/an/aNissan Navara960.7%– 34.7%n/a2,1571.9%+ 26.7%911n/aLDV Deliver 9790.6%n/an/an/an/an/an/an/a
Source: Auto Talk


More Stories
How AI and Human-Level Lead Nurturing Are Transforming Automotive Advertising — Insights From Thought Leader Chelsea Rizzo of Abundant Auto & AiMom
For decades, automotive advertising has followed the same formula:big budgets, big promotions, big blasts of impressions — all pushed into...
What Drivers Should Know: Legal Steps After a Serious Crash
Car people love being on the road. Whether you drive a daily hatchback, a tuned track toy, or a dream...
To Accessorise or Not? Your Ultimate Guide to Enhancing Your Suzuki
Looking to personalise your Suzuki? Our visual guide covers everything you need to know about car accessories, from functional to...
Ultimate Guide to Buying New Cars with Smart Budget Planning
Buying a brand new car is a big milestone and a major money choice. The shine of a fresh vehicle...
USA November 2025: Toyota (+4.4%), Kia (+2.7%) islands of growth, sales down -6.3%
Toyota Crown sales are up 85.2% year-on-year in November. The end of EV subsidies and tariff-induced higher prices are finally...
Canada November 2025: Toyota (+10.1%) defies market off -8.6%
The new 4 Runner plays a part in significantly lifting Toyota sales in November. DesRosiers Automotive has the Canadian new...