
Portugal October 2025: BYD (+71.2%), Citroen (+63.1%) highlight solid market
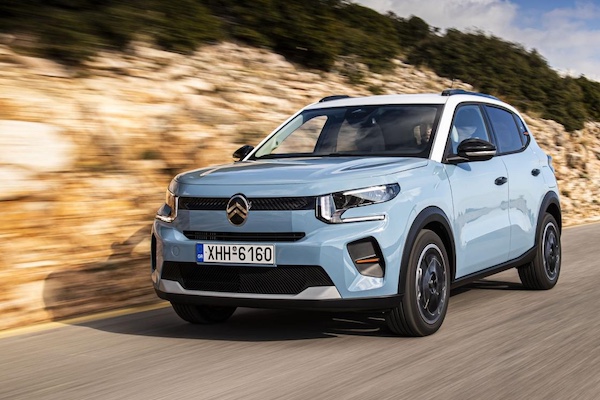
Citroen C3 sales are up 41.8% YoY in October.
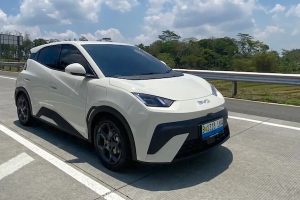
It’s another solid month for new car sales in Portugal with October volumes up 5.5% year-on-year to 16,137. This way the year-to-date tally is now up 8.4% to 187,701. Peugeot (-19%) retains the brands lead with a round 10% share but enduring a drastic fall on particularly strong year-ago results. Mercedes (+14.5%), Renault (+22%) and Dacia (+27.7%) all frankly outrun the market below, whereas BMW (+0.4%), Volkswagen (+0.1%) and Volvo (+4.9%) are more shy. Note the latter is back up 9 spots on September to #7 vs. #15 so far this year. Citroen (+63.1%) and BYD (+71.2%) surge as the Chinese carmaker signs a second Top 10 finish in the past 3 months. Tesla is down -58.7% to #24.
Model-wise, the Renault Clio (+21.4%) takes the lead for the first time since last March and cements its 2nd place year-to-date. The Dacia Sandero (+15.3%) and Duster (+66.4%) are both in outstanding shape and complete the podium. In contrast the Peugeot 2008 (-30.5%) and 208 (-46.7%) both struggle but the 208 retains its YTD top spot. The Peugeot 3008 (+52.6%), Citroen C3 (+41.8%), Mercedes A Class (+36.2%) and Renault Captur (+26.1%) also shine in the remainder of the Top 10. Just as the Renault 5 (+1047.1%) repeats at a record #16 the Opel Frontera shoots up 71 ranks on September to reach #17, by far the best-selling recent launch in the market above the Fiat Grande Panda (#30).
Previous month: Portugal September 2025: Tesla manages first 1-2 with Model 3 and Model Y in the lead
One year ago: Portugal October 2024: Peugeot (+59.4%) places 208 and 2008 on top
Full October 2025 Top 55 All brands and Top 309 All models below.
Portugal October 2025 – brands:
PosBrandOct-25%/24Sep2025%/24PosFY241Peugeot1,60810.0%– 19.0%118,95310.1%+ 6.2%112Mercedes1,3888.6%+ 14.5%215,0268.0%+ 9.2%223Renault1,3498.4%+ 22.0%613,5717.2%+ 8.4%444Dacia1,3288.2%+ 27.7%314,5507.8%+ 11.5%335BMW1,2207.6%+ 0.4%512,1926.5%+ 8.0%556Volkswagen9966.2%+ 0.1%710,9735.8%+ 15.7%667Volvo5793.6%+ 4.9%165,0432.7%– 14.5%15148Toyota5613.5%– 43.4%89,6075.1%+ 0.6%779Citroen5613.5%+ 63.1%108,4104.5%– 1.4%8910BYD5363.3%+ 71.2%114,8052.6%+ 116.3%172011Kia5133.2%+ 2.6%126,8423.6%+ 6.6%91212Opel5103.2%+ 37.1%186,2283.3%+ 17.8%111513Nissan4702.9%+ 5.4%96,7393.6%+ 13.1%101114Ford4642.9%+ 9.4%174,8142.6%+ 14.1%161615Hyundai4522.8%– 21.8%145,2312.8%– 11.5%141316Skoda4062.5%+ 41.5%194,5202.4%+ 37.1%181917Audi3942.4%+ 26.7%154,0602.2%+ 5.9%201718Seat3702.3%– 33.0%135,8113.1%– 10.4%131019Cupra3292.0%+ 99.4%222,0941.1%+ 21.2%242320MG3111.9%+ 69.9%203,3721.8%+ 75.2%212221Fiat2901.8%+ 88.3%214,1582.2%+ 0.3%191822Mini2111.3%+ 15.9%241,8661.0%+ 31.1%252423Jeep1821.1%+ 52.9%232,2381.2%+ 40.5%232524Tesla1440.9%– 58.7%45,9533.2%– 21.4%12825Mitsubishi1200.7%– 29.4%252,6011.4%– 7.3%222126Xpeng 920.6%+ 607.7%267390.4%+ 2979.2%283827Mazda900.6%+ 50.0%345340.3%– 7.6%333028Leapmotor890.6%new372070.1%new37 –29Porsche740.5%– 64.1%271,2930.7%+ 13.7%262630Land Rover730.5%+ 10.6%288850.5%+ 11.0%272831Smart640.4%– 8.6%334940.3%– 3.3%343232DS560.3%– 41.7%356750.4%– 23.5%292733Honda550.3%+ 19.6%305900.3%– 6.9%312934Alfa Romeo450.3%+ 21.6%325930.3%+ 36.6%303335Lexus440.3%– 21.4%315560.3%+ 6.3%323136Polestar240.1%+ 14.3%294440.2%+ 119.8%353437KGM/Ssangyong220.1%– 18.5%362890.2%+ 325.0%363638Aion180.1%new42290.0%new46 –39Dongfeng140.1%new411190.1%new394641Suzuki120.1%– 45.5%391350.1%– 49.8%383540Voyah100.1%+ 900.0%49220.0%+ 633.3%504942Forthing80.0%+ 300.0%40910.0%+ 1200.0%414843Deepal80.0%new38280.0%new47 –44Bentley70.0%+ 133.3%47410.0%+ 41.4%424145Aston Martin60.0%– 33.3%44510.0%+ 6.3%403946Man50.0%+ 400.0%51280.0%+ 180.0%484447Seres50.0%new5280.0%new53 –48Alpine40.0%n/a43380.0%+ 850.0%434549Ferrari40.0%+ 33.3%45340.0%+ 25.9%444350Moke International40.0%new –40.0%new57 –51Maserati30.0%+ 50.0%46330.0%+ 32.0%454052Abarth30.0%n/a –170.0%n/a515453Lamborghini20.0%+ 0.0%48260.0%– 7.1%494254Jaecoo20.0%new –20.0%new60 –55Omoda20.0%new –20.0%new61 –
Portugal October 2025 – models:
PosModelOct-25%/24Sep2025%/24PosFY241Renault Clio5623.5%+ 21.4%56,0493.2%+ 10.8%242Dacia Sandero4833.0%+ 15.3%35,6343.0%– 14.3%313Dacia Duster4712.9%+ 66.4%75,0072.7%+ 63.3%494Peugeot 20084032.5%– 30.5%46,6743.6%+ 9.3%125Peugeot 2083692.3%– 46.7%114,4092.3%– 13.3%656Mercedes A-Class3502.2%+ 36.2%93,2321.7%+ 9.2%10117Peugeot 3083292.0%– 13.2%63,5841.9%– 0.2%878Peugeot 30082931.8%+ 52.6%152,3541.3%+ 80.0%18339Renault Captur2901.8%+ 26.1%173,6271.9%– 1.8%7610Citroen C32681.7%+ 41.8%124,9772.7%+ 29.2%5811Ford Puma2221.4%+ 8.8%132,3051.2%+ 33.5%192712Toyota Yaris Cross2201.4%– 2.2%103,1161.7%+ 11.8%121313BMW X12001.2%– 5.2%142,1001.1%+ 25.3%202514VW T-Roc2001.2%– 13.8%352,0151.1%+ 2.0%222115Volvo EX301961.2%+ 1.0%391,4850.8%– 28.7%341916Renault 51951.2%+ 1047.1%161,3850.7%+ 7594.4%3620517Opel Frontera1921.2%new888860.5%new68 –18Seat Leon1891.2%– 35.1%231,7540.9%+ 10.9%282319Mercedes CLA1871.2%+ 146.1%501,1360.6%+ 30.9%506220Nissan Ariya1831.1%+ 454.5%1624480.2%+ 98.2%10513321Cupra Formentor1731.1%+ 68.0%588770.5%+ 12.7%696022Peugeot 50081731.1%+ 158.2%451,3270.7%+ 124.2%378523Volvo XC601691.0%+ 65.7%441,1000.6%+ 0.6%514424Opel Corsa1581.0%– 25.8%192,8951.5%+ 10.2%131525Dacia Jogger1551.0%– 37.8%292,0961.1%– 29.2%211226BMW 5 Series1541.0%– 6.1%301,3080.7%+ 32.7%395027Citroen C3 Aircross1490.9%n/a201,4810.8%+ 8.5%354328Nissan Juke1490.9%– 11.3%213,1471.7%+ 5.5%111029Jeep Avenger1450.9%+ 116.4%251,9091.0%+ 59.2%234630Fiat Grande Panda1420.9%new406400.3%new83 –31Hyundai i201420.9%– 27.2%321,7700.9%– 8.2%262032Kia Stonic1350.8%– 2.2%262,5571.4%+ 17.5%151833Dacia Spring1290.8%+ 239.5%221,0000.5%+ 261.0%579634Nissan Qashqai1290.8%– 36.8%82,7601.5%+ 13.2%141735MG HS1260.8%+ 193.0%279440.5%+ 2045.5%6316836Tesla Model Y1250.8%– 36.2%22,3891.3%+ 3.7%171637VW Tiguan1240.8%+ 33.3%341,2920.7%+ 249.2%409938Mercedes GLA1230.8%– 6.8%181,6100.9%+ 37.0%303939BMW i41210.7%+ 34.4%469540.5%– 10.9%614840BMW 1 Series1130.7%+ 39.5%711,5760.8%– 7.2%313041BMW X31130.7%+ 606.3%536860.4%+ 75.4%8010942VW T-Cross1110.7%– 27.0%361,7240.9%+ 9.8%292843BYD Sealion 71040.6%new427360.4%new7433444Mercedes GLC1040.6%+ 92.6%311,0040.5%+ 46.6%567345MG S5 EV1040.6%new693390.2%new128 –46Toyota Yaris1040.6%– 56.3%591,8371.0%– 6.1%252247BMW iX11020.6%– 11.3%689780.5%+ 11.1%585948VW Caddy1010.6%+ 188.6%855660.3%+ 207.6%8914749BMW 3 Series1000.6%– 9.1%381,1630.6%+ 13.0%485150Skoda Kodiaq960.6%+ 152.6%478100.4%+ 112.0%729751Mercedes E-Class940.6%– 24.2%651,2470.7%– 13.4%413252Cupra Terramar900.6%+ 8900.0%615050.3%#######9628053Kia EV3900.6%+ 200.0%499570.5%+ 3090.0%6015954Seat Ibiza900.6%– 19.6%242,4951.3%– 8.6%161455BYD Seal U890.6%+ 8.5%481,0260.5%+ 238.6%5310056BYD Atto 3880.5%+ 33.3%561,0190.5%+ 32.5%545757Audi A3870.5%+ 11.5%411,3190.7%+ 18.7%384558Audi A5870.5%+ 1640.0%724690.2%+ 1517.2%10224359Mercedes GLC Coupe870.5%+ 19.2%439330.5%+ 42.2%657660VW Taigo860.5%– 49.4%541,7620.9%+ 15.5%272661Fiat 600850.5%+ 7.6%281,8621.0%+ 359.8%248362Seat Arona850.5%– 39.7%371,5310.8%– 13.8%322463Mini840.5%– 12.5%867040.4%– 8.3%776464Mercedes C-Class800.5%– 10.1%641,1650.6%– 16.2%473465BYD Atto 2750.5%new574990.3%new98 –66Kia Xceed750.5%– 14.8%941,0350.6%+ 10.7%525867Hyundai Kauai740.5%– 8.6%339510.5%– 14.9%624768Toyota C-HR740.5%– 58.4%521,2100.6%+ 0.7%453669BMW iX2730.5%– 36.5%628310.4%+ 85.5%719170Mercedes EQA730.5%– 8.8%518980.5%+ 3.5%675471Skoda Kamiq730.5%+ 92.1%771,2260.7%+ 76.7%427572Mercedes EQE720.4%– 4.0%816740.4%– 11.4%816773Mini Aceman720.4%+ 278.9%835400.3%+ 2742.1%9318374VW ID.3710.4%+ 24.6%663690.2%– 32.0%1228275Xpeng G6700.4%+ 900.0%675060.3%+ 4500.0%9524776Skoda Elroq690.4%new1122840.2%new147 –77Mazda6e660.4%new179840.0%new222 –78Audi Q6650.4%– 5.8%795470.3%+ 311.3%9216079BMW 2 Series640.4%– 28.1%706910.4%– 45.1%794280Renault Austral640.4%+ 88.2%1013800.2%– 10.6%11910681Audi A6630.4%+ 472.7%1113420.2%+ 232.0%12720482Dacia Bigster630.4%new754980.3%new99 –83Citroen C5 Aircross620.4%+ 785.7%2472030.1%– 56.3%16910484Volvo XC40620.4%– 55.7%1141,1620.6%– 23.2%493185Skoda Superb610.4%+ 306.7%1063460.2%+ 90.1%12616586Opel Astra600.4%– 26.8%848440.4%– 21.8%705287VW Golf600.4%– 17.8%805770.3%+ 4.7%888788Hyundai Tucson590.4%– 39.8%787110.4%– 29.9%764989Leapmotor C10590.4%new1661140.1%new201 –90Toyota Corolla580.4%– 48.7%609370.5%– 1.3%645391Ford Focus570.4%– 26.9%1241,0100.5%– 28.4%553592VW ID.4570.4%– 3.4%1174080.2%– 16.6%1129493BYD Dolphin560.3%– 48.6%1525020.3%+ 17.3%979294BYD Dolphin Surf550.3%new742740.1%new151 –95Mitsubishi Colt550.3%+ 41.0%1051,1770.6%+ 43.2%466596BYD Seal540.3%+ 5.9%976700.4%+ 0.6%827197Kia Sportage540.3%– 22.9%936180.3%– 30.1%856198Mini Countryman540.3%– 19.4%555560.3%– 6.7%907999BMW iX520.3%+ 92.6%1084110.2%+ 42.7%110129100BMW i5510.3%– 27.1%734970.3%+ 4.2%10089101Mitsubishi ASX510.3%– 31.1%879580.5%+ 26.4%5970102Opel Mokka510.3%– 8.9%821,2230.7%+ 20.3%4356103Volvo EX90510.3%+ 1600.0%903150.2%#######137287104VW Multivan500.3%– 20.6%1075860.3%– 6.8%8684105Hyundai i10490.3%+ 96.0%1384190.2%+ 6.6%109112106Skoda Octavia490.3%– 52.0%894280.2%– 63.9%10838107Ford Explorer480.3%+ 9.1%1282980.2%+ 192.2%142176108Ford Tourneo Courier470.3%+ 95.8%1403100.2%+ 154.1%139189109Kia EV4470.3%new267490.0%new244 –110Volvo V60460.3%– 31.3%1134320.2%– 46.2%10766111Citroen C4450.3%– 16.7%631,2150.6%– 13.5%4437112Ford Tourneo/Transit Custom440.3%+ 144.4%1563540.2%+ 207.8%125173113Renault Megane E-Tech440.3%– 18.5%1213240.2%– 32.1%13388114Hyundai Ioniq 5410.3%– 8.9%1342970.2%– 12.4%143123115Fiat Panda400.2%– 23.1%1301,4850.8%+ 6.9%3340116Hyundai Inster390.2%new1153990.2%new113 –117Kia Picanto380.2%– 30.9%1047800.4%+ 3.7%7372118DS 7370.2%– 53.8%1373630.2%– 19.5%124103119Mercedes EQB370.2%– 47.9%985080.3%+ 4.5%9486120MG4370.2%– 60.6%1296370.3%– 49.7%8441121Alfa Romeo Junior360.2%+ 89.5%924620.2%+ 1148.6%103231122Audi Q4350.2%– 30.0%1024390.2%– 29.0%10677123Porsche Macan350.2%– 69.3%954970.3%+ 51.5%101114124Renault Rafale350.2%+ 75.0%1183850.2%+ 434.7%116211125Smart #3340.2%+ 3.0%1742410.1%+ 30.3%156 –126Renault 4330.2%new1251310.1%new190 –127Renault Scenic E-Tech320.2%+ 39.1%2043240.2%+ 121.9%134167128BMW X5310.2%+ 3.3%1092540.1%+ 6.3%153144129Kia Ceed310.2%– 40.4%913360.2%– 51.7%12981130Toyota Aygo X310.2%– 53.0%967120.4%– 13.9%7563131Hyundai Bayon290.2%– 54.0%1333780.2%– 33.1%12074132Mercedes CLE290.2%+ 26.1%1393750.2%+ 46.5%121130133Renault Symbioz290.2%– 14.7%1423930.2%+ 222.1%115177134VW Passat290.2%+ 123.1%1593200.2%+ 190.9%135157135VW Tayron290.2%new1221930.1%new172 –136Honda HR-V280.2%+ 12.0%1102760.1%– 25.8%149117137MG ZS280.2%– 15.2%999310.5%+ 136.9%66111138Cupra Born270.2%+ 92.9%1451760.1%– 53.3%177115139Dacia Logan270.2%– 47.1%1363150.2%+ 83.1%136151140Mercedes B-Class260.2%+ 36.8%1722860.2%+ 42.3%145154141Opel Grandland260.2%+ 160.0%1812190.1%– 4.4%163156142Range Rover 260.2%+ 52.9%2121390.1%+ 10.3%186180143Range Rover Sport260.2%+ 85.7%1353250.2%+ 58.5%131152144Mercedes GLB250.2%– 16.7%1203830.2%– 16.0%117101145Volvo XC90250.2%+ 150.0%1432750.1%+ 96.4%150178146Cupra Tavascan240.1%+ 0.0%1893310.2%+ 727.5%130193147Skoda Fabia230.1%– 50.0%1237020.4%+ 95.5%78118148Toyota RAV4230.1%– 68.9%1035500.3%– 15.3%9180149Jeep Compass220.1%– 15.4%1272030.1%– 20.1%170128150Lexus NX220.1%– 12.0%1162400.1%– 1.6%157136151Renault Espace220.1%+ 175.0%1931300.1%+ 49.4%191208152VW ID.5220.1%+ 46.7%256870.0%– 44.6%218169153Porsche 911210.1%– 4.5%1602470.1%+ 5.1%155143154Skoda Enyaq210.1%+ 5.0%213950.1%– 41.0%213172155Volvo EX40210.1%+ 950.0%1501250.1%+ 3025.0%194321156Xpeng G9210.1%+ 425.0%1831820.1%+ 2175.0%176276157Smart #1200.1%– 45.9%1731850.1%– 42.0%175120158Fiat 500e190.1%n/a1711130.1%+ 2725.0%203n/a159KGM Torres190.1%+ 11.8%1542250.1%+ 400.0%161210160Kia EV6190.1%– 17.4%1472060.1%– 15.9%168142161Peugeot Expert Traveller190.1%+ 375.0%1631460.1%+ 247.6%184239162Renault Trafic190.1%– 82.4%1651890.1%– 54.0%17495163Tesla Model 3190.1%– 87.4%13,5501.9%– 32.0%93164Aion V180.1%new196290.0%new264 –165Toyota Corolla Cross180.1%– 40.0%1323820.2%– 6.1%118105166Audi A1170.1%+ 88.9%1263950.2%+ 30.4%114121167BMW 4 Series170.1%– 48.5%1882350.1%– 12.0%158131168Leapmotor B10170.1%new –170.0%new293 –169Lexus LBX170.1%– 29.2%1612490.1%+ 33.2%154145170Mercedes GLE170.1%+ 21.4%1312620.1%+ 15.9%152153171VW ID.Buzz170.1%+ 142.9%2321460.1%+ 143.3%185219172Audi Q3160.1%– 23.8%1511100.1%– 81.0%20590173Ford Capri160.1%+ 100.0%178970.1%+ 1112.5%211286174Citroen Spacetourer150.1%+ 200.0%144940.1%+ 123.8%214236175Cupra Leon150.1%– 34.8%1192250.1%– 57.7%16078176Dongfeng Box140.1%new1771190.1%new198310177Mitsubishi Outlander140.1%n/a1481380.1%n/a187 –178Opel Zafira Life140.1%+ 366.7%2111000.1%+ 150.0%209214179Polestar 4140.1%+ 27.3%1002910.2%+ 546.7%144199180VW Caravelle140.1%n/a1951480.1%n/a183 –181Audi Q2130.1%– 64.9%1553660.2%– 11.2%123107182BYD Seal 6130.1%new207450.0%new247 –183Ford Kuga130.1%– 40.9%1462080.1%– 25.2%166134184Leapmotor T03130.1%new210760.0%new224 –185Mazda2130.1%– 43.5%1572140.1%+ 7.5%165150186Mercedes G-Class130.1%– 50.0%1801140.1%+ 40.7%202200187Mercedes Sprinter130.1%+ 18.2%1681670.1%+ 34.7%179182188Mercedes Vito Tourer130.1%+ 8.3%2503070.2%– 1.3%141127189MG3130.1%+ 44.4%1864590.2%+ 967.4%104237190Peugeot e-Rifter130.1%+ 85.7%230770.0%– 76.8%223126191Renault Arkana130.1%– 13.3%3051690.1%– 56.2%178113192Toyota Proace Verso130.1%– 13.3%763250.2%+ 32.1%132132193DS No4120.1%new –160.0%new294 –194Mercedes V-Class120.1%– 7.7%1992230.1%– 18.6%162137195Toyota bZ4X120.1%– 40.0%1753120.2%+ 38.1%138146196Honda Jazz110.1%+ 0.0%1841340.1%+ 15.5%189191197Jeep Wrangler110.1%+ 175.0%227510.0%+ 75.9%240248198Mercedes Citan Tourer110.1%+ 120.0%1671560.1%+ 169.0%182218199VW Crafter110.1%+ 10.0%244990.1%+ 160.5%210233200Smart #5100.1%new170670.0%new230 –201Voyah Courage100.1%new308130.0%new304 –202VW ID.7100.1%– 16.7%220920.0%– 15.6%216194203Ford Transit90.1%– 25.0%1901190.1%– 50.2%199140204Hyundai Santa Fe90.1%– 52.6%2251200.1%+ 22.4%196195205Kia Niro90.1%– 64.0%1911250.1%– 73.8%193102206Alfa Romeo Tonale80.0%– 50.0%2411150.1%– 66.1%200125207BMW XM80.0%+ 14.3%217850.0%+ 88.9%219241208Deepal S0780.0%new158280.0%new266 –209Kia EV980.0%– 20.0%209840.0%– 26.3%221197210Land Rover Defender80.0%+ 60.0%2181080.1%+ 16.1%206209211Polestar 280.0%+ 0.0%1411270.1%– 12.4%192174212Renault Kangoo80.0%+ 0.0%276560.0%– 50.0%239190213Suzuki Swift80.0%– 55.6%231730.0%– 39.7%227192214Volvo EC4080.0%+ 166.7%194570.0%+ 714.3%238311215Citroen C4 X70.0%– 12.5%2082850.2%– 18.8%146119216Ford Mustang (incl. Mach E)70.0%– 12.5%234490.0%– 65.0%243185217Kia Sorento70.0%– 22.2%198950.1%+ 1.1%212201218Land Rover Discovery Sport70.0%+ 16.7%219890.0%+ 14.1%217216219Mazda MX-570.0%+ 16.7%228580.0%– 12.1%236227220Peugeot 40870.0%– 68.2%2012800.1%– 45.5%14898221Porsche Cayenne Coupe70.0%– 83.3%1643080.2%– 14.4%140116222Porsche Panamera70.0%– 56.3%2391230.1%+ 48.2%195213223Skoda Karoq70.0%– 63.2%1822190.1%+ 104.7%164141224Skoda Scala70.0%– 22.2%1874100.2%+ 81.4%111158225BMW 7 Series60.0%+ 50.0%206700.0%+ 29.6%228232226Citroen e-Berlingo60.0%n/a –390.0%+ 44.4%251277227Forthing U-tour60.0%n/a236350.0%+ 1650.0%256374228Honda Civic60.0%+ 200.0%226370.0%+ 68.2%254269229Mercedes GLE Coupe60.0%– 33.3%2031080.1%+ 1.9%207206230Range Rover Velar60.0%+ 100.0%253570.0%+ 1.8%237235231Seat Ateca60.0%+ 50.0%254280.0%– 85.5%272161232Toyota Prius60.0%– 14.3%2141110.1%– 22.9%204181233Audi Q850.0%– 83.3%246270.0%– 93.8%27493234BMW Z450.0%+ 66.7%261290.0%+ 16.0%265273235Honda ZR-V50.0%+ 25.0%223480.0%+ 23.1%245253236Hyundai i3050.0%– 88.6%2241660.1%– 50.3%180108237Hyundai Ioniq 650.0%– 37.5%265200.0%– 84.0%286196238Lexus RZ50.0%+ 25.0%185380.0%+ 72.7%253271239Man TGE50.0%+ 400.0%295280.0%+ 180.0%269301240Mercedes AMG GT50.0%+ 400.0%296390.0%+ 44.4%252263241Nissan X-Trail50.0%– 77.3%1921900.1%+ 18.0%173171242Opel Combo50.0%+ 25.0%251310.0%+ 106.7%261292243Seres 350.0%new30770.0%new332 –244Alpine A29040.0%new216300.0%new263353245Audi Q540.0%n/a176270.0%– 53.4%273234246Bentley Continental40.0%+ 33.3%285240.0%+ 84.6%282284247BMW X740.0%– 20.0%242330.0%– 2.9%258261248Citroen C5 X40.0%+ 0.0%221580.0%– 18.3%235225249DS 440.0%– 66.7%2881990.1%– 24.6%171138250Honda e:Ny140.0%n/a292310.0%+ 121.4%259264251Jeep Renegade40.0%– 81.0%153740.0%– 31.5%226188252Moke40.0%new –40.0%new349 –253Nissan Primastar40.0%n/a200590.0%n/a234 –254Opel Movano40.0%n/a302140.0%– 56.3%301256255Porsche Taycan40.0%– 60.0%304920.1%+ 33.3%215220256VW Polo40.0%+ 100.0%2455780.3%– 34.8%8768257Aston Martin DBX30.0%+ 200.0%282190.0%+ 35.7%290288258Citroen Jumper30.0%n/a262150.0%+ 1400.0%296379259DS 330.0%– 25.0% –750.0%– 54.5%225175260Maserati Grecale30.0%+ 50.0%249280.0%+ 47.4%270282261Mercedes e-Citan Tourer30.0%+ 200.0%272260.0%+ 136.4%278293262Renault Master30.0%– 25.0%306200.0%– 61.5%289224263Abarth 600e20.0%new –110.0%new310 –264Aston Martin DB12 Volante20.0%– 60.0% –110.0%+ 0.0%311303265Bentley Bentayga20.0%n/a284120.0%+ 0.0%306297266BMW i720.0%– 60.0%286260.0%– 25.7%275257267BMW X220.0%– 93.8%1972270.1%+ 8.6%159155268BMW X620.0%– 33.3%260140.0%– 50.0%298270269BYD Tang EV20.0%n/a233250.0%+ 127.3%281272270Citroen Berlingo20.0%– 33.3%202400.0%– 90.9%250110271Ferrari Roma Spider20.0%+ 100.0% –110.0%+ 120.0%313335272Fiat Doblo20.0%n/a29030.0%+ 50.0%352345273Fiat Ducato20.0%n/a –280.0%n/a267348274Jaecoo T36120.0%new –20.0%new364 –275KGM Tivoli20.0%– 50.0%248280.0%+ 133.3%268305276Lamborghini Urus20.0%n/a268200.0%+ 100.0%287308277Mazda320.0%+ 100.0% –230.0%– 4.2%285278278Mercedes EQS20.0%– 33.3%273240.0%– 67.6%284223279Mercedes GLS20.0%– 50.0%298180.0%– 57.1%291250280Mercedes S-Class20.0%– 50.0%274680.0%– 26.1%229215281MG Cyberster20.0%n/a238420.0%+ 4100.0%249302282Omoda 520.0%new –20.0%new365 –284Peugeot 50820.0%– 94.6%229850.0%– 64.4%220148285Polestar 320.0%+ 0.0%252260.0%+ 116.7%279295286Suzuki S-Cross20.0%+ 100.0%255260.0%– 10.3%280268287Suzuki Vitara20.0%+ 0.0%240350.0%– 30.0%257244288Toyota Proace City Verso20.0%– 91.3%2151010.1%– 27.3%208179289Abarth 500e10.0%new –50.0%new336 –290Alfa Romeo Giulia10.0%+ 0.0%280120.0%– 55.6%305274291Aston Martin Vantage10.0%– 66.7%25890.0%+ 12.5%319307292Audi e-Tron10.0%+ 0.0% –50.0%– 37.5%328318293Audi Q710.0%n/a259110.0%+ 83.3%312324294Bentley Flying Spur10.0%n/a –50.0%+ 25.0%338312295Ferrari Purosangue10.0%n/a –80.0%+ 166.7%327329296Ferrari SF90 Stradale10.0%n/a28940.0%+ 33.3%347338297Ford Tourneo/Transit Connect10.0%– 83.3%243500.0%– 29.6%242226298Forthing Friday10.0%new235350.0%new255 –299Forthing S50EVK10.0%+ 0.0%291140.0%+ 1300.0%299373300Honda CR-V10.0%– 75.0%264640.0%– 9.9%232221301KGM Korando10.0%– 80.0%266310.0%+ 244.4%260285302Mazda CX-310.0%n/a10.0%n/a395 –303Mazda CX-6010.0%– 50.0% –260.0%– 57.4%277228304Mercedes EQV10.0%+ 0.0%237170.0%+ 41.7%292304305Mercedes SL-Class10.0%n/a299100.0%– 37.5%317289306MG510.0%+ 0.0%30160.0%– 14.3%335322307Mini JCW10.0%n/a169660.0%n/a231327308Volvo V9010.0%– 85.7%278310.0%– 38.0%262240309Xpeng P710.0%– 50.0%205510.0%+ 920.0%241315
Source: ACAP

More Stories
How to Explore Ferrari’s Legendary Daytona Through This Definitive and Beautiful New Book
Few grand tourers carry the same weight as the Ferrari 365 GTB/4 Daytona. Revered for its striking design, formidable performance,...
Colombia February 2025: Kia Picanto repeats at #1, sales up 49.5%
The Kia Picanto is once again the most popular vehicle in Colombia. New vehicle sales in Colombia continue to surge,...
The Winner of Our Exciting Smallest Cog Goodies Bundle Competition!
Thank you for everyone that entered our Smallest Cog Goodies Bundle competition. Congratulations to our Smallest Cog Goodies Bundle competition...
Toyota’s Warning Shot Shows How Fast the Auto Industry Is Changing
Toyota is not a company that usually talks like it is on the ropes, which is exactly why this latest...
2026 Ram 1500 America250 Editions Turn Big Horn, Laramie, and Rebel Into Patriotic Special Trucks
Ram is leaning hard into Americana for the 2026 model year with a new batch of special-edition 1500 pickups created...
Wrongful Death After a Car Accident: Legal Rights of the Family
Car accidents have a devastating impact on one’s life. Even if you drive carefully, you have little control over other...