
Switzerland October 2025: Skoda Elroq signs first ever win, VW Tiguan now #1 YTD
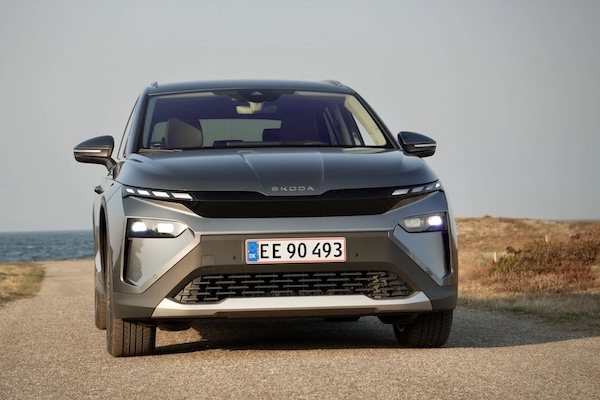
The Skoda Elroq is #1 in Switzerland for the first time.
New car sales in Switzerland edge down -1.6% year-on-year in October to 18,451 units, meaning the year-to-date volume is now off -3.7% to 187,378. 4×4 sales drop -5.3% to 9,246 and 50.1% share vs. 52.1% a year ago. Petrol sales fall -13.2% to 4,305 sales and 23.3% share vs. 26.4% last year and diesel sinks -26.9% to 1,173 and 6.4% share vs. 8.6% in October 2024. HEVs (including mild hybrids) are down -6.1% to 6,443 and 34.9% share vs. 36.6%. The real dynamic segments are rechargeable cars: PHEVs are up 33.6% to 2,355 and 12.8% share vs. 9.4% and BEVs are up 17.1% to 4,175 and 22.6% share vs. 19% a year ago. So far this year, BEVs are up 9.7% to 39,900 and 21.3% share vs. 18.7% over the same period in 2024.
This month Skoda (+15.2%) is the most popular carmaker in the country by just three sales above Volkswagen (+12.3%). This is the 4th time Skoda is #1 in Switzerland after January 2022, April 2024 and February 2025. This way, the Czech manufacturer advances to #2 year-to-date, passing BMW (-4.5%). Toyota (-26.3%), Mercedes (-20.1%) and Audi (-5%) struggle. In contrast Dacia (+9.7%), Volvo (+8.7%) and Renault (+6.3%) defy the negative market with relatively solid gains. Further down, MG is up 201%, Opel up 52.7% and Citroen up 40.5%.
Model-wise, the new Skoda Elroq scores its first ever win with 2.5% share, 12 above the VW Tiguan (+3.3%). The Elroq ranks #14 year-to-date while the Tiguan overtakes the Tesla Model Y (-34.7%), down to #48 in October, for the YTD pole position. The Skoda Kodiaq (+34.4%), VW Golf (+39.8%) and BMW X1 (+24.8%) follow with stunning lifts. The BMW X3 (+116.7%), Dacia Sandero (+24.6%) and Audi Q3 (+24.3%) also impress in the remainder of the Top 10.
Previous month: Switzerland September 2025: Tesla Model Y and Skoda Elroq on top
One year ago: Switzerland October 2024: VW Tiguan best-seller, sales off -7.9%
Full October 2025 Top 63 All brands and Top 361 All models below.
Switzerland October 2025 – brands:
PosBrandOct-25%/24Sep2025%/24PosFY241Skoda2,05711.1%+ 15.2%317,4959.3%+ 1.0%232Volkswagen2,05411.1%+ 12.3%119,74210.5%+ 5.0%113BMW1,5938.6%– 4.5%417,3809.3%– 3.8%324Audi1,4848.0%– 5.0%513,9337.4%– 1.4%555Mercedes1,4417.8%– 20.1%215,1988.1%– 6.4%446Toyota9155.0%– 26.3%69,4995.1%– 12.8%667Dacia7904.3%+ 9.7%97,0263.7%+ 8.5%9118Volvo7894.3%+ 8.7%86,8193.6%– 10.3%1079Renault7294.0%+ 6.3%127,5354.0%+ 10.0%71010Hyundai7233.9%– 6.9%107,4034.0%+ 3.3%8911Kia5092.8%+ 0.8%115,3332.8%– 3.5%111312Ford5012.7%– 10.1%154,9352.6%– 20.9%121213Peugeot4232.3%– 3.6%164,3702.3%+ 0.3%141514Cupra3952.1%+ 14.2%133,5861.9%+ 52.1%171915Porsche3481.9%– 11.9%193,9062.1%– 12.7%151616Suzuki3131.7%– 14.0%212,9951.6%– 19.6%191717MG3071.7%+ 201.0%142,6611.4%+ 615.3%213318Opel3071.7%+ 52.7%182,8641.5%+ 3.2%202119Seat2941.6%– 27.9%173,8032.0%– 28.4%161420Citroen2361.3%+ 40.5%202,1441.1%– 5.6%232421Honda2041.1%– 5.6%242,0321.1%– 19.8%252222Mini1861.0%– 18.8%223,1961.7%+ 27.9%182323Mazda1740.9%– 43.5%232,4091.3%– 29.3%221824Fiat1630.9%– 33.7%291,2110.6%– 58.2%282025BYD1410.8%+ 2720.0%256580.4%+ 1835.3%335326Mitsubishi1330.7%+ 6.4%271,3270.7%– 36.5%272527Tesla1280.7%– 50.8%74,6352.5%– 38.2%13828Land Rover1180.6%– 25.3%321,6690.9%– 18.4%262629Jeep1160.6%– 12.8%261,0690.6%– 7.8%292930Leapmotor1130.6%new336080.3%new356231Alfa Romeo1010.5%+ 57.8%308400.4%+ 21.7%323232Polestar760.4%+ 40.7%319040.5%+ 96.5%313433Smart720.4%– 28.0%355970.3%– 19.1%363134Subaru720.4%+ 2.9%281,0000.5%– 21.1%302835Lexus640.3%– 26.4%376240.3%– 24.2%343036Ferrari420.2%+ 100.0%384530.2%+ 7.9%373637JAC420.2%+ 50.0%541730.1%+ 133.8%434738KGM/SsangYong380.2%+ 46.2%363800.2%– 4.3%383539DS350.2%+ 25.0%431960.1%– 22.2%424040Nissan300.2%– 68.8%342,1311.1%+ 5.7%242741Genesis230.1%– 67.6%402390.1%– 21.1%413842Lamborghini200.1%+ 17.6%412950.2%+ 27.2%394143Maserati200.1%+ 5.3%441680.1%– 41.9%443744Zeekr200.1%new51440.0%new53 –45Alpine160.1%+ 128.6%392930.2%+ 193.0%404546Bentley120.1%+ 20.0%461270.1%+ 5.0%474447Aston Martin100.1%– 23.1%421290.1%– 22.8%464248BAIC70.0%new50210.0%new58 –49Dongfeng70.0%n/a –540.0%+ 1250.0%526350Dodge60.0%+ 50.0%47340.0%– 12.8%544651Man60.0%+ 200.0%53340.0%+ 142.9%555852Xpeng60.0%new59190.0%new59 –53BMW Alpina40.0%n/a49580.0%n/a50n/a54Chevrolet40.0%n/a52130.0%– 59.4%625255McLaren40.0%n/a60280.0%– 17.6%575456Cadillac30.0%– 66.7%45600.0%– 40.0%484357Ineos30.0%+ 200.0%58170.0%– 70.7%604958Jaguar20.0%– 90.5%481570.1%– 41.6%453959Lotus20.0%– 71.4%57550.0%– 24.7%514860Bugatti10.0%n/a6230.0%+ 200.0%676461Caterham10.0%+ 0.0%6190.0%– 18.2%635962Lucid10.0%– 80.0%56600.0%+ 200.0%495663Voyah10.0%– 66.7% –150.0%– 42.3%6155 –Others160.1%– 5.9% –2480.1%+ 22.8% – –
Switzerland October 2025 – models:
PosModelOct-25%/24Sep2025%/24PosFY241Skoda Elroq4542.5%new22,3491.3%new14 –2VW Tiguan4422.4%+ 3.3%43,7032.0%+ 1.2%133Skoda Kodiaq3952.1%+ 34.4%53,1591.7%+ 16.9%484VW Golf3762.0%+ 39.8%83,0421.6%+ 25.7%5105BMW X13571.9%+ 24.8%292,7841.5%– 19.7%756Mercedes GLC3301.8%– 2.4%33,5001.9%– 0.2%347Dacia Sandero2991.6%+ 24.6%132,5161.3%+ 1.9%11138Audi Q32971.6%+ 24.3%142,7341.5%– 15.8%869Skoda Karoq2961.6%– 13.2%112,8071.5%– 3.5%6710BMW X32731.5%+ 116.7%62,5151.3%+ 26.4%122011Toyota Yaris2711.5%– 27.2%92,7081.4%– 1.9%9912Skoda Enyaq2561.4%– 20.2%192,0421.1%– 17.6%171113Skoda Fabia2561.4%– 3.0%152,4021.3%+ 9.8%131614Skoda Octavia2531.4%– 24.3%232,5691.4%– 45.5%10215Volvo EX302391.3%+ 45.7%71,5070.8%– 40.8%311216Audi A12301.2%+ 45.6%521,3170.7%+ 6.0%414317Audi A31991.1%+ 17.1%212,1261.1%+ 0.4%161918Dacia Duster1931.0%– 42.0%331,8791.0%– 16.5%191419Dacia Bigster1761.0%new431,1670.6%new47 –20Volvo XC601730.9%– 7.0%312,1691.2%+ 9.4%151821Hyundai Tucson1690.9%+ 3.0%381,7370.9%+ 19.5%243422Mercedes A Class1680.9%– 36.6%181,5260.8%+ 2.3%293123Mercedes GLA1660.9%– 19.4%201,6240.9%+ 0.5%272424Toyota Corolla1650.9%– 2.4%161,7670.9%+ 36.0%234525Audi Q51640.9%+ 0.6%121,3690.7%– 1.4%374726Toyota Yaris Cross1620.9%– 13.4%371,5130.8%– 13.1%302527BMW X51620.9%– 2.4%251,6700.9%+ 8.4%253628Suzuki Swift1610.9%+ 30.9%411,3720.7%+ 4.3%365029Audi Q41550.8%– 41.9%241,5520.8%– 22.5%281730Kia Sportage1550.8%– 9.4%221,7670.9%– 9.2%222131Renault 51550.8%+ 2114.3%861,3270.7%+ 6884.2%4014632VW ID.31540.8%+ 40.0%281,2970.7%– 7.2%424233Mercedes GLE1450.8%– 9.4%261,2480.7%– 3.3%445234Porsche 9111450.8%+ 173.6%531,4000.7%+ 15.9%356135Volvo XC401440.8%+ 9.1%889730.5%– 20.4%645136Cupra Terramar1400.8%+ 225.6%271,7670.9%+ 3826.7%2118637BMW 2 Series1320.7%– 25.0%461,2820.7%– 16.3%434138Hyundai Kona1230.7%+ 2.5%541,1590.6%– 34.3%482839Peugeot 2081220.7%– 44.0%751,4720.8%+ 19.7%344840Renault Clio1150.6%+ 6.5%471,0620.6%– 36.8%553041VW Tayron1150.6%new748360.4%new76 –42Opel Corsa1140.6%+ 147.8%391,1350.6%+ 78.7%529843VW Polo1130.6%– 23.6%101,7780.9%– 11.2%201544BMW 1 Series1110.6%– 32.7%401,6680.9%+ 2.1%262645Seat Ibiza1110.6%– 30.2%551,3570.7%– 22.3%392746Peugeot 30081110.6%+ 184.6%1136590.4%+ 52.2%9912647Cupra Tavascan1100.6%+ 18.3%307840.4%+ 353.2%8212748Tesla Model Y1090.6%– 34.7%13,5811.9%– 35.6%2149MG ZS1080.6%+ 176.9%359870.5%+ 750.9%6222050Audi A61070.6%+ 59.7%951,1900.6%+ 137.5%4511451Kia EV41060.6%new –1060.1%new242 –52Mini Hatch (incl Cabrio, Clubman)1040.6%– 15.4%361,9731.1%+ 18.1%182953Citroen C31030.6%+ 60.9%621,0000.5%– 0.9%606354MG HS1020.6%+ 325.0%347530.4%+ 1611.4%8426855BMW ix11010.5%– 11.4%681,3640.7%+ 23.8%385756Ford Puma970.5%– 22.4%561,1420.6%– 24.3%494457Audi Q2970.5%– 15.7%997960.4%– 35.1%805558VW T6970.5%+ 136.6%669360.5%– 2.9%697559Audi A5970.5%+ 708.3%589510.5%+ 392.7%6716460Seat Leon950.5%+ 31.9%491,1200.6%+ 7.8%536261Porsche Cayenne950.5%+ 61.0%619000.5%– 3.4%727662Toyota RAV4940.5%– 45.3%489840.5%– 12.8%635663Fiat Panda930.5%+ 22.4%1293890.2%– 36.6%14310564Dacia Jogger910.5%– 18.0%441,1350.6%– 25.7%514065Hyundai Inster910.5%new945860.3%new107 –66Renault Captur900.5%– 5.3%779450.5%– 4.0%686067Ford Kuga890.5%– 46.4%1309040.5%– 46.3%713268VW T-Cross890.5%– 24.6%1017680.4%– 23.0%836469Mercedes V Class870.5%– 32.6%891,1410.6%+ 3.2%505370Audi Q6860.5%– 55.0%641,1670.6%+ 139.6%468271VW Passat850.5%– 29.2%739970.5%+ 8.0%617172Renault 4850.5%new1462950.2%new173 –73BMW 3 Series830.4%– 58.9%591,4960.8%– 19.1%322374Ford Explorer830.4%+ 43.1%1844170.2%+ 48.9%13515975VW Caddy820.4%– 39.7%821,0610.6%+ 8.3%566876Toyota C-HR810.4%– 19.8%1076710.4%– 40.6%955977VW T-Roc800.4%– 48.7%321,4790.8%– 19.2%332278Cupra Formentor790.4%– 47.3%831,0240.5%– 29.0%583779Volvo XC90790.4%– 30.7%728290.4%+ 3.6%787380Hyundai i10790.4%– 20.2%657520.4%+ 2.3%859581Suzuki Vitara790.4%+ 27.4%1066310.3%– 9.7%1029182Ford Custom770.4%+ 120.0%698400.4%+ 252.9%7516583Honda Jazz760.4%+ 40.7%1195710.3%+ 18.7%10811984Alfa Romeo Junior760.4%+ 280.0%795240.3%+ 1487.9%11425085Hyundai i20750.4%+ 21.0%858250.4%+ 4.2%798886Mercedes C Class740.4%– 21.3%519070.5%– 25.5%705487Porsche Macan730.4%– 65.4%1001,0350.6%– 35.0%573888Jeep Avenger730.4%– 1.4%505940.3%– 15.6%1059989Opel Grandland X730.4%+ 630.0%1263410.2%– 9.1%15815390BMW 5 Series710.4%+ 16.4%871,0230.5%+ 35.7%597491Renault Symbioz710.4%+ 144.8%1337350.4%+ 406.9%8919892VW T7700.4%+ 14.8%1036900.4%– 17.6%938393Volvo EX40700.4%+ 141.4%1155370.3%+ 174.0%11118594BYD Seal U690.4%new453190.2%new168 –95Hyundai Ioniq 5680.4%– 66.8%1178350.4%– 28.2%774696VW ID.4670.4%+ 11.7%605170.3%– 37.6%1157997Cupra Born660.4%+ 10.0%1104670.2%– 33.1%1238698Seat Ateca650.4%– 50.0%631,1190.6%– 28.9%543599Skoda Kamiq640.3%– 27.3%929590.5%– 6.2%6665100Mercedes EQA640.3%– 4.5%707040.4%– 14.0%9281101VW ID.Buzz630.3%+ 950.0%907180.4%+ 465.4%90196102Mercedes CLA610.3%+ 17.3%424830.3%+ 23.8%119132103Skoda Superb600.3%– 25.9%988420.4%+ 9.4%7487104Leapmotor C10600.3%new1432420.1%new182426105VW ID.7590.3%+ 51.3%675320.3%+ 105.4%112163106Mini Countryman580.3%– 45.8%1458850.5%+ 7.0%7378107Mercedes E Class580.3%– 17.1%977460.4%– 4.4%8680108Peugeot 5008570.3%+ 16.3%764310.2%+ 113.4%132197109Opel Frontera570.3%new803840.2%new144 –110Range Rover Sport560.3%+ 19.1%1656430.3%– 7.5%10096111Renault Rafale550.3%– 32.9%847400.4%+ 169.1%88158112Mercedes Vito550.3%– 3.5%1216650.4%+ 2.9%9790113Honda CR-V520.3%+ 62.5%1234400.2%+ 23.9%131148114Volvo EX90520.3%+ 477.8%1284060.2%+ 4411.1%137277115Mazda2500.3%– 46.8%1447110.4%– 28.0%9169116Mercedes GLB500.3%– 35.1%815100.3%– 20.8%116102117Toyota Aygo500.3%+ 28.2%935530.3%+ 1.7%110115118Citroen C3 Aircross500.3%+ 316.7%1083990.2%– 15.8%139130119Ford Focus490.3%– 27.9%1096840.4%– 24.5%9477120Peugeot 308490.3%– 19.7%716700.4%– 54.6%9649121VW Caravelle490.3%n/a1021840.1%n/a204 –122Peugeot 2008480.3%+ 0.0%1127940.4%+ 43.3%81111123Renault Austral470.3%– 4.1%1385880.3%– 17.6%10693124Mitsubishi Colt470.3%+ 113.6%1363710.2%– 11.7%147125125Suzuki SX4 S-Cross460.2%– 24.6%1474470.2%– 30.7%129101126MG 3460.2%+ 76.9%1314680.2%+ 307.0%122195127Mitsubishi Outlander450.2%n/a1052940.2%+ 9700.0%175415128Smart #5440.2%new1622170.1%new191 –129BMW X2430.2%– 44.2%1704540.2%– 29.9%126100130Toyota Proace430.2%– 15.7%1274690.3%– 6.9%121109131BMW IX430.2%+ 79.2%1393930.2%+ 12.6%140156132VW Touran420.2%– 19.2%1246640.4%– 14.2%9867133Kia Stonic400.2%– 42.9%1114020.2%– 8.0%138128134BMW 4 Series390.2%– 25.0%1596030.3%– 14.1%10397135Kia Picanto380.2%– 44.1%1204990.3%– 11.4%118110136Mercedes CLE380.2%– 36.7%1425250.3%+ 57.7%113144137Citroen C5 Aircross380.2%– 35.6%1401890.1%– 47.2%200154138Kia EV3380.2%+ 1800.0%576340.3%+ 31600.0%101238139Honda HR-V370.2%+ 85.0%1914420.2%– 40.2%13092140Hyundai i30350.2%– 27.1%1675060.3%– 16.6%117103141Kia Ceed350.2%– 10.3%915990.3%+ 7.9%104106142Leapmotor T03350.2%new1603390.2%new160405143Kia Niro340.2%– 57.5%1253920.2%– 44.2%14194144Mazda CX-30340.2%– 33.3%1484500.2%– 12.1%127104145Subaru Crosstrek340.2%– 20.9%1143770.2%– 7.8%145113146Hyundai Santa Fe340.2%– 12.8%964750.3%+ 134.0%120181147Renault Kangoo330.2%– 37.7%1693910.2%+ 24.1%142157148BMW X7330.2%– 35.3%1343430.2%– 7.8%157140149Mitsubishi ASX330.2%+ 83.3%1323250.2%– 34.9%167123150MG 4330.2%+ 450.0%1352250.1%+ 144.6%185258151Mercedes G Class320.2%– 27.3%1683180.2%– 7.0%169149152Fiat 600320.2%– 15.8%1523450.2%+ 27.3%155169153Opel Astra310.2%– 67.0%1634220.2%– 64.4%13358154Dacia Spring310.2%– 13.9%1743290.2%+ 45.6%166180155BMW ix2310.2%+ 47.6%1803340.2%– 19.9%162133156VW Taigo290.2%– 34.1%1982220.1%– 36.4%186137157JAC E30X290.2%new2941290.1%new221 –158Audi Q8280.2%– 60.6%1583390.2%– 56.3%15985159Toyota Land Cruiser280.2%– 57.6%1554070.2%+ 8.2%136121160Mercedes EQE280.2%– 12.5%1722750.1%– 34.7%176136161Polestar 4280.2%+ 0.0%1374470.2%+ 295.6%128211162Land Rover Defender280.2%+ 40.0%1943550.2%+ 7.6%153150163Mazda6280.2%+ 1300.0%781270.1%+ 217.5%222310164BYD Sealion 7280.2%new1811550.1%new213 –165Fiat 500270.1%– 76.9%1512940.2%– 80.9%17439166Renault Scenic270.1%– 67.1%1543530.2%– 35.1%154112167Ford Courier270.1%+ 68.8%1712530.1%+ 130.0%181232168Lexus LBX260.1%– 25.7%1882210.1%– 10.9%187179169VW Touareg260.1%– 10.3%1902200.1%– 17.3%188172170Polestar 3260.1%+ 100.0%232970.1%+ 64.4%247280171Renault Espace250.1%– 35.9%1664600.2%– 13.4%125108172BMW i4250.1%– 28.6%1503290.2%– 17.5%165139173Mazda CX-60240.1%– 22.6%1822980.2%– 16.3%172134174Opel Mokka240.1%+ 4.3%1613100.2%+ 31.4%171173175Hyundai Bayon240.1%+ 71.4%1921920.1%+ 57.4%198233176Lexus NX240.1%+ 71.4%2032060.1%– 23.4%195182177Mini Aceman240.1%new1413380.2%new161267178Skoda Scala230.1%– 63.5%1643660.2%– 32.0%148116179Seat Arona230.1%+ 0.0%1732070.1%– 50.1%194138180Honda Civic220.1%+ 4.8%1043630.2%+ 16.3%149161181BMW i5220.1%+ 15.8%1223310.2%+ 19.9%163170182Polestar 2220.1%+ 69.2%1493600.2%+ 25.0%150168183BYD Seal220.1%+ 450.0%224930.0%+ 342.9%255328184Ford Connect210.1%– 34.4%1573300.2%– 22.4%164129185Kia EV6210.1%+ 31.3%1762660.1%– 23.3%178145186Ford Capri210.1%new2541120.1%new235313187Mazda CX-80200.1%– 47.4%2561520.1%+ 230.4%215259188Mercedes B Class200.1%– 16.7%1561840.1%– 7.1%203194189BMW X6190.1%– 38.7%1752160.1%– 10.7%192178190Kia Sorento190.1%– 36.7%1533580.2%+ 1.1%151151191Peugeot Traveller190.1%+ 280.0%1971440.1%– 5.9%218217192Subaru Forester180.1%+ 200.0%1183750.2%+ 56.9%146162193Leapmotor B10180.1%new247270.0%new322 –194Audi Q7170.1%– 58.5%1872670.1%– 6.3%177155195BMW XM170.1%– 34.6%2112020.1%+ 23.2%197206196Peugeot Rifter170.1%+ 112.5%2491810.1%+ 33.1%205215197Citroen C4 170.1%+ 183.3%2012040.1%+ 67.2%196245198DS 4170.1%+ 240.0%253550.0%– 20.3%278279199Tesla Model 3160.1%– 78.1%179630.5%– 38.7%6533200Porsche Taycan160.1%– 59.0%2221880.1%– 27.7%202177201Citroen Berlingo160.1%– 15.8%1162190.1%– 3.5%189187202Lamborghini Urus160.1%+ 300.0%2182180.1%+ 83.2%190243203Ferrari 12Cilidri160.1%new243830.0%new260442204Mazda3150.1%– 16.7%2311620.1%– 32.5%210184205Maserati Grecale150.1%– 6.3%2301180.1%– 36.2%231183206Volvo EC40150.1%+ 50.0%241760.0%+ 18.8%267278207Ford Mustang150.1%+ 87.5%226950.1%+ 0.0%252253208Hyundai Staria150.1%+ 650.0%2271300.1%+ 27.5%220247209Volvo V60140.1%– 75.9%2102600.1%– 48.5%180107210Smart #1140.1%– 72.5%2591670.1%– 57.8%207141211Smart #3140.1%– 68.9%2152120.1%– 32.5%193152212Suzuki Across140.1%+ 100.0%195780.0%+ 20.0%266263213Suzuki Ignis130.1%– 86.9%2094620.2%– 47.6%12472214Jeep Renegade130.1%– 35.0%2201080.1%– 28.0%238219215Kia EV9130.1%– 27.8%2211910.1%– 34.1%199167216Mercedes Sprinter130.1%– 7.1%2401120.1%– 12.5%236226217Alpine A290130.1%+ 1200.0%1772380.1%+ 23700.0%184380218JAC ES4130.1%n/a –440.0%+ 633.3%294382219Zeekr 7X130.1%new266260.0%new325 –220Nissan Qashqai120.1%– 70.7%1797410.4%– 11.5%8784221Mercedes GLS120.1%– 42.9%2041200.1%– 18.4%227216222Genesis GV60120.1%+ 0.0%255860.0%– 14.9%258251223Subaru Outback120.1%+ 100.0%1831640.1%– 28.4%208189224Jeep Grand Cherokee120.1%+ 300.0%284990.1%+ 98.0%245281225Honda ZR-V110.1%– 86.3%2161300.1%– 66.8%219120226Renault Megane110.1%– 85.9%1891470.1%– 80.3%21789227Mercedes EQB110.1%– 50.0%1961890.1%– 18.2%201176228DS 7110.1%– 42.1%277950.1%– 30.7%251230229Alfa Romeo Stelvio110.1%– 38.9%2341210.1%– 18.8%224213230Jeep Compass110.1%– 8.3%1991500.1%+ 2.0%216212231Citroen Jumpy110.1%+ 57.1%237960.1%+ 33.3%248275232Ferrari Purosangue110.1%+ 83.3%2381150.1%+ 8.5%233254233BYD Dolphin110.1%new223440.0%new292444234KGM / SsangYong Actyon110.1%new228650.0%new271 –235Genesis GV70100.1%– 79.2%2451180.1%– 18.1%229222236Range Rover Evoque100.1%– 64.3%2191760.1%– 39.5%206171237BMW X4100.1%– 9.1%2741190.1%– 57.0%228174238Kia Xceed100.1%+ 42.9%217950.1%– 41.7%253210239KGM Torres100.1%+ 233.3%2021070.1%– 6.1%241242240Ford Transit100.1%+ 400.0%244310.0%– 6.1%314323241Hyundai Ioniq 9100.1%new185520.0%new284 –242MG S5100.1%new178790.0%new265 –243Range Rover 90.0%– 78.6%2502390.1%– 46.7%183124244Ford Mustang Mach-E90.0%– 76.9%282690.0%– 81.6%270143245Renault Trafic90.0%– 25.0%2513450.2%+ 77.8%156193246Land Rover Discovery Sport90.0%– 18.2%2291080.1%– 18.2%239229247Toyota Prius90.0%+ 12.5%2001560.1%– 33.3%212192248Lexus RX80.0%– 38.5%307960.1%– 27.8%249240249Alfa Romeo Tonale80.0%– 20.0%1861090.1%– 73.5%237142250KGM Tivoli80.0%– 11.1%239820.0%+ 2.5%263269251Bentley Continental GT80.0%+ 14.3%235820.0%+ 26.2%262285252Jeep Wrangler70.0%– 70.8%1931180.1%+ 9.3%230221253Ferrari 29670.0%– 50.0%278930.0%– 26.2%256239254Porsche Panamera70.0%– 50.0%2081630.1%+ 26.4%209231255Mercedes AMG GT70.0%– 46.2%2571000.1%– 6.5%244244256Nissan X-Trail70.0%– 46.2%2075530.3%+ 16.7%109122257Porsche Boxster70.0%– 36.4%2331230.1%– 40.0%223200258BMW 7 Series70.0%+ 0.0% –400.0%– 48.7%300270259DS 370.0%+ 75.0%338440.0%+ 2.3%293304260MG Cyberster70.0%+ 250.0%2251080.1%+ 5300.0%240359261BYD Atto 270.0%new333100.0%new358 –262Dongfeng Box70.0%new –540.0%new280 –263Mitsubishi Space Star60.0%– 91.0%2062650.1%– 71.9%17966264Alfa Romeo Giulia60.0%– 62.5%291860.0%– 8.5%257256265Honda e:Ny160.0%– 33.3%213860.0%– 65.7%259190266Audi e-tron GT60.0%– 25.0%292520.0%+ 4.0%282296267BMW Z460.0%– 14.3%2421210.1%+ 12.0%225248268Subaru Soltera60.0%– 14.3%260370.0%– 38.3%304289269Man TGE60.0%+ 200.0%285340.0%+ 142.9%308356270Mercedes S Class50.0%– 64.3%2051040.1%– 36.6%243208271KGM Korando50.0%– 44.4%269460.0%– 54.5%288257272Porsche Cayman50.0%– 37.5%311960.1%– 34.2%250224273Range Rover Velar50.0%– 16.7%2701180.1%+ 0.0%232227274Ferrari SF9050.0%+ 66.7%280520.0%+ 15.6%283301275Nissan Ariya50.0%+ 150.0%2143560.2%+ 118.4%152214276Renault Arkana40.0%– 87.1%3121130.1%– 69.8%234131277Nissan Juke40.0%– 86.7%2483180.2%– 20.5%170135278Lexus UX40.0%– 75.0%344440.0%– 45.0%295252279Mercedes Citan40.0%– 69.2%286420.0%– 52.3%297264280Mercedes EQV40.0%– 42.9%308450.0%– 2.2%290291281KGM Rexton40.0%– 20.0%263800.0%– 21.6%264234282Bentley Bentayga40.0%+ 33.3%315370.0%– 9.8%303312283BMW 8 Series40.0%+ 33.3%262500.0%– 19.4%285290284BMW i740.0%+ 33.3%331420.0%– 4.5%296305285Aston Martin Vantage40.0%n/a273380.0%+ 245.5%301342286Fiat Pandina40.0%new304220.0%new327 –287Zeekr X40.0%new –110.0%new356 –288Toyota bZ4X30.0%– 87.5%2651580.1%– 50.5%211166289Toyota Corolla Cross30.0%– 80.0%313550.0%– 83.7%279160290Opel Vivaro30.0%– 70.0%310560.0%+ 60.0%276309291Volvo V9030.0%– 70.0%322260.0%– 60.6%324286292Aston Martin DB1230.0%– 57.1%261400.0%– 32.2%299295293Alpine A11030.0%– 50.0%299550.0%– 44.4%277249294Mercedes T Class30.0%– 40.0%288380.0%– 29.6%302287295Mazda MX-530.0%– 25.0%295830.0%– 35.7%261236296Opel Zafira30.0%– 25.0%258940.1%+ 17.5%254265297Dodge Durango30.0%+ 0.0%268110.0%– 26.7%353317298Mercedes SL Class30.0%+ 50.0%287360.0%– 62.1%306266299Dodge Challenger30.0%+ 200.0%337170.0%– 15.0%336288300Ineos Grenadier30.0%+ 200.0%305170.0%– 70.7%337284301Aston Martin Vanquish30.0%n/a –140.0%n/a341 –302BYD Tang30.0%n/a –50.0%+ 400.0%385445303Chevrolet Corvette30.0%n/a33660.0%– 72.7%380332304Fiat Doblo30.0%n/a30380.0%+ 166.7%372411305McLaren 750S30.0%n/a –150.0%– 21.1%340349306BAIC X5530.0%new267120.0%new350 –307BAIC X730.0%new31470.0%new376 –308Xpeng G630.0%new36190.0%new369 –309Xpeng G930.0%new324100.0%new362 –310Zeekr 00130.0%new –70.0%new378 –311Mitsubishi Eclipse Cross20.0%– 88.9%309720.0%– 68.0%268188312Opel Combo20.0%– 85.7%2971210.1%– 0.8%226223313Ferrari Roma20.0%– 80.0%279710.0%– 12.3%269272314Lamborghini Huracan20.0%– 77.8% –280.0%– 63.2%320273315Tesla Model X20.0%– 77.8%358600.0%– 69.4%273202316VW ID.520.0%– 60.0%290540.0%– 50.5%281241317Subaru Impreza20.0%– 50.0%264450.0%– 65.9%291235318Alpina B3 Biturbo20.0%– 33.3%298300.0%+ 50.0%315326319Lamborghini Revuelto20.0%– 33.3%306470.0%+ 30.6%287318320Rolls-Royce Spectre20.0%– 33.3%357110.0%– 35.3%355348321Toyota Supra20.0%– 33.3% –190.0%– 44.1%331311322VW Crafter20.0%– 33.3%323190.0%+ 0.0%332338323Cadillac Escalade20.0%+ 100.0%236180.0%+ 200.0%333357324Maserati Granturismo20.0%n/a34790.0%– 70.0%365320325Mercedes EQS10.0%– 92.9%319290.0%– 85.4%319205326Tesla Model S10.0%– 90.9%289300.0%– 83.1%318201327Audi A710.0%– 85.7%328310.0%– 24.4%312308328Jaguar F-Pace10.0%– 85.7%246590.0%– 25.3%274262329Nissan Townstar10.0%– 83.3%353970.1%+ 94.0%246293330Lucid Air10.0%– 80.0%317590.0%+ 195.0%275334331MG Marvel10.0%– 80.0%296360.0%+ 0.0%307315332Aston Martin DBX10.0%– 75.0%272330.0%+ 3.1%309303333Lotus Eletre10.0%– 75.0%316300.0%– 34.8%317299334Genesis G9010.0%– 66.7% –80.0%– 42.9%373362335Lotus Emira10.0%– 66.7% –170.0%– 22.7%338336336Nissan Primastar10.0%– 66.7% –630.0%+ 21.2%272298337Maserati Levante10.0%– 50.0% –50.0%– 83.3%387325338Voyah Free10.0%– 50.0% –140.0%– 44.0%345331339BYD Atto 310.0%+ 0.0%300170.0%+ 41.7%335366340Caterham Seven10.0%+ 0.0%33590.0%+ 12.5%363368341Fiat Scudo10.0%+ 0.0%340140.0%+ 250.0%342408342Lexus LM10.0%+ 0.0% –120.0%+ 71.4%352375343Rolls-Royce Cullinan10.0%+ 0.0%356140.0%– 30.0%344333344Alpina XB710.0%n/a –20.0%– 33.3%408414345Alpina XD4 Biturbo10.0%n/a –10.0%– 66.7%446404346Chevrolet Camaro10.0%n/a27560.0%+ 20.0%379376347Citroen SpaceTourer10.0%n/a252300.0%+ 650.0%316392348Ferrari Daytona10.0%n/a293250.0%+ 38.9%326343349Ford GT10.0%n/a –20.0%– 80.0%412373350Jaguar F-Type10.0%n/a342100.0%– 68.8%360322351Maserati GranCabrio10.0%n/a318180.0%+ 200.0%334369352Maserati MC2010.0%n/a –110.0%– 21.4%354354353McLaren GTS10.0%n/a –40.0%+ 100.0%399419354Renault Kadjar10.0%n/a –20.0%+ 100.0%419441355Renault Master10.0%n/a35530.0%– 78.6%405360356Toyota Mirai10.0%n/a –40.0%+ 0.0%401395357BAIC BJ3010.0%new –10.0%new425 –358Bugatti Mistral10.0%new –20.0%new410 –359Cadillac Vistiq10.0%new33440.0%new393 –360Mercedes AMG Pure Speed10.0%new35120.0%new417 –361MG IM510.0%new –10.0%new435 –
Source: Auto Suisse


More Stories
Transformative Solo Travel: How One Trip Changed My Daily Habits and Mindset
Solo travel has quietly become one of the most powerful tools for personal reinvention. Search interest in “solo travel” hit...
Knowing When to Repair or Replace Bike Parts
Keeping a bike in good condition rarely comes down to a single decision. It is more of an ongoing judgment...
China imports February 2026: Toyota Land Cruiser, BMW 7 Series stand out, sales off -18.3%
This content is for members only. Visit the site and log in/register to read.
Big Loads, Big Pay: How to Land Heavy Haul Work as an Owner Operator
If you drive your own truck and you want higher rates, heavy haul can look like the next level. You...
2027 Volkswagen Atlas Gets More Power, Smarter Tech, and a More Upscale Family-SUV Feel
Volkswagen is giving the Atlas a meaningful overhaul for 2027, and while the overall shape remains familiar, this second-generation version...
GM Extends Factory ZERO Shutdown as EV Demand Stays Uneven
General Motors is keeping its Factory ZERO plant in Detroit-Hamtramck offline through April 13, extending a production pause that began...