
Sweden October 2025: Volvo at highest share in almost 3 years
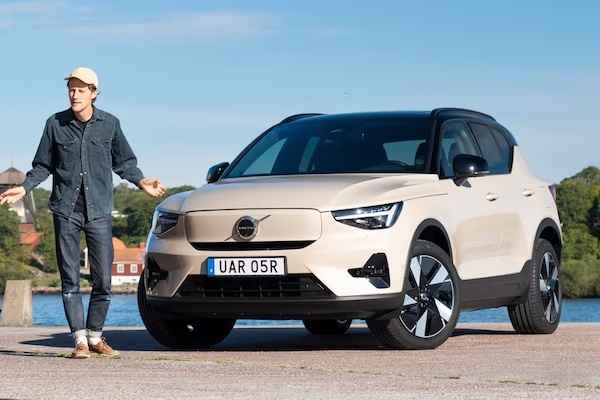
Volvo EX/XC40 sales are up 60.2% in October.
24,078 new cars found a Swedish buyer in October, a -3.8% year-on-year loss. It brings the year-to-date tally to 228,105, this time up 4.4%. Company sales account for over 60% of the market. Two out of Three new cars this month are rechargeable: 36% BEV and 30% PHEV. Year-to-date, BEVs represent 35.5% of the market while PHEVs are at 27%, the highest level in Europe. Volvo (+2.2%) dominates its home brands charts, and at 21.8%, it hits its highest share since December 2022 (24.8%). Volkswagen (+10.5%), Toyota (+12.4%), Kia (+9.1%) and Mercedes (+9.6%) all sport very solid gains but are far below. BMW (+30.9%) is the most dynamic in the Top 10 whereas Peugeot (-21.5%), Cupra (-13%), Audi (-8.7%) and Skoda (-1.7%) decline. Lynk & Co (+433.3%) surges to #21 and 0.8% share, with Mini (+72.8%), Opel (+45.5%), Fiat (+33.5%) and Hyundai (+25.7%) also in fantastic shape.
Over in the models charts, the Volvo XC60 (+9.1%) equals its highest market share of the year at 8.4%, also reached last April. The Volvo EX/XC40 (+60.2%) surges back to 2nd place while the VW ID.7 (-5.3%) is up two spots on last month to #3 but drops year-on-year. Celebrating one year in market, the Kia EV3 equals its record ranking and share but breaks its volume record at 593. The Volvo S/V60 (+1.7%) bounces back up 6 ranks on September to #5, distancing the VW ID.4 (-8.4%) The Skoda Kodiaq (+40.7%) continues on its stellar year, with YTD volumes up 98.6%. The VW Passat (+53.6%) is up 17 spots to #9, with the VW Tiguan (+23.2%) and Toyota RAV4 (+21.7%) also impressive.
Previous month: Sweden September 2025: Volvo (+32.2%), Polestar (+97.2%) shine, Tesla (-64%) crashes
One year ago: Sweden October 2024: Volvo at 20.5% share, VW ID.7 up to #4
Full October 2025 Top 51 All brands and Top 270 All models below.
Sweden October 2025 – brands:
PosBrandOct-25%/24Sep2025%/24PosFY241Volvo5,24221.8%+ 2.2%141,21718.1%+ 9.0%112Volkswagen3,47614.4%+ 10.5%231,76713.9%+ 37.2%223Toyota 1,9888.3%+ 12.4%317,8597.8%+ 1.6%344Kia 1,9708.2%+ 9.1%416,0867.1%+ 2.9%455Mercedes 1,5256.3%+ 9.6%614,4406.3%+ 6.4%566Skoda 1,5206.3%– 1.7%714,2666.3%+ 35.7%687BMW 1,3385.6%+ 30.9%812,7365.6%+ 26.8%898Audi 1,2595.2%– 8.7%912,8375.6%+ 10.6%779Peugeot 7543.1%– 21.5%117,9853.5%– 1.3%91010Cupra6092.5%– 13.0%125,7462.5%+ 34.8%121211Polestar5792.4%+ 6.6%106,1642.7%+ 34.2%101112Ford 3031.3%+ 5.2%183,6871.6%– 8.1%131313Nissan 2791.2%– 7.9%172,7171.2%+ 2.5%171714Opel 2751.1%+ 45.5%231,9460.9%– 3.4%222315Dacia2681.1%+ 3.1%192,4061.1%+ 3.4%201816Hyundai 2591.1%+ 25.7%143,0001.3%+ 9.7%152017Renault2411.0%– 1.2%133,3841.5%+ 11.7%141518Lexus2280.9%– 10.9%162,1350.9%+ 13.3%212219Fiat 2110.9%+ 33.5%202,4401.1%+ 53.4%192620Mazda 2070.9%– 33.4%211,6380.7%– 9.5%232421Lynk & Co1920.8%+ 433.3%261,0700.5%+ 15.6%283022Porsche1720.7%– 51.8%152,4641.1%– 12.5%181623Mini 1590.7%+ 72.8%241,2900.6%+ 77.2%263124Tesla1330.6%– 88.7%55,8432.6%– 66.9%11325Seat1170.5%– 38.1%281,3290.6%– 43.2%252126Xpeng1060.4%+ 10.4%297680.3%+ 39.1%323327Zeekr1020.4%– 32.0%271,0680.5%+ 54.1%292828Suzuki 880.4%– 37.1%259570.4%– 33.3%302729Citroen 840.3%– 8.7%221,0960.5%– 39.0%272530Honda 730.3%+ 1.4%307820.3%– 17.3%312931BYD650.3%+ 0.0%317550.3%+ 1.3%333232Subaru 590.2%– 89.9%362,7941.2%– 21.5%161433MG560.2%– 74.9%341,5260.7%– 44.6%241934Land Rover530.2%+ 89.3%325090.2%+ 34.3%343535Mitsubishi230.1%– 8.0%333070.1%– 28.4%353436Alfa Romeo90.0%+ 125.0%39950.0%+ 79.2%374637NIO90.0%– 18.2%35930.0%– 18.4%383738Smart70.0%– 12.5%40570.0%+ 21.3%424139DS60.0%+ 500.0%43400.0%+ 25.0%465340Jeep40.0%+ 33.3%42890.0%+ 229.6%394841Ferrari40.0%+ 33.3%45530.0%– 27.4%434242Chevrolet 30.0%– 50.0%381100.0%+ 64.2%364343Lamborghini30.0%– 25.0%46420.0%– 32.3%444444Lotus30.0%– 57.1%47400.0%– 9.1%474945Man30.0%– 25.0%41290.0%– 12.1%495146Ineos20.0%– 33.3%49640.0%+ 20.8%404547Maserati20.0%n/a48100.0%– 33.3%575948Hongqi10.0%– 75.0%50320.0%– 69.8%483649Iveco10.0%– 50.0%51170.0%– 5.6%535750Alpine10.0%n/a–70.0%+ 40.0%616251Koenigsegg10.0%n/a–10.0%+ 0.0%6664 –Others60.0%– 14.3%–700.0%– 86.2% ––
Sweden October 2025 – models:
PosModelOct-25%/24Sep2025%/24PosFY241Volvo XC602,0118.4%+ 9.1%115,4926.8%+ 30.2%122Volvo EX/XC401,4506.0%+ 60.2%38,5383.7%+ 25.0%233VW ID.77383.1%– 5.3%56,7373.0%+ 195.9%3164Kia EV35932.5%+ 59200.0%64,3891.9%n/a61455Volvo S/V605442.3%+ 1.7%114,1681.8%– 34.0%756VW ID.45312.2%– 8.4%123,8811.7%– 5.1%1077Skoda Kodiaq4982.1%+ 40.7%74,4512.0%+ 98.6%5278Toyota RAV44942.1%+ 21.7%43,9961.8%– 8.7%969VW Passat4902.0%+ 53.6%263,4451.5%+ 31.1%121510Kia Sportage4251.8%+ 32.8%162,5631.1%– 25.6%221011VW Tiguan4251.8%+ 23.2%93,7131.6%+ 13.1%111212Toyota Yaris Cross4151.7%+ 15.6%212,9241.3%+ 9.3%181713Volvo EX303911.6%– 40.4%254,0681.8%– 26.4%8414VW T-Roc3861.6%+ 58.8%152,9941.3%+ 26.5%161815Polestar 43611.5%+ 65.6%103,3631.5%+ 482.8%136916Toyota Yaris3231.3%+ 43.6%182,7041.2%+ 9.8%192517Toyota Corolla3121.3%+ 69.6%242,9571.3%+ 17.6%172418Skoda Enyaq3061.3%– 44.6%233,3291.5%+ 17.4%141119Peugeot 30082761.1%+ 820.0%172,6581.2%+ 33.0%203720Volvo S/V902511.0%– 28.7%133,0131.3%+ 38.1%152621Peugeot 50082260.9%– 43.9%271,9000.8%– 24.5%332022Mercedes EQB2210.9%+ 211.3%481,3090.6%+ 11.3%514923VW ID.32110.9%– 22.7%192,5241.1%+ 41.0%233824Audi A32100.9%– 32.7%422,4741.1%+ 14.0%242825BMW IX12100.9%+ 4100.0%431,1940.5%+ 23780.0%5827126Audi A52070.9%+ 1050.0%351,2050.5%+ 317.0%5713127Mercedes CLA2050.9%+ 135.6%361,2730.6%+ 87.2%537728Skoda Octavia2010.8%– 32.1%341,8440.8%– 4.7%353229Toyota C-HR1990.8%+ 19.2%531,8510.8%+ 9.3%344030BMW X31960.8%+ 139.0%381,4310.6%+ 33.7%465831Volvo XC901940.8%– 36.8%661,7280.8%– 14.3%383132Audi A6 e-tron1930.8%new651,6730.7%new40 –33Toyota Corolla Cross1870.8%– 37.2%442,3931.0%– 5.1%252134Fiat Ducato1850.8%+ 28.5%462,1671.0%+ 77.8%305135Peugeot 20081830.8%– 34.9%302,3731.0%+ 25.9%263436Cupra Born1820.8%+ 17.4%479370.4%– 50.0%753937Skoda Elroq1780.7%new771,1090.5%new63 –38Nissan Qashqai1750.7%+ 47.1%391,2860.6%+ 15.1%524839Volvo EX901710.7%+ 1800.0%321,3640.6%+ 7078.9%4917440Mercedes EQA1670.7%+ 65.3%291,3910.6%+ 71.1%487041Dacia Sandero1650.7%– 17.9%501,4320.6%– 6.8%453642Mercedes E Class1630.7%– 15.5%282,2101.0%+ 0.6%282943Kia EV91610.7%+ 172.9%621,6080.7%– 3.0%424144Kia Niro1590.7%– 42.4%201,6190.7%– 41.3%412245Audi Q4 E-Tron1540.6%– 9.9%571,7980.8%– 15.7%363046BMW 5-Series1540.6%– 10.5%582,0360.9%+ 57.8%324547Kia EV41510.6%new2151550.1%new181 –48Kia EV61480.6%– 64.4%371,5240.7%– 15.5%443349Cupra Terramar1460.6%+ 4766.7%221,7960.8%+ 59766.7%3720750Volvo EC/C401460.6%– 67.9%412,1330.9%– 15.3%311451VW Tayron1450.6%new311,5640.7%new43 –52Polestar 21430.6%– 22.3%82,1741.0%– 39.6%29953BMW i51420.6%+ 173.1%671,2690.6%+ 127.0%548254Audi A61410.6%– 37.9%331,4070.6%– 16.8%473555Cupra Leon1390.6%– 15.8%611,0770.5%+ 36.7%647556Mercedes GLC1390.6%– 27.6%491,3300.6%– 6.9%504457Skoda Superb1360.6%– 2.9%451,1710.5%+ 22.5%596058BMW i41260.5%+ 46.5%701,1600.5%+ 3.4%605559VW Taigo1220.5%+ 258.8%511,0630.5%+ 22.6%656860Lynk & Co 081210.5%new1002360.1%new162 –61BMW X11180.5%+ 21.6%781,1570.5%– 23.0%614662Tesla Model Y1160.5%– 88.7%24,7942.1%– 67.3%4163Lexus NX1090.5%– 33.5%541,0060.4%+ 3.2%716364Mercedes EQE1090.5%– 18.0%751,1400.5%– 18.0%624265Renault 51080.4%new409840.4%new72 –66Ford Transit1060.4%+ 523.5%1246720.3%+ 95.3%9013467VW ID.Buzz1060.4%+ 253.3%817700.3%+ 102.6%8212268Audi Q6 e-Tron1020.4%– 48.0%841,2500.5%+ 155.6%558369Kia Ceed1000.4%– 81.4%522,6491.2%– 31.7%21870Ford Explorer990.4%+ 371.4%956290.3%+ 451.8%9418571VW Golf930.4%– 64.9%902,3391.0%+ 0.7%272372BMW 3-Series920.4%– 39.1%551,2290.5%+ 1.2%564773Mercedes GLE920.4%+ 46.0%601,0360.5%+ 15.2%666774BMW 1-Series910.4%– 15.0%566940.3%+ 31.9%879575Audi Q5900.4%+ 47.5%636880.3%+ 13.9%887976BMW X5900.4%– 15.9%699010.4%– 8.6%766177Opel Mokka850.4%+ 4.9%829430.4%+ 5.7%747278Mazda 6e830.3%new1191460.1%new185 –79Zeekr 7X830.3%new745980.3%new97 –80Kia Sorento820.3%+ 30.2%717130.3%– 10.7%867881Mercedes C Class820.3%– 57.9%641,0120.4%– 29.7%694382Skoda Fabia800.3%+ 77.8%997890.3%– 25.8%795983Audi Q3790.3%– 49.7%891,0200.4%– 14.4%685384Hyundai Tucson790.3%+ 83.7%917980.3%+ 66.9%7810185Kia Stonic790.3%+ 41.1%854230.2%– 35.9%1218686Seat Arona790.3%– 15.1%1067610.3%– 42.2%835087VW Multivan770.3%+ 305.3%1107710.3%+ 81.4%8112788Mazda CX-60760.3%– 36.1%966070.3%– 23.4%967389Skoda Kamiq750.3%– 32.4%869830.4%– 6.1%736290Cupra Ateca730.3%+ 73.8%1882410.1%– 22.8%16111891Mini Aceman730.3%new944260.2%new12027292Kia Picanto720.3%– 5.3%1294420.2%– 29.7%1188593Opel Frontera710.3%new1092630.1%new149 –94Opel Grandland X630.3%+ 34.0%1323790.2%– 40.1%1279195Cupra Formentor620.3%– 77.9%876710.3%– 43.3%915296Polestar 3610.3%– 56.7%1044970.2%+ 20.0%11010397Porsche Cayenne610.3%– 17.6%737720.3%– 32.8%805698Mini Hatch600.2%+ 27.7%765150.2%+ 30.1%10710299Dacia Duster590.2%+ 391.7%1117250.3%+ 32.3%8493100Porsche Macan580.2%– 71.6%688360.4%+ 43.6%7781101Xpeng G6580.2%– 9.4%1014840.2%+ 222.7%113172102Mercedes Sprinter570.2%+ 0.0%1036220.3%+ 4.9%9590103Hyundai i10560.2%+ 330.8%595170.2%+ 25.8%106124104Peugeot 208550.2%– 1.8%1155880.3%+ 122.7%99147105Lexus ES/IS/LS/RC520.2%+ 173.7%1122870.1%+ 15.7%145161106Lynk & Co 01520.2%+ 44.4%1185850.3%– 36.8%10071107BYD Seal U510.2%+ 96.2%935700.2%+ 603.7%103198108Nissan Juke500.2%– 3.8%1084110.2%+ 4.8%122115109BMW iX480.2%+ 4.3%925710.3%+ 49.1%102110110Suzuki Swift480.2%+ 11.6%983000.1%– 23.9%142120111Mercedes GLB470.2%+ 6.8%884570.2%+ 1.6%117109112Opel Corsa470.2%+ 14.6%1842590.1%+ 83.7%151182113Skoda Karoq460.2%– 6.1%975900.3%+ 53.2%98113114Mercedes A Class440.2%+ 450.0%1353740.2%+ 73.1%128168115Toyota Aygo X430.2%+ 19.4%1223470.2%– 6.2%132125116Xpeng G9430.2%+ 38.7%1362650.1%– 30.3%148116117Mercedes GLA420.2%– 8.7%1024590.2%– 16.5%11694118Renault 4420.2%new105990.0%new208 –119Renault Scenic420.2%– 25.0%806670.3%+ 120.9%92106120Hyundai Ioniq 9410.2%new192860.0%new214 –121Mercedes GLS400.2%+ 90.5%1602530.1%– 12.5%153154122MG 3400.2%+ 73.9%1711950.1%+ 87.5%171205123Citroen C3 Aircross350.1%+ 52.2%723310.1%– 25.6%134121124Nissan Ariya350.1%– 61.1%1557190.3%+ 104.8%85114125Mazda CX-80330.1%– 64.1%1134390.2%+ 377.2%119180126Mercedes V Class320.1%+ 18.5%1443160.1%– 12.0%137130127VW Caddy320.1%– 13.5%1173280.1%– 12.1%135123128VW Crafter320.1%+ 52.4%1732430.1%+ 6.6%159159129BMW IX2290.1%+ 26.1%1453130.1%– 9.3%138140130Range Rover 290.1%+ 52.6%1382780.1%+ 48.7%146173131Seat Leon290.1%– 68.1%1215280.2%– 31.7%10580132Subaru Outback290.1%– 93.5%2281,6990.7%– 34.0%3919133Citroen C4280.1%– 17.6%795040.2%– 11.9%10892134Audi Q2270.1%+ 17.4%1432480.1%– 65.3%15684135Lexus LBX270.1%– 30.8%833830.2%+ 56.3%126149136Fiat 600260.1%+ 160.0%1272420.1%+ 250.7%160211137Mercedes Citan260.1%+ 550.0%1591840.1%+ 18.7%175189138Mini Countryman260.1%– 42.2%1413490.2%+ 15.2%131135139Audi Q8250.1%– 57.6%1314940.2%+ 30.0%112112140Dacia Jogger250.1%– 46.8%1742190.1%– 9.5%166133141Porsche 911240.1%+ 50.0%1204980.2%+ 11.9%109111142VW T-Cross 240.1%– 64.7%1076400.3%– 37.1%9364143Hyundai Kona230.1%– 45.2%1234960.2%+ 0.4%111107144Suzuki Vitara230.1%– 28.1%1163630.2%– 5.5%129119145VW Caravelle230.1%– 28.1%1401530.1%– 52.2%183144146Hyundai Santa Fe220.1%– 67.6%1582480.1%+ 45.0%157178147Mitsubishi Outlander220.1%n/a1141160.1%n/a203 –148Honda HR-V210.1%+ 0.0%1501950.1%+ 23.4%170175149Ford Capri200.1%new1641670.1%new178234150Dacia Bigster190.1%new206870.0%new211 –151Ford Transit Custom190.1%+ 18.8%1391970.1%+ 347.7%169233152Lynk & Co 02190.1%new1512490.1%new155 –153VW Touran190.1%– 45.7%1303320.1%+ 225.5%133190154Ford Puma 170.1%+ 112.5%1343060.1%– 29.5%140126155Ford Tourneo Custom170.1%– 72.6%1802880.1%+ 2.5%143148156Nissan X-Trail170.1%– 58.5%1612470.1%– 19.8%158138157Renault Captur170.1%– 66.7%1253580.2%– 35.8%13088158Subaru Crosstrek170.1%– 79.0%1933870.2%+ 4.9%125108159Audi Q7160.1%– 62.8%1492330.1%+ 25.3%164165160Lexus RX160.1%– 11.1%1651560.1%– 21.6%180170161Mercedes CLE160.1%– 69.2%1462880.1%+ 11.6%144153162Ford Kuga150.1%– 76.2%1286720.3%– 38.6%8957163Lexus UX 150.1%+ 7.1%1891410.1%– 6.6%188188164Porsche Taycan150.1%– 40.0%1331340.1%– 39.6%191155165Zeekr 001150.1%– 58.3%1951630.1%– 54.8%179105166Honda Civic140.1%+ 600.0%1681010.0%– 11.4%206203167Honda Jazz140.1%– 12.5%1691410.1%+ 6.8%187195168Honda ZR-V140.1%+ 40.0%181650.0%– 14.5%224219169Polestar YSM140.1%new1981300.1%new194 –170VW Touareg140.1%– 57.6%1532110.1%– 34.5%168139171Citroen C3130.1%+ 44.4%2121260.1%– 60.3%195156172Mercedes G Class130.1%– 69.0%1772140.1%+ 31.3%167171173Renault Rafale130.1%new1851910.1%new173229174Tesla Model 3 130.1%– 90.8%141,0120.4%– 65.1%7013175BMW 2-Series120.0%– 75.0%1564680.2%– 1.9%114100176Mercedes EQS120.0%+ 9.1%1831780.1%+ 147.2%177209177Porsche Panamera120.0%– 33.3%1661370.1%– 16.0%190181178Renault Trafic120.0%+ 300.0%162860.0%– 35.3%215183179Audi A1110.0%– 52.2%1482350.1%– 26.1%163132180Hyundai i20110.0%+ 22.2%1371830.1%– 18.7%176167181Hyundai Ioniq 5110.0%– 45.0%1872660.1%– 23.6%147137182Subaru Forester110.0%– 78.8%2185750.3%+ 31.0%10198183Hyundai Bayon100.0%+ 25.0%2001430.1%– 50.0%186158184Land Rover Defender100.0%+ 66.7%1701220.1%+ 31.2%197204185Mercedes Vito100.0%– 47.4%1781940.1%+ 2.1%172177186MG HS100.0%– 79.2%1762520.1%– 18.2%154143187Suzuki S-Cross100.0%– 52.4%1521230.1%– 73.7%196117188Alfa Romeo Junior90.0%new210730.0%new221 –189BMW X690.0%+ 28.6%246320.0%– 44.8%245225190BYD Dolphin90.0%– 67.9%201860.0%– 62.6%213160191Honda CR-V90.0%– 59.1%2142570.1%+ 104.0%152196192NIO ET590.0%+ 350.0%147770.0%+ 413.3%219285193Opel Astra90.0%– 55.0%216760.0%– 77.4%220150194Seat Ibiza90.0%+ 350.0%208400.0%– 75.0%237192195Lexus RZ80.0%n/a1751390.1%+ 208.9%189235196Mazda280.0%– 74.2%1631200.1%– 57.6%201151197VW ID.580.0%– 76.5%243560.0%– 80.8%230141198Cupra Tavascan70.0%– 87.0%1261,0240.4%+ 894.2%67136199Land Rover Discovery Sport70.0%n/a –150.0%– 25.0%275275200Peugeot Boxer70.0%+ 250.0%260280.0%– 15.2%249254201Suzuki Swace70.0%– 78.1%2191210.1%– 20.4%198191202DS 760.0%+ 500.0%222380.0%+ 111.1%238281203Ford Tourneo Connect60.0%– 70.0% –990.0%+ 47.8%207217204Toyota bZ4X60.0%– 90.5%1865300.2%+ 11.8%10499205BMW X750.0%– 76.2%1571200.1%– 33.7%199179206BMW XM50.0%+ 25.0%211190.0%– 53.7%266247207Mazda CX-3050.0%– 91.4%1541890.1%– 38.4%174142208Mercedes CL class50.0%+ 400.0%202560.0%– 23.3%229221209MG S5 EV50.0%new172490.0%new235 –210Toyota Proace Verso50.0%– 64.3%1941060.0%– 47.3%204166211Xpeng P750.0%+ 400.0%221190.0%– 13.6%268277212BMW 4-Series40.0%+ 33.3%196580.0%– 50.0%227202213Citroen Jumper40.0%+ 0.0%213690.0%– 17.9%223208214Hyundai Inster40.0%new1821050.0%new205 –215Jeep Avenger40.0%+ 300.0%223820.0%+ 256.5%216241216Peugeot Expert40.0%+ 300.0%240380.0%+ 40.7%239274217Range Rover Evoque40.0%+ 33.3%199530.0%+ 32.5%232245218Renault Clio40.0%– 93.2%1423220.1%– 55.6%13674219Tesla Model S40.0%+ 100.0% –150.0%– 70.0%278231220Zeekr X40.0%– 96.5%2293070.1%– 7.5%13997221Audi e-Tron GT30.0%– 50.0%190240.0%– 20.0%253262222BMW X230.0%+ 0.0%231230.0%+ 27.8%255284223BYD Tang30.0%– 40.0%233220.0%– 26.7%258248224Mercedes AMG GT30.0%– 80.0%2261300.1%+ 7.4%193194225Peugeot 30830.0%– 78.6%1971500.1%– 71.4%184104226Smart #330.0%+ 0.0%241200.0%– 25.9%265260227Smart #530.0%new263220.0%new261 –228Toyota Land Cruiser30.0%– 80.0%220340.0%+ 112.5%243213229BMW IX320.0%new –20.0%new345 –230BMW Z420.0%+ 100.0% –160.0%– 38.5%271266231Citroen Spacetourer20.0%n/a –60.0%n/a312 –232Ferrari 29620.0%+ 100.0%249160.0%– 42.9%272268233Hyundai i3020.0%n/a2071170.1%– 12.0%202199234Ineos Grenadier20.0%– 33.3%254640.0%+ 20.8%225227235Lamborghini Urus20.0%+ 100.0% –260.0%+ 44.4%252283236Lotus Eletre20.0%– 71.4%256220.0%– 29.0%259259237MAN SKÅP20.0%+ 100.0%238100.0%+ 900.0%291302238Maserati20.0%n/a239100.0%– 23.1%292291239Mazda320.0%– 50.0%225610.0%– 21.8%226214240Nissan Primastar20.0%+ 100.0% –240.0%– 44.2%254243241Porsche 71820.0%– 90.0%203870.0%– 66.0%212163242Range Rover Velar20.0%n/a217290.0%– 17.1%247257243Subaru Solterra20.0%– 71.4%2421330.1%– 20.4%192187244Alpine A11010.0%n/a –70.0%+ 40.0%304313245Audi A710.0%– 83.3%244200.0%– 57.4%263239246BYD Atto 310.0%– 50.0% –20.0%– 99.3%338157247BYD Seal10.0%– 50.0%232720.0%– 21.7%222212248Citroen Berlingo10.0%n/a –30.0%– 82.4%327288249Citroen Jumpy10.0%n/a –10.0%+ 0.0%353345250Ferrari10.0%+ 0.0% –170.0%+ 6.3%270290251Ferrari Purosangue10.0%+ 0.0% –110.0%+ 57.1%286304252Ford Bronco10.0%+ 0.0%25160.0%– 14.3%314311253Ford Courier10.0%– 66.7% –1200.1%+ 122.2%200232254Ford Mustang Mach-E10.0%– 90.9% –940.0%– 62.1%209164255Ford Tourneo Courier10.0%n/a –30.0%n/a328 –256Honda E:NY110.0%+ 0.0%191230.0%– 93.2%256152257Hongqi EHS7 10.0%new25350.0%new318 –258Iveco Daily10.0%– 50.0%255160.0%– 5.9%273282259Lamborghini10.0%– 50.0%236100.0%– 58.3%290276260Land Rover Discovery10.0%n/a224120.0%+ 1100.0%284323261Lexus UX EV10.0%– 50.0% –150.0%+ 200.0%276320262Lotus Emeya10.0%n/a257110.0%+ 450.0%287315263Man Chassi Husbil10.0%– 66.7%237190.0%– 24.0%267261264MG 410.0%– 98.7% –4070.2%– 64.0%12365265Mitsubishi ASX10.0%– 90.0%259780.0%– 43.9%218186266Renault Austral10.0%– 96.9%1673030.1%– 44.4%14196267Renault Espace10.0%– 92.9%204230.0%– 60.3%257226268Renault Master10.0%– 95.0% –2610.1%– 10.0%150146269Smart #110.0%– 80.0%262150.0%– 21.1%277244270Toyota Supra10.0%n/a20990.0%+ 80.0%299321
Source: Mobility Sweden


More Stories
UK February 2026: Best February in 22 years, Ford Puma smashes share record
The Ford Puma holds a record 3.6% of the UK market in February. The UK new car market is up...
Canada February 2026: bZ4X is Toyota’s best-seller
The bZ4X is Toyota’s most popular model in Canada in February. Local consultancy DesRosiers Automotive has the Canadian new light...
Czechia February 2026: Skoda holds 39.1% share, Jaecoo 7 up to #11
Omoda/Jaecoo breaks into the Top 10 brands in Czechia in February. The Czech new car market advances 4.6% year-on-year in...
Brazil February 2026: BYD breaks share record, places Dolphin Mini at #11
The BYD Dolphin Mini is up to #11 in Brazil in February. 177,076 new light vehicles found a buyer in...
Hungary February 2026: Suzuki S-Cross, Vitara reclaim top spots
The Suzuki S-Cross is the best-selling vehicle in Hungary in February. New passenger car sales in Hungary edge up 1.5%...
Poland February 2026: Omoda C5 breaks into Top 10
The Omoda C5 is among the 10 most popular models in Poland in February. 47,466 new cars hit Polish roads...