
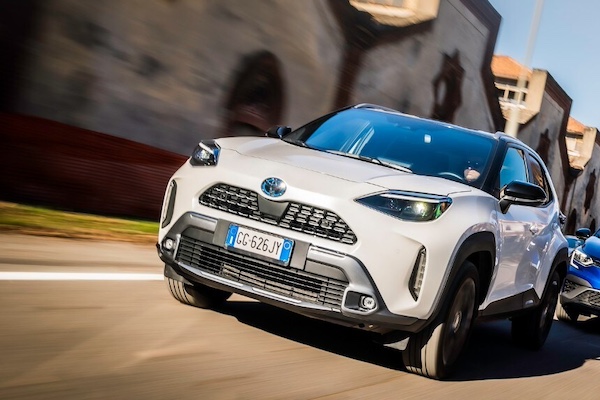
Italy October 2025: Toyota Yaris Cross reaches record ranking at #2
Toyota Yaris Cross sales are up 26.4% in October.
The Italian new car market is back in negative in October at -0.6% to 125,826. The year-to-date tally is now down -2.7% to 1,293,366. This is off 332,000 or -20.4% on pre-pandemic 2019. Once again private sales are weak at -12.2% to 72,494 and 56.9% vs. 64.4% in October 2024 (53.2% vs. 57.7% YTD), whereas self registrations soar 37.7% to 17,520 and 13.7% share vs. 9.9% a year ago (11.7% vs. 11.3% YTD), both signs of an unhealthy market. Long term leases are up 15.5% to 27,132 and 21.3% share vs. 18.3% last year (23.1% vs. 19.8% YTD), short term rentals grow 39% to 2,112 and 1.7% vs. 1.2% and company sales edge up 2.9% to 8,173 and 6.4% share vs. 6.2%.
In terms of power source, petrol sinks -17.6% to 29.122 and 22.9% share vs. 27.5% in October 2024 (25.1% vs. 29.2% YTD), diesel implodes -29.6% to 11,790 and 9.3% share vs. 13.1% last year (9.6% vs. 14% YTD), LPG is up 4.6% to 12,316 and 9.7% share vs. 9.2% a year ago (9.3% vs. 9.4% YTD). HEVs grow 5.6% to 58,038 and 45.5% share vs. 42.8% a year ago (44.7% vs. 39.9% YTD). This includes 17,850 full hybrids (+2.9%) and 40,188 mild hybrids (+6.9%). PHEVs soar 124.9% to 9,833 and 7.7% share vs. 3.4% last year (6.1% vs. 3.3% YTD) and BEVs gain 25% to 6,331 and 5% share vs. 4% a year ago (5.2% vs. 4% YTD). All in all, rechargeable cars are up 71.2% to 16,164 and 12.7% share vs. 7.4% in October 2024 (11.3% vs. 7.3% YTD).
In the brands ranking, Fiat (+26.1%) recovers from a particularly poor year-ago result when it ranked #3 with 7.3% share. It is now at 9.2% vs. 9.6% through October. Toyota (+0.8%) also defies the negative market to lift to 8.5% share in 2nd place. Leader a year ago, Volkswagen (-10.6%) drops to #3 ahead of Dacia (-1.8%), BMW (-2.6%) – ranking at a record #5 for the 4th month running – and Renault (-14.9%), all in difficulty. Audi (+1.1%) edges up at #7 whereas Peugeot (-23.2%) and Jeep (-22.1%) struggle and Mercedes (-4.9%) disappoints. Citroen (+50.3%), MG (+12.8%) and Skoda (+8.8%) shine below. Notice also Omoda+Jaecoo up 280.7%, BYD up 262.7% and Tesla down -47.1%.
Over in the models charts, the Fiat Panda (+6.2%) edges up but stays well below its YTD level at 5.9% share vs. of 6.9% through October. The Toyota Yaris Cross (+26.4%) cracks the podium for the 2nd time ever and breaks its ranking record to #2 (previous best #3 in March 2023). The Jeep Avenger (-11.7%) and Dacia Sandero (-18.6%) are both in pain but still manage solid shares at 3.2% both vs. 3.3% YTD. The Citroen C3 (+44.5%) is back up to #5, followed by the VW T-Roc (+35%) and Dacia Duster (+19.5%) both in excellent shape. The MG ZS is up 23.4% to return inside the Top 10 at #10. After cracking the Top 10 for the first time last month at #8, the Fiat Grande Panda seems to have peaked already, back down to #16 for the month. It however breaks into the YTD Top 50 at #46. It’s a first Top 50 finish for the Opel Frontera, surging directly to #34.
Previous month: Italy September 2025: Fiat Grande Panda breaks into Top 10
One year ago: Italy October 2024: Fiat not #1 for third straight month
Full October 2025 Top 51 brands and Top 50 models below.
Italy October 2025 – brands:
PosBrandOct-25%/24Sep2025%/24PosFY241Fiat11,5969.2%+ 26.1%1123,7309.6%– 4.0%112Toyota10,7158.5%+ 0.8%2101,0637.8%– 1.4%223Volkswagen9,7747.8%– 10.6%394,6167.3%– 5.7%334Dacia7,5706.0%– 1.8%483,1366.4%+ 1.4%445BMW6,2725.0%– 2.6%561,5934.8%+ 2.9%776Renault6,0124.8%– 14.9%963,2724.9%– 13.8%657Audi5,4684.3%+ 1.1%657,6934.5%– 2.5%8108Peugeot5,3044.2%– 23.2%867,4595.2%+ 0.3%569Mercedes4,9053.9%– 4.9%1045,3523.5%+ 5.8%121210Jeep4,7383.8%– 22.1%755,0074.3%– 7.4%9911Citroen4,4003.5%+ 50.3%1447,6643.7%– 1.4%111112Ford3,9183.1%– 33.3%1153,8704.2%– 8.8%10813MG3,8853.1%+ 12.8%1542,9913.3%+ 29.2%131614Hyundai3,8533.1%– 13.8%1339,5573.1%– 6.6%141315Skoda3,8203.0%+ 8.8%1632,3852.5%+ 2.9%171716Kia3,8053.0%– 9.3%1237,5422.9%– 8.8%151417Opel3,7923.0%+ 2.7%1833,2022.6%– 15.0%161518Suzuki2,4451.9%– 26.9%1726,9822.1%– 16.0%191819Alfa Romeo2,2251.8%+ 22.9%1924,6851.9%+ 34.1%202120Nissan2,1221.7%– 9.2%2127,5052.1%– 8.6%181921Cupra2,0311.6%+ 53.9%2217,9971.4%+ 32.7%212422BYD1,8681.5%+ 262.7%2016,7431.3%+ 959.0%223723Omoda+Jaecoo1,8351.5%+ 280.7%2311,0820.9%+ 782.3%263824DR Motor1,7621.4%+ 1.7%2415,5051.2%+ 0.3%232325Mini1,7231.4%+ 53.8%2512,9161.0%+ 24.3%242726Volvo1,2621.0%– 23.8%2711,6700.9%– 28.5%252227Honda1,0070.8%+ 58.6%288,0450.6%+ 27.2%303128Mazda1,0020.8%– 24.9%298,8050.7%– 26.2%282629Lancia9370.7%+ 16.4%308,2630.6%– 73.1%292030EVO7440.6%+ 13.9%315,5120.4%+ 2.1%343231Lexus6400.5%+ 4.7%335,4630.4%+ 9.4%353332Porsche6300.5%– 24.1%345,7000.4%– 18.3%333033Seat5740.5%– 24.5%326,8640.5%– 32.9%312834Land Rover4510.4%– 18.6%365,9550.5%– 26.8%322935EMC3600.3%+ 151.7%372,4670.2%+ 127.6%384136DS3270.3%– 18.3%354,1470.3%– 7.6%363437Leapmotor2880.2%+ 176.9%n/a2,8640.2%+ 1888.9%37n/a38Tesla2560.2%– 47.1%269,0470.7%– 32.9%272539Sportequipe2510.2%+ 660.6%391,7620.1%+ 124.7%404340Subaru1910.2%– 3.0%382,0910.2%+ 62.3%394041DFSK1250.1%+ 101.6%419560.1%+ 125.5%43n/a42Maserati1140.1%– 38.0%401,5190.1%– 24.5%413943Lynk & Co840.1%+ 71.4%464450.0%– 52.7%484244Ferrari600.0%– 11.8%436990.1%+ 1.5%444545Polestar410.0%+ 64.0%424070.0%+ 73.9%494946Lamborghini330.0%– 44.1%455020.0%+ 11.6%474647Mitsubishi270.0%– 86.6%471,2820.1%– 55.0%423548Smart240.0%– 72.7%446700.1%– 73.6%453649Lotus160.0%– 56.8%482140.0%– 30.3%514850Aston Martin50.0%– 58.3%50860.0%+ 0.0%535151Mahindra10.0%– 92.3%496650.1%+ 244.6%4650 –Others5380.4%+ 352.1% –3,2880.3%+ 231.1% – –
Italy October 2025 – models:
PosModelOct-25%/24Sep2025%/24PosFY241Fiat Panda7,4865.9%+ 6.2%189,4406.9%+ 0.8%112Toyota Yaris Cross4,1893.3%+ 26.4%431,0522.4%– 1.2%553Jeep Avenger4,0463.2%– 11.7%242,3043.3%+ 21.9%334Dacia Sandero4,0293.2%– 18.6%342,6733.3%– 17.5%225Citroen C33,0282.4%+ 44.5%933,7632.6%+ 6.6%446Toyota Yaris2,9272.3%+ 6.2%529,0722.2%+ 9.7%787VW T-Roc2,7332.2%+ 35.0%722,7091.8%– 10.0%12118Dacia Duster2,5552.0%+ 19.5%631,0352.4%+ 25.3%6129Renault Clio2,5402.0%– 19.9%1324,5041.9%– 19.9%10610MG ZS2,3271.8%+ 23.4%1225,3092.0%+ 11.4%91411Renault Captur2,2581.8%– 4.0%1521,4861.7%– 19.7%131012BMW X12,2441.8%+ 17.7%1818,6081.4%+ 6.8%192013Toyota Aygo X2,2411.8%+ 11.5%1019,4651.5%+ 7.7%151914Ford Puma2,1001.7%– 11.9%1422,7811.8%– 4.9%111315VW T-Cross2,0441.6%– 20.9%2218,6151.4%– 6.6%181616Fiat Grande Panda1,9121.5%new88,2480.6%new46 –17VW Tiguan1,8811.5%– 18.2%1120,0671.6%+ 24.6%142118Peugeot 2081,7691.4%– 46.5%1628,2502.2%+ 5.4%8719Kia Sportage1,6321.3%– 26.1%1916,5501.3%– 14.5%201820Fiat 6001,6231.3%+ 32.0%2818,9391.5%+ 266.1%16n/a21Peugeot 30081,3961.1%+ 52.1%2114,0131.1%+ 41.8%233922Audi A31,3411.1%+ 57.4%3113,0341.0%+ 25.1%243723Hyundai Tucson1,3131.0%+ 25.8%3611,1660.9%+ 15.1%323624Mercedes GLA1,3061.0%+ 1.6%2711,0030.9%– 1.2%332925BYD Seal U1,2761.0%+ 322.5%1712,2630.9%+ 2362.4%28n/a26Hyundai i101,2621.0%– 14.3%2512,3821.0%– 8.6%262627Peugeot 20081,2591.0%– 20.5%3316,3761.3%– 20.3%211728VW Golf1,2561.0%– 24.7%2612,0780.9%+ 17.8%293129Opel Corsa1,2491.0%– 53.3%2018,9061.5%– 18.2%171530Alfa Romeo Junior1,1280.9%new3512,2850.9%new27n/a31Kia Picanto1,1250.9%+ 3.3%2411,8300.9%+ 11.5%303432Skoda Kamiq1,1220.9%+ 30.2%439,2890.7%+ 14.0%394933Suzuki Swift1,1080.9%+ 8.7%239,7980.8%+ 17.5%354334Opel Frontera1,0860.9%newn/an/an/anewn/a –35Skoda Fabia1,0590.8%+ 7.1%389,6350.7%+ 20.3%364536MG 39850.8%– 5.3%3911,7490.9%#VALUE!31n/a37Nissan Juke9700.8%– 7.2%4510,1610.8%+ 0.2%343538Cupra Formentor9640.8%+ 18.3%n/an/an/an/an/a4439Lancia Ypsilon9360.7%+ 16.3%n/a8,2600.6%– 73.1%45940Nissan Qashqai9200.7%– 1.8%3014,5031.1%– 9.7%222241Mini Countryman8630.7%n/an/an/an/an/an/an/a42Suzuki Vitara8610.7%– 14.8%378,8420.7%– 5.5%414143BMW Serie 18560.7%– 11.5%428,3370.6%+ 25.3%44n/a44Volvo XC408420.7%– 2.8%n/a7,2210.6%+ 4.5%505045Alfa Romeo Tonale8370.7%– 10.5%299,4250.7%– 24.7%372846Opel Mokka8260.7%n/an/an/an/an/an/an/a47Audi Q58190.7%+ 37.4%326,8060.5%+ 17.1%n/an/a48Mercedes GLC7800.6%+ 14.5%476,7650.5%+ 53.0%n/an/a49Toyota C-HR7750.6%– 50.8%3412,9421.0%– 0.9%252550Audi A17700.6%n/a448,2270.6%n/a47n/an/aFord Kuga7040.6%– 44.0%n/a8,8770.7%– 22.5%4033n/aFord Focus6890.5%– 32.6%n/a9,3430.7%– 6.7%3838n/aBMW X36720.5%+ 48.0%407,6260.6%+ 30.2%49n/an/aDR 5.06290.5%– 28.3%417,9660.6%+ 3.8%4848n/aAudi Q35410.4%– 54.0%n/a8,8220.7%– 42.8%4223n/aFord Tourneo Courier1760.1%– 79.9%n/a8,4570.7%+ 20.1%43n/a
Source: UNRAE

More Stories
Dodge, Ford, and Hyundai Grab the Top 2026 NACTOY Awards
If you’re looking for a quick snapshot of where the market is headed, the North American Car, Truck, and Utility...
Ford’s Mustang Dark Horse SC Teased With Max Verstappen at the Wheel
Ford just let the internet get a peek at its next Mustang temptation, and it happened in a very 2026...
2027 Ford Bronco RTR Wants to Be Your First Real Off Road Toy
Ford is adding a new flavor to the 2027 Bronco menu, and it has a very specific vibe in mind:...
The Electric BMW M3 Is Getting Serious for 2027
BMW has finally started peeling back the camo, at least figuratively, on the long-rumored electric M3. After those heavily disguised...
Honda Base Station Camper Prototype Brings Adventure to Your Everyday SUV
Honda is quietly getting serious about the outdoors, and the Base Station prototype is one of the clearest signs yet....
5 Things to Consider When Buying a Salvaged Truck
Buying a salvaged truck can be a smart move for the right person. The price is often lower than a...