
Slovenia June 2025: Renault Clio and Captur now in the YTD lead
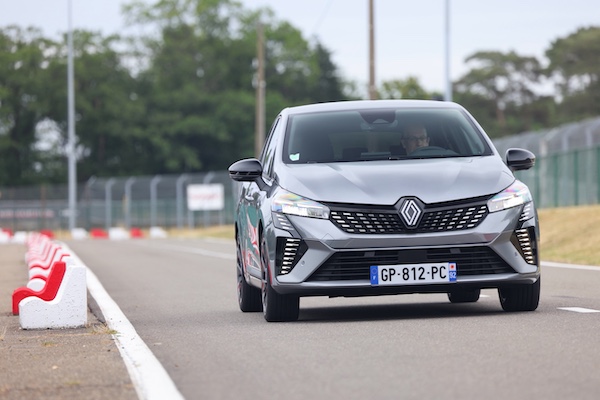
The Renault Clio holds 8% of the Slovenian market in June vs. 4% YTD
The Slovenian new car market is up a sturdy +7.6% year-on-year in June to 5,149 units, leading to a year-to-date tally up 6.3% to 30,132. Renault (+9%) beats the market to reach #1 with a splendid 15.5% share vs. just 10.6% over H1. Volkswagen (+3.7%) is more discreet and drops to #2. Skoda (+35.8%) surges ahead but stays in third place with 10.8% share vs. 11.5% so far this year. Ford (+105.4%) lodges by far the biggest year-on-year gain in the Top 10, with Citroen (+60.2%) and Audi (+9.9%) also in positive. Mercedes (+106.6%), MG (+37.1%) and Tesla (+26.5%) also shine below.
The Renault Clio (+55.6%) is up to 8% share (like at home in France), its highest since January 2023 (8.4%). As a result it reclaims the YTD top spot it held over the Full Year 2024. The Renault Captur (+28.6%) is also very dynamic at #2, a ranking it now also holds YTD, passing the Skoda Octavia (+87.2%). The VW Tiguan (-12.6%) and Skoda Kodiaq (-13.4%) disappoint and round out the Top 5. Excellent scores by the Tesla Model Y (+104%) up 10 spots on May to #6 with 2% share – its best scores since December 2023, the Citroen C3 (+116.3%) and VW T-Roc (+57.6%).
Previous month: Slovenia May 2025: Renault Captur catches up on Skoda Octavia YTD
One year ago: Slovenia June 2024: Renault Clio, Trafic and Captur best-sellers
Full June 2025 Top 43 All brands and Top 251 All models below.
Slovenia June 2025 – brands:
PosBrandJun-25%/24May2025%/24PosFY241Renault79915.5%+ 9.0%23,18710.6%+ 5.0%322Volkswagen73014.2%+ 3.7%14,59115.2%+ 12.9%113Skoda55410.8%+ 35.8%33,46611.5%+ 24.9%234Ford2655.1%+ 105.4%71,4504.8%+ 90.3%7115Toyota2625.1%– 1.9%51,6605.5%– 12.9%546Peugeot2044.0%– 12.8%61,5025.0%– 7.5%657Citroen1813.5%+ 60.2%81,0953.6%– 5.1%9108Hyundai1753.4%– 49.3%41,7145.7%+ 9.1%469Kia1723.3%– 14.4%111,2884.3%+ 3.1%8810Audi1673.2%+ 9.9%101,0603.5%+ 3.9%10911Dacia1663.2%– 15.7%99093.0%– 15.5%11712Mercedes1573.0%+ 106.6%158272.7%+ 28.4%131513Tesla1482.9%+ 26.5%144621.5%– 14.4%171814BMW1352.6%+ 0.0%138562.8%– 2.5%121215Opel1302.5%– 29.0%127582.5%– 10.3%141316Suzuki1102.1%+ 17.0%175581.9%– 24.8%151617MG851.7%+ 37.1%213331.1%– 18.6%212118Nissan841.6%– 2.3%165341.8%+ 11.3%161719Mazda741.4%+ 23.3%184311.4%+ 2.6%182020Seat511.0%– 45.7%203351.1%– 41.1%201921Cupra501.0%+ 78.6%194231.4%+ 60.2%192222Geely440.9%+ 12.8%232140.7%+ 25.9%242323Forthing420.8%+ 82.6%223031.0%+ 791.2%223024Fiat410.8%– 59.8%302090.7%– 65.0%251425Dongfeng360.7%new291450.5%new283726Jeep350.7%+ 75.0%242260.8%+ 9.7%232527KG Mobility290.6%+ 480.0%251830.6%+ 83.0%272928Volvo240.5%– 14.3%271990.7%– 12.3%262429Alfa Romeo220.4%+ 266.7%35920.3%+ 43.8%323230Porsche210.4%– 32.3%261390.5%– 13.1%292631Subaru190.4%+ 375.0%34530.2%+ 253.3%353632Lexus150.3%+ 0.0%321000.3%+ 72.4%303133Mitsubishi140.3%+ 75.0%28870.3%– 25.0%332834Mini120.2%+ 140.0%38520.2%+ 30.0%363435Honda100.2%+ 0.0%31950.3%– 18.8%312736Man80.2%n/a36320.1%+ 966.7%383937Lynk & Co20.0%+ 100.0%40140.0%+ 133.3%393838Land Rover10.0%– 94.1%33620.2%+ 21.6%343339DS10.0%– 66.7%37330.1%– 37.7%373540Alpine10.0%n/a –70.0%+ 133.3%404241Aston Martin10.0%n/a –20.0%n/a454642Lamborghini10.0%n/a –10.0%n/a524343Voyah10.0%new4240.0%new42 – –Others701.4%+ 62.8% –4271.4%+ 46.2% – –
Slovenia June 2025 – models:
PosModelJun-25%/24May2025%/23PosFY241Renault Clio4148.0%+ 55.6%11,2204.0%+ 16.2%112Renault Captur2434.7%+ 28.6%21,1083.7%+ 41.5%233Skoda Octavia2044.0%+ 87.2%31,0843.6%+ 15.2%324VW Tiguan1112.2%– 12.6%46072.0%+ 11.2%795Skoda Kodiaq1032.0%– 13.4%77302.4%+ 19.7%546Tesla Model Y1022.0%+ 104.0%162941.0%+ 14.0%27417VW T-Roc931.8%+ 57.6%125071.7%– 1.9%13148Citroen C3931.8%+ 116.3%65821.9%+ 9.2%8199Dacia Duster921.8%– 10.7%85201.7%– 14.3%11610VW T-Cross841.6%+ 7.7%154961.6%– 9.0%14811Skoda Kamiq831.6%+ 16.9%117852.6%+ 47.6%4712Peugeot 2008771.5%– 9.4%105221.7%– 29.6%10513VW Golf761.5%+ 65.2%176262.1%+ 75.8%61114Ford Tourneo Custom721.4%+ 414.3%193731.2%+ 590.7%198815Nissan Qashqai681.3%+ 1.5%243881.3%+ 11.2%171816Peugeot 208661.3%+ 3.1%185171.7%+ 12.4%121317Toyota Corolla611.2%+ 3.4%253571.2%– 24.2%201618VW Passat591.1%+ 15.7%203061.0%+ 11.7%253119Mazda CX-30571.1%+ 147.8%232790.9%+ 52.5%294320Toyota Yaris Cross561.1%– 52.5%94151.4%– 35.2%151221VW Polo531.0%+ 17.8%212100.7%– 26.1%382722Ford Kuga511.0%+ 0.0%382911.0%– 7.0%282523Kia Ceed511.0%+ 37.8%313211.1%+ 93.4%223324Hyundai Tucson501.0%– 43.8%55751.9%+ 24.7%91025Kia Sportage491.0%– 19.7%283561.2%– 13.2%212026Suzuki Vitara491.0%+ 8.9%302700.9%– 20.4%313027VW Multivan480.9%– 23.8%314031.3%+ 32.6%162328Tesla Model 3460.9%– 31.3%911680.6%– 38.9%483429Skoda Karoq450.9%+ 28.6%332730.9%+ 3.8%302630Renault Austral430.8%+ 48.3%323141.0%+ 5.0%232231Ford Tourneo Courier410.8%– 6.8%353071.0%+ 233.7%244930VW Tayron390.8%new491580.5%new55 –31Toyota Yaris380.7%– 5.0%391490.5%– 41.1%572832Suzuki SX4 S-Cross370.7%+ 94.7%661960.7%– 14.8%394833Forthing T5 Evo360.7%+ 63.6%502600.9%+ 796.6%318534Ford Focus360.7%+ 414.3%541100.4%+ 8.9%778235Opel Grandland X360.7%+ 1700.0%651210.4%+ 505.0%7316436VW Transporter350.7%– 50.7%130810.3%– 58.7%905637Dongfeng Box350.7%new851410.5%new6320338VW Taigo340.7%– 37.0%133751.2%– 19.9%181539Hyundai Kona330.6%+ 57.1%472590.9%+ 14.6%324540Toyota Proace330.6%+ 560.0%581840.6%+ 78.6%416441Skoda Elroq330.6%new431130.4%new76 –42Audi Q3320.6%– 27.3%272650.9%– 6.7%302943VW Touran320.6%– 22.0%302440.8%+ 62.7%333044Kia Stonic320.6%+ 18.5%343031.0%+ 5.2%263145MG 3320.6%new111570.2%new11820746Opel Corsa300.6%– 46.4%262240.7%+ 0.9%353547MG ZS EV300.6%– 18.9%461480.5%– 42.6%583748Skoda Superb300.6%+ 15.4%371250.4%– 6.7%706049Ford Puma300.6%+ 233.3%631200.4%– 15.5%746250Mercedes CLA300.6%+ 328.6%105780.3%– 7.1%9510551Dacia Bigster300.6%new41720.2%new100 –52Opel Mokka290.6%– 32.6%221830.6%– 19.7%424653Skoda Scala290.6%+ 31.8%841420.5%+ 18.3%626354BMW X3290.6%+ 38.1%90740.2%+ 2.8%9710455Renault 5290.6%new101950.3%new8534356Hyundai i20280.5%– 76.7%142100.7%– 30.7%374457Jeep Avenger280.5%+ 115.4%691800.6%+ 21.6%455458Peugeot 3008270.5%+ 17.4%551640.5%+ 115.8%507560Fiat Panda260.5%– 44.7%219540.2%– 80.9%1233261Dacia Sandero250.5%– 67.1%441820.6%– 41.5%431762Seat Leon250.5%– 45.7%831650.5%– 0.6%495863Toyota C-HR250.5%– 7.4%292340.8%+ 14.7%344064Citroen C5 Aircross250.5%+ 108.3%1091000.3%– 7.4%828365Cupra Born240.5%+ 140.0%671910.6%+ 39.4%405066Mercedes GLC240.5%+ 166.7%711620.5%+ 118.9%528467Mercedes GLA240.5%+ 200.0%199790.3%+ 43.6%9410368Toyota bZ4X240.5%+ 2300.0%158560.2%+ 366.7%12019669Peugeot 308230.4%– 50.0%741550.5%– 30.5%564270Audi Q5230.4%+ 27.8%921180.4%+ 37.2%757071Suzuki Swift230.4%+ 35.3%138850.3%+ 26.9%899373Citroen C4210.4%+ 75.0%531370.5%– 16.0%666574Geely Coolray200.4%– 31.0%601300.4%+ 97.0%696775Audi A3200.4%+ 11.1%451370.5%+ 52.2%657676Ford Transit Custom200.4%n/a791800.6%+ 4400.0%4410877BMW 2 Series190.4%+ 280.0%103730.2%– 17.0%999278Mercedes GLB190.4%+ 533.3%231380.1%– 28.3%14612679Hyundai Inster190.4%new133600.2%new114 –80Citroen C3 Aircross170.3%– 45.2%40700.2%– 73.4%1033881Skoda Fabia170.3%– 32.0%571770.6%+ 38.3%465582Renault Megane Conquest170.3%+ 0.0%971320.4%+ 4.8%686883Dacia Jogger170.3%+ 21.4%771070.4%– 9.3%795384Renault Symbioz170.3%new561000.3%new8316085VW Caddy160.3%– 5.9%611230.4%+ 29.5%717486VW ID.4160.3%+ 220.0%481730.6%+ 268.1%4711187KG Mobility Korando160.3%+ 300.0% –720.2%– 22.6%1019688Hyundai Bayon150.3%– 73.2%361610.5%– 35.3%533989Opel Astra150.3%– 60.5%82850.3%– 52.0%886690Seat Arona150.3%+ 0.0%102700.2%– 42.6%1047191Toyota RAV4150.3%+ 36.4%511630.5%– 3.0%515292KG Mobility Torres150.3%+ 1400.0%193680.2%+ 1260.0%10717393Subaru Forester150.3%+ 1400.0%170340.1%+ 1600.0%15524794Mercedes B-Class150.3%n/a1251400.5%+ 141.4%6411495Alfa Romeo Junior150.3%new120660.2%new111 –96Renault Trafic140.3%– 92.9%87990.3%– 78.5%842197Audi Q2140.3%– 51.7%761050.3%– 55.7%813698Audi A6140.3%+ 180.0%88570.2%+ 72.7%11714799Opel Frontera140.3%new73340.1%new153 –100BMW X1130.3%– 31.6%521450.5%+ 90.8%6077101BMW 5 Series130.3%– 7.1%931070.4%+ 42.7%78102102Citroen Berlingo130.3%+ 18.2%621590.5%+ 354.3%5469103Audi A5130.3%n/a861050.3%+ 517.6%80155104Fiat 600130.3%new104800.3%new91215105Kia Xceed120.2%– 67.6%701350.4%– 16.7%6751106Mercedes V-Class120.2%+ 0.0%81650.2%– 7.1%112100107Audi Q4120.2%+ 71.4%95380.1%– 22.4%145125108MG ZS120.2%new –120.0%new217 –109VW ID.7110.2%– 26.7%107900.3%+ 23.3%8791110Lexus LE110.2%+ 57.1%110770.3%+ 175.0%96121111Cupra Tavascan110.2%new98790.3%new92180112Citroen Jumpy110.2%n/a178370.1%+ 3600.0%148317113Hyundai i30100.2%– 73.0%801450.5%+ 0.7%6157114Volvo XC40100.2%– 23.1%172720.2%– 27.3%10281115Audi Q8100.2%+ 25.0%140510.2%+ 0.0%125118116Skoda Enyaq100.2%+ 900.0%146370.1%– 19.6%149131117Geely Starray100.2%new152690.2%new105181118Kia Picanto90.2%– 67.9%123470.2%– 70.3%12761119Hyundai i1090.2%– 35.7%422110.7%+ 59.8%3673120Cupra Formentor90.2%– 25.0%150430.1%– 54.3%13886121BMW 1 Series90.2%+ 200.0%68670.2%+ 179.2%109174122Mitsubishi ASX90.2%+ 200.0%100340.1%– 2.9%152144123Audi Q790.2%+ 800.0%114450.1%+ 462.5%131182124Renault Scenic90.2%+ 800.0%169170.1%– 54.1%194166125Kia EV390.2%new94740.2%new98339126VW ID.380.2%+ 60.0%113580.2%+ 81.3%11689127Nissan Juke80.2%+ 100.0%112510.2%+ 34.2%126127128Audi Q6 e-tron80.2%new108430.1%new136269129Man TGE80.2%n/a124320.1%+ 966.7%156233130Geely EX580.2%new22190.0%new228 –131Porsche Cayenne70.1%– 30.0%168410.1%– 38.8%143116132MG 470.1%+ 0.0%116590.2%– 9.2%11590133Porsche 91170.1%+ 250.0%106460.2%+ 48.4%129156134Mercedes A-Class70.1%+ 600.0%99790.3%+ 132.4%93133135Ford Explorer70.1%n/a181200.1%+ 900.0%183220136Seat Ateca60.1%– 66.7%118420.1%– 61.8%14180137Mercedes C-Class60.1%– 45.5%198250.1%– 32.4%171139138Hyundai Ioniq 560.1%+ 0.0%64550.2%+ 57.1%121138139BMW iX160.1%+ 50.0%89480.2%– 5.9%128120140BMW 3 Series60.1%+ 50.0% –210.1%– 55.3%177122141Peugeot 500860.1%+ 200.0%126680.2%+ 871.4%108149142Renault Rafale60.1%+ 200.0%239350.1%+ 1650.0%151191143Opel Combo60.1%+ 500.0%135440.1%+ 266.7%135162144Cupra Terramar60.1%new96920.3%new86244145Forthing U-Tour60.1%new121420.1%new140195146Geely Cityray60.1%new –60.0%new248 –147Nissan X-Trail 50.1%– 50.0%117690.2%+ 23.2%106119148Mitsubishi Space Star50.1%+ 0.0%144430.1%– 21.8%13995149Mini Cooper50.1%+ 25.0%235230.1%– 14.8%176150150Seat Ibiza50.1%+ 66.7%75560.2%– 28.2%119112151Ford Tourneo Connect50.1%+ 66.7%142250.1%– 13.8%169132152VW California50.1%+ 150.0%173320.1%+ 190.9%159221153BMW M450.1%+ 150.0% –150.0%+ 25.0%201193154Mazda CX-6050.1%+ 400.0%164180.1%– 33.3%189152155Toyota Land Cruiser50.1%n/a171550.2%+ 1275.0%122176156Mazda CX-8050.1%new229200.1%new186245157VW Caravelle50.1%n/a129130.0%n/a211 –158VW Touareg40.1%– 76.5%119670.2%– 17.3%110107159MG HS40.1%– 75.0%201540.2%– 34.9%12487160BMW X540.1%– 50.0%161430.1%– 34.8%137106161Porsche Macan40.1%– 50.0%136320.1%+ 3.2%158154162Audi A140.1%– 42.9%186200.1%– 31.0%182167163BMW X740.1%– 42.9%211140.0%– 50.0%205169164Volvo XC6040.1%– 33.3%139450.1%– 28.6%132110165Kia Proceed40.1%– 20.0%19490.0%– 50.0%230187166Alfa Romeo Tonale40.1%+ 0.0% –80.0%– 81.8%234137167Honda CR-V40.1%+ 33.3%122360.1%– 18.2%150135168Renault Kangoo40.1%+ 33.3% –210.1%– 56.3%181129169BMW i540.1%+ 100.0%190210.1%+ 16.7%178171170Volvo EX3040.1%+ 100.0%243170.1%+ 6.3%195177171Mini Countryman40.1%+ 300.0% –160.1%– 11.1%199175172Mercedes CLE40.1%+ 300.0%23060.0%– 33.3%249208173Hyundai Santa Fe40.1%n/a –200.1%+ 233.3%184172174Mazda CX-530.1%– 84.2%196290.1%– 47.3%164123175Range Rover30.1%– 72.7%145240.1%– 31.4%175153176Mercedes E-Class30.1%– 50.0%165320.1%– 5.9%157134177BMW i430.1%– 40.0%141370.1%– 40.3%147115178BMW X230.1%– 40.0%131250.1%+ 66.7%168188179Subaru Crosstrek30.1%+ 0.0%147130.0%+ 160.0%210237180Toyota Aygo X30.1%+ 50.0%148270.1%+ 68.8%166189181Alfa Romeo Stelvio30.1%+ 200.0%205140.0%– 12.5%204179182BMW M530.1%new149160.1%new197270183Honda Jazz30.1%n/a182130.0%+ 85.7%208213184Mini Aceman30.1%new184130.0%new209290185Audi RS330.1%n/a187110.0%+ 450.0%218272186Peugeot Expert30.1%n/a –110.0%+ 450.0%219263187Ford Capri30.1%new180100.0%new223 –188KG Mobility Rexton30.1%n/a22690.0%– 10.0%229217189Jeep Wrangler30.1%n/a –70.0%n/a243274190Volvo V9030.1%n/a24670.0%+ 133.3%244265191Mercedes Citan Tourer30.1%new –30.0%new263 –192Peugeot Rifter20.0%– 83.3%127340.1%+ 47.8%154141193BMW X420.0%– 83.3%160240.1%– 66.2%173109194Lexus NX20.0%– 75.0%227150.0%– 34.8%203158195Mercedes AMG/GT20.0%– 71.4%197410.1%+ 57.7%142159196BMW M220.0%– 60.0%210120.0%– 36.8%213194197Nissan Townstar20.0%– 50.0%134240.1%– 14.3%174151198Honda Civic20.0%– 50.0%162210.1%– 38.2%180148199Jeep Renegade20.0%– 50.0%225200.1%– 13.0%185178200BMW M320.0%– 50.0%176180.1%– 37.9%188157201Mazda320.0%– 33.3%115440.1%– 6.4%134124202Kia Sorento20.0%– 33.3%163120.0%– 52.0%215168203Dacia Spring20.0%+ 0.0%216280.1%– 15.2%165136204Renault Espace20.0%+ 0.0%157250.1%– 28.6%172145205Mercedes Sprinter20.0%+ 0.0% –80.0%– 11.1%238229206Fiat Ducato20.0%+ 0.0% –60.0%– 45.5%247230207Kia EV920.0%+ 0.0% –30.0%+ 0.0%262279208Toyota Highlander20.0%+ 100.0%242180.1%+ 0.0%191186209Kia Niro20.0%+ 100.0%154150.0%+ 275.0%202240210BMW iX220.0%+ 100.0% –120.0%+ 140.0%207236211Lynk & Co 0120.0%+ 100.0%228120.0%+ 100.0%216219212BMW XM20.0%+ 100.0%212100.0%+ 66.7%222224213KG Mobility Tivoli20.0%new143300.1%new160225214BMW 7 Series20.0%n/a18990.0%– 25.0%227212215Lexus UX20.0%n/a19580.0%+ 100.0%236249216Porsche Taycan20.0%n/a20380.0%+ 60.0%239226217Renault Megane10.0%– 95.5%137190.1%– 82.4%18794218Mazda210.0%– 92.3%183390.1%– 62.5%14479219Volvo XC9010.0%– 83.3%128450.1%+ 21.6%133140220Porsche 718/Boxster10.0%– 83.3% –20.0%– 86.7%276200221BMW X610.0%– 80.0%177260.1%– 29.7%167143222DS 710.0%– 66.7%132290.1%– 12.1%162146223VW Crafter10.0%– 66.7%185170.1%+ 70.0%196223224Jeep Compass10.0%– 66.7%153160.1%– 54.3%198142225BMW IX10.0%– 50.0%175140.0%+ 40.0%179216226Mercedes GLE10.0%– 50.0%200180.1%– 33.3%190161227Hyundai Ioniq 610.0%– 50.0%192120.0%– 20.0%214183228Citroen C4 X10.0%– 50.0%21580.0%– 68.0%235170229Land Rover Defender10.0%+ 0.0%155290.1%+ 262.5%163190230Honda HR-V10.0%+ 0.0%222250.1%+ 108.3%170165231Audi S310.0%+ 0.0%20790.0%+ 350.0%226252232Audi RS610.0%+ 0.0% –70.0%+ 40.0%242264233Volvo V6010.0%+ 0.0%24560.0%– 14.3%250227234Audi RS Q810.0%+ 0.0% –50.0%+ 150.0%252282235Mazda MX-510.0%+ 0.0% –20.0%+ 0.0%274304236Mercedes GLS10.0%n/a23290.0%+ 50.0%231248237Subaru Outback10.0%n/a20490.0%+ 80.0%232254238Mercedes G-Class10.0%n/a16680.0%+ 0.0%237253239Alpine A29010.0%new –60.0%new246 –240Volvo EX9010.0%new24450.0%new253 –241Mercedes EQA10.0%n/a –40.0%– 20.0%256246242Jeep Grand Cherokee10.0%n/a –30.0%n/a261330243Mercedes EQS10.0%n/a –30.0%+ 200.0%264296244Suzuki Swace10.0%n/a –30.0%– 40.0%265266245Audi A810.0%n/a –20.0%+ 100.0%272284246Dongfeng Shine E310.0%new –20.0%new273 –247Nissan Ariya10.0%n/a23620.0%– 60.0%275256248Voyah Courage10.0%new24720.0%new277 –249Aston Martin DB1210.0%new –10.0%new294332250Audi SQ6 e-tron10.0%new –10.0%new295–251Lamborghini Urus10.0%n/a –10.0%+ 0.0%296288
Source: ADS SLO
More Stories
One of One Corvette ZR1X Stars and Steel Heads to Barrett-Jackson for Charity
GM is kicking off 2026 with a very Corvette way to nod at America’s 250th birthday, and it involves a...
Porsche Sets a US Sales Record in 2025 by Just 52 Cars
Porsche doesn’t need a blowout win to celebrate. In 2025, Porsche Cars North America edged out its previous annual sales...
Which Suzuki SUV is Right for Your Lifestyle? | Quiz
Looking for your ideal SUV? Whether you're a city slicker, an outdoor adventurer, or the family’s go-to driver, there's a...
Mexico Full Year 2025: Nissan Versa signs 9th win in past 10 years, Chevrolet Aveo up to #2
This content is for members only. Visit the site and log in/register to read.
Pakistan Full Year 2025: Suzuki Alto celebrates 6 straight years at #1, sales up 40.5%
This content is for members only. Visit the site and log in/register to read.
Luxembourg Full Year 2025: VW and BMW on top, Ford up 67.4%
This content is for members only. Visit the site and log in/register to read.