
Mexico June 2025: Ram (+93.7%) highlights negative market
Mexican Ram sales almost double year-on-year in June.
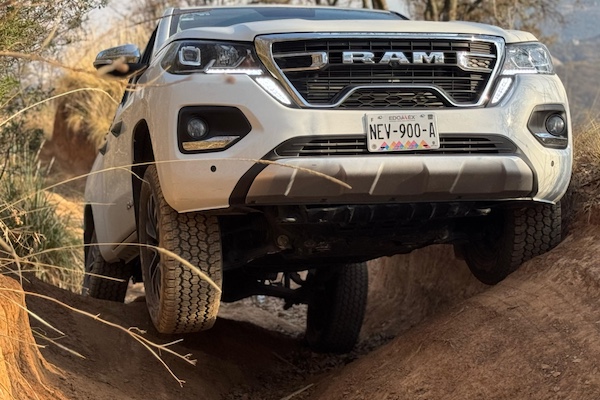
New light vehicle sales in Mexico drop -5.7% year-on-year in June to 116,062 units, meaning the H1 2025 tally is stable at -0.1% to 709,424. Nissan is also stable at a dominant 18.2% share, vastly outclassing #2 Chevrolet (-13.4%), in trouble. Volkswagen (-1.9%) overtakes Toyota (-2.6%) for third place with Kia (+5.7%) in solid shape rounding out the Top 5. Once again Ram (+93.7%) is the best performer in the Top 10, with all additional models in negative. Ram benefits from the success of smaller pickups such as the 700 (aka Fiat Strada) and 1200 (aka Peugeot Landtrek and Fiat Titano, pictured). Mazda (-21.4%) and MG (-10.7%) are hit the hardest while Ford (-0.2%) and Hyundai (-2.2%) minimise their loss. Further down, Changan (+215.8%) and Mitsubishi (+35.8%) stand out.
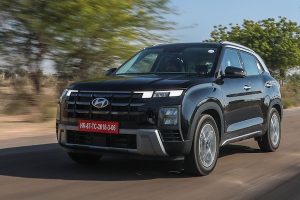
Model-wise, the Nissan Versa (-20.2%) is still the best-seller despite a harsh year-on-year drop to 5.5% share vs. 6.1% so far this year. The Kia K3 (+21.3%) is up two spots on last month to land at #2 for the second time in the past three months. The Nissan NP300 (-5.9%) stays in third place while the Chevrolet Aveo (-7.8%) is down two ranks to #4. The Nissan March (-12.4%) closes out the Top 5 like last month and YTD. Excellent showings for the Hyundai Grand i10 (+38.1%), Nissan Sentra (+23.5%) and VW Saveiro (+18.5%) in the remainder of the Top 10. The Nissan Magnite (#22) is the best selling recent launch above the Kia K4 (#31) and Mitsubishi Outlander Sport (#52).
Previous month: Mexico May 2025: Ram up 79.2%, Nissan Magnite instant blockbuster
One year ago: Mexico June 2024: Mazda (+63.7%) surges, sales at best in 7 years
Full June 2025 Top 50 All brands and Top 374 All models below.
Mexico June 2025 – brands:
Note Chirey group has stopped communicating sales data for Mexico.
PosBrandJun-25%/24May2025%/24PosFY241Nissan21,15318.2%+ 0.0%1128,28318.1%+ 5.2%112Chevrolet13,58411.7%– 13.4%287,71512.4%– 6.2%223Volkswagen10,4719.0%– 1.9%464,5939.1%+ 1.7%334Toyota10,1628.8%– 2.6%360,2608.5%+ 3.8%445Kia9,4108.1%+ 5.7%552,9427.5%+ 3.9%556Mazda7,1266.1%– 21.4%649,9097.0%+ 12.4%667Ford4,4973.9%– 0.2%825,4883.6%+ 0.1%798Hyundai 4,3183.7%– 2.2%725,2403.6%+ 1.6%889MG3,6653.2%– 10.7%923,2043.3%– 5.3%9710Ram3,1542.7%+ 93.7%1017,4782.5%+ 52.7%121311Suzuki3,1512.7%– 1.3%1119,8022.8%– 6.6%101012Honda2,7652.4%– 12.4%1218,7382.6%– 8.5%111113Renault2,7192.3%– 2.3%1414,8832.1%+ 3.3%131214Mitsubishi2,6112.2%+ 35.8%1313,9792.0%+ 20.9%141515JAC2,0441.8%– 2.8%1512,0701.7%+ 1.9%151416Changan1,6011.4%+ 215.8%177,3421.0%+ 133.3%192817Peugeot1,4481.2%– 17.3%168,8761.3%+ 3.2%161918BMW1,3521.2%– 3.4%187,3221.0%+ 3.7%202219Seat1,2211.1%– 30.8%198,4321.2%– 19.8%171620Jeep1,1461.0%– 31.0%207,3691.0%– 27.0%181821Mercedes1,0890.9%– 3.4%235,7200.8%– 7.6%222322GWM1,0390.9%– 20.1%217,1651.0%+ 9.5%212123Audi7920.7%– 10.6%224,2430.6%– 22.6%242424Dodge6280.5%– 41.5%244,7150.7%– 44.9%232025GMC6230.5%– 7.7%254,0350.6%+ 0.4%252626Volvo5140.4%– 48.8%263,1260.4%– 3.6%272727Isuzu4710.4%+ 150.5%381,2060.2%+ 11.4%373728Cupra4270.4%+ 24.1%341,5620.2%– 22.2%343029Buick3990.3%+ 43.0%301,8510.3%+ 15.3%303230Mini3460.3%+ 26.7%281,9140.3%+ 12.9%293331Subaru3000.3%+ 31.6%291,8200.3%+ 17.7%313132Fiat 2890.2%– 69.4%272,6990.4%– 59.7%282533Porsche2810.2%+ 27.7%311,6570.2%+ 38.3%333634Lexus2660.2%+ 3.5%331,3200.2%– 0.4%353535Land Rover1850.2%+ 12.1%351,0640.1%+ 24.0%383936Lincoln1660.1%+ 33.9%371,0390.1%+ 20.7%393837Foton1390.1%– 32.2%321,2670.2%+ 34.5%364238Cadillac1300.1%+ 26.2%361,0000.1%+ 69.8%404339BAIC1070.1%– 7.0%394640.1%– 50.4%434140JMC790.1%– 45.9%404660.1%– 44.1%424041Infiniti470.0%– 19.0%414800.1%– 15.9%414442Acura460.0%– 37.0%423760.1%– 23.3%444643DFSK380.0%+ 35.7%441710.0%– 38.9%484844Deepal240.0%new431860.0%new46 –45Alfa Romeo220.0%– 38.9%461220.0%– 52.0%494746IM100.0%new45360.0%new50 –47Auteco30.0%+ 50.0% –210.0%+ 600.0%51n/a48Bentley20.0%+ 0.0% –20.0%– 60.0%545149Seres10.0%– 75.0%47120.0%+ 200.0%525050Jaguar00.0%– 100.0% –50.0%– 90.2%5349
Mexico June 2025 – models:
PosModelJun-25%/24May2025%/24PosFY241Nissan Versa6,3685.5%– 20.2%143,1666.1%– 2.8%112Kia K34,9094.2%+ 21.3%427,1173.8%+ 4.4%443Nissan Pickup (NP300)4,4093.8%– 5.9%328,3094.0%+ 1.2%324Chevrolet Aveo4,2973.7%– 7.8%229,1624.1%+ 8.0%235Nissan March2,2692.0%– 12.4%515,4412.2%+ 7.8%566Hyundai Grand i102,1261.8%+ 38.1%1211,1161.6%+ 22.6%9157Nissan Sentra2,0791.8%+ 23.5%810,3781.5%– 2.3%13108Mazda CX-301,9851.7%+ 0.9%712,9101.8%+ 17.6%799Nissan Kicks1,9051.6%– 0.3%1012,9281.8%+ 14.3%61110VW Saveiro1,7711.5%+ 18.5%248,0351.1%+ 11.0%232911VW Jetta1,7701.5%– 2.6%1810,7711.5%+ 25.5%111612Nissan X-Trail1,7561.5%+ 48.2%167,5541.1%+ 0.2%262713Chevrolet Tornado Van1,7531.5%+ 2.9%179,2341.3%+ 16.1%191914Chevrolet S101,7461.5%– 0.7%238,8561.2%+ 21.5%212415Toyota Hilux1,6351.4%– 15.0%199,6521.4%– 18.7%171316Mazda21,6251.4%– 9.2%612,6731.8%+ 45.8%81217VW Taos1,6041.4%+ 8.7%219,5511.3%+ 4.8%181418Renault Kwid1,5481.3%– 36.0%317,6981.1%– 8.3%242019Ford F-Series/Lobo1,5251.3%+ 20.8%266,8951.0%+ 13.6%323420Mitsubishi L2001,4541.3%+ 24.1%226,9671.0%+ 21.0%303821Mazda31,4301.2%– 45.1%1510,8951.5%– 12.4%10822Nissan Magnite1,4151.2%new115,2320.7%new40 –23VW Virtus1,4101.2%– 22.3%2810,6991.5%– 20.2%12524Toyota RAV41,3861.2%– 10.9%149,7611.4%+ 28.8%152625MG GT1,3641.2%+ 1504.7%462,5830.4%+ 119.6%7110626Hyundai Creta1,3281.1%– 0.1%138,9631.3%+ 12.3%201727Ram 7001,3221.1%+ 373.8%257,5661.1%+ 59.5%254028Kia Seltos1,3121.1%– 3.1%307,0901.0%– 21.5%292229Ram 12001,2651.1%+ 351.8%435,9870.8%+ 1978.8%366730VW Tiguan1,2591.1%+ 32.7%99,6651.4%+ 49.2%163031Kia K41,1131.0%new297,4101.0%new288032Suzuki Swift1,1121.0%+ 23.3%406,1230.9%+ 16.7%343733Chevrolet Captiva1,1000.9%– 9.9%278,5111.2%+ 6.6%222134Toyota Avanza1,0780.9%– 11.1%375,5540.8%+ 7.5%384235Kia Sonet1,0630.9%+ 6.2%336,1590.9%+ 78.5%334336Chevrolet Onix9580.8%– 39.1%356,9291.0%– 20.9%311837VW Taigun9540.8%– 26.2%535,2470.7%– 17.9%392838Mazda CX-59470.8%– 41.5%346,0290.8%– 24.0%352339Chevrolet Groove9260.8%– 11.6%367,4791.1%– 6.1%273240Toyota Yaris9260.8%– 17.5%324,9340.7%– 1.8%443141Ford Territory9220.8%– 22.1%425,7450.8%– 10.7%373342Toyota Tacoma9030.8%+ 22.9%415,0430.7%+ 49.8%435843Toyota Corolla9020.8%– 12.5%395,1900.7%– 18.0%413944Nissan Urvan8050.7%– 19.7%384,1740.6%– 2.2%504545Seat Ibiza7800.7%– 16.8%454,8930.7%+ 0.1%453546Chevrolet Tracker7780.7%– 15.8%563,5830.5%– 31.4%534447Kia Sportage7680.7%+ 41.2%673,3110.5%+ 2.0%586048JAC Frison7580.7%+ 32.5%484,5590.6%+ 12.4%484749Toyota Sienna6830.6%+ 65.8%474,0810.6%+ 26.9%516150Honda CR-V6750.6%– 30.6%495,0990.7%– 11.3%423651MG 56690.6%– 61.0%209,8681.4%– 24.4%14752Mitsubishi Outlander Sport6210.5%new653,1320.4%new6112453Ford Explorer6130.5%+ 706.6%641,9140.3%+ 295.5%7913854Suzuki Jimny6100.5%+ 9.1%543,8710.5%+ 22.6%525755Toyota Raize5590.5%– 44.5%513,3860.5%– 30.2%554956Honda HR-V5540.5%– 14.6%634,3880.6%– 5.3%494657Mazda CX-35530.5%+ 36.9%593,3410.5%+ 220.0%567858Chevrolet Silverado/Cheyenne5370.5%– 54.4%584,6800.7%– 42.7%462559GWM Haval Jolion5240.5%+ 5.6%733,1760.4%+ 3.1%596460Toyota Corolla Cross5240.5%– 7.1%503,4340.5%– 18.3%545561Toyota Camry5030.4%+ 12.3%1531,4150.2%– 2.3%1028462Suzuki Fronx4870.4%+ 334.8%681,9830.3%+ 51.0%7712263MG 34810.4%– 66.3%444,6760.7%+ 111.2%474164VW Polo4770.4%– 10.5%743,1740.4%+ 0.5%606365Honda City4730.4%– 34.2%622,2890.3%– 44.2%735266Isuzu Elf4710.4%+ 150.5%1481,2060.2%+ 11.4%11512367Suzuki Ertiga4530.4%+ 1.8%692,6700.4%– 19.5%686668Honda BR-V4360.4%+ 69.0%662,9480.4%+ 15.4%627069Chevrolet Trax4250.4%– 10.7%612,7890.4%– 3.8%665970Peugeot Rifter4210.4%+ 101.4%521,8720.3%+ 53.4%8110771Ford Ranger4200.4%– 14.5%773,3300.5%+ 2.5%576272Hyundai Tucson3980.3%– 55.4%702,6130.4%– 28.9%695473Hyundai HB203940.3%+ 14.2%961,7950.3%– 42.2%827174MG One3740.3%+ 285.6%2058090.1%– 44.1%14311075VW Teramont3720.3%+ 67.6%712,8010.4%+ 51.5%6510076Dodge Nuevo Attitude3550.3%new722,7840.4%new6711377MG ZS3300.3%+ 7.8%1351,6790.2%– 34.0%875378Peugeot Partner Rapid3260.3%+ 0.0%861,7640.2%+ 243.2%8313179Toyota 4Runner3170.3%new3683180.0%new218 –80Volvo EX303170.3%– 58.6%761,7450.2%+ 11.8%858581Peugeot Partner3100.3%– 19.3%832,0970.3%– 18.8%747982Renault Koleos3030.3%+ 5960.0%2416240.1%– 0.8%16320883Toyota Highlander3030.3%+ 60.3%792,9480.4%+ 70.0%637684Cupra Terramar3020.3%new2463310.0%new216 –85Mitsubishi Xpander3000.3%– 11.5%911,9590.3%– 47.1%786986Ram 1500-40002850.2%– 44.3%812,0020.3%– 50.3%765687Ram DS2810.2%– 41.9%551,7490.2%+ 261.4%8417888JAC 82650.2%new921,1190.2%new12028989Changan CS35 Plus2640.2%+ 125.6%781,4480.2%+ 26.1%9814490Jeep Compass2610.2%– 42.1%1011,5070.2%– 48.0%957391Honda Civic2600.2%+ 20.9%872,0400.3%+ 27.5%7510392Changan Honor S2580.2%new1121,1050.2%new121 –93Dodge Journey2530.2%– 48.3%1071,5090.2%– 56.0%946594VW Crafter2530.2%+ 26.5%1217200.1%– 30.9%15512995Changan Alsvin2520.2%+ 154.5%821,7020.2%+ 195.0%8615796Ford Transit2520.2%– 53.1%602,3930.3%– 1.7%727297Buick Envista2510.2%+ 34.2%1389450.1%+ 24.0%13214898Mazda CX-902500.2%+ 49.7%801,4750.2%+ 73.7%9713499Audi Q32430.2%+ 133.7%981,2410.2%+ 0.1%113105100Chevrolet Montana2430.2%– 19.0%901,6510.2%– 0.4%8895101Mini Cooper2420.2%+ 53.2%931,1530.2%+ 17.2%119149102Jeep Renegade2410.2%– 42.5%841,5560.2%– 46.1%9277103Chevrolet Suburban2390.2%+ 19.5%1221,3710.2%+ 51.2%107147104GWM Poer2320.2%– 33.3%881,8830.3%+ 161.5%80112105JAC 22320.2%new1031,4970.2%new96177106Seat Leon2300.2%– 35.8%1081,6060.2%– 15.8%9092107Mercedes GLC2240.2%– 4.7%1371,2790.2%+ 7.8%110128108JAC 42220.2%new1041,4410.2%new99158109Peugeot 20082180.2%– 43.8%951,6390.2%– 18.9%8983110MG RX52160.2%+ 31.7%1738060.1%– 63.0%14490111Toyota Prius2140.2%n/a572,5980.4%+ 36.4%7075112BMW X32080.2%+ 39.6%1657240.1%– 35.5%154143113Changan Eado Plus2080.2%new1193850.1%new203 –114GMC Sierra2070.2%– 26.3%1001,4270.2%– 21.9%10191115Renault Kardian2010.2%+ 318.8%1181,1920.2%+ 2383.3%116165116Changan CS55 Plus1920.2%+ 82.9%1097890.1%+ 30.0%148168117Jeep Wrangler1920.2%– 19.7%1061,3400.2%– 1.8%108108118Mercedes GLE1850.2%– 16.3%1431,0020.1%+ 11.1%129136119Ford Escape1840.2%– 40.3%1059510.1%– 38.7%130111120Renault Oroch1840.2%+ 72.0%1141,1850.2%– 40.3%11798121Mazda CX-501810.2%– 54.8%991,4090.2%– 19.8%103101122BMW 2 Series1800.2%+ 109.3%1317170.1%+ 32.0%156186123Suzuki Baleno1790.2%– 25.4%1328950.1%– 47.4%13697124Changan New Star Truck1780.2%new2088430.1%new141260125VW Amarok1740.1%– 12.6%1287850.1%– 1.3%149150126Audi A31710.1%+ 27.6%1298840.1%– 21.9%138154127Jeep Commander1710.1%new1301,0860.2%new123248128Toyota Hiace1710.1%+ 37.9%1021,2670.2%+ 47.0%111120129VW Nivus1700.1%+ 38.2%2131,2810.2%– 9.3%109115130Suzuki Ignis1690.1%– 70.6%972,9120.4%– 29.5%6451131Renault Arkana1670.1%new1231,0920.2%new122209132Mitsubishi Mirage G41640.1%– 54.1%891,3830.2%– 21.6%10682133BMW X11610.1%– 44.3%1131,3950.2%+ 34.1%104125134GWM Haval H61610.1%– 49.7%851,3880.2%– 24.3%10594135Mercedes Sprinter1600.1%– 47.4%1411,0460.1%– 35.6%127104136Subaru Crosstrek1580.1%+ 125.7%1448870.1%+ 54.5%137169137Chevrolet Tahoe1560.1%+ 194.3%1469000.1%+ 44.0%134187138Jeep Grand Cherokee1560.1%– 48.9%1151,0820.2%– 37.1%125102139Fiat Pulse1550.1%– 54.7%1161,0850.2%– 48.1%12493140GMC Terrain1520.1%– 5.0%2144800.1%– 57.6%181142141Kia Sorento1500.1%– 34.8%1101,0250.1%– 8.4%128130142Ford Bronco Sport1480.1%– 3.3%1331,2520.2%– 12.9%112118143Ford Maverick1480.1%+ 0.0%1341,4300.2%+ 3.8%100117144Chevrolet Colorado1450.1%– 39.8%1278450.1%– 19.9%140126145JAC Sunray1430.1%– 62.0%1261,0670.2%– 42.7%12699146Honda Odyssey1420.1%– 0.7%1207350.1%+ 8.9%153151147BMW X51320.1%+ 15.8%1177930.1%– 4.6%146160148MG HS/eHS1320.1%– 22.8%751,5530.2%+ 25.6%93121149Changan Hunter1270.1%+ 44.3%1405900.1%+ 107.7%168225150Cupra Formentor1250.1%– 63.7%1241,2310.2%– 38.7%11481151Seat Arona1240.1%– 51.4%1501,1660.2%– 50.3%11888152Renault Duster1230.1%+ 51.9%1397770.1%– 25.1%150155153Chevrolet Traverse1220.1%+ 481.0%1637760.1%+ 210.4%151220154Honda Accord1130.1%+ 73.8%1664360.1%– 14.0%191194155BMW X21120.1%– 30.0%1675580.1%+ 74.9%173193156Honda Pilot1120.1%– 17.6%1258030.1%+ 21.7%145146157VW Caddy1120.1%+ 4.7%1575750.1%+ 20.8%171180158GMC Canyon1100.1%– 9.8%1427140.1%+ 66.4%157163159Ford Expedition1080.1%+ 96.4%1644410.1%+ 51.0%190244160Jeep Gladiator1080.1%– 49.5%1456840.1%– 36.5%159140161VW Golf/GTI1050.1%+ 94.4%948800.1%+ 39.2%139167162Audi Q51000.1%– 63.8%1606540.1%– 41.1%161133163Renault Kangoo980.1%+ 3.2%1119360.1%– 18.7%133114164Subaru Forester960.1%+ 3.2%1615880.1%– 8.8%169162165BMW X6920.1%+ 5.7%1625930.1%+ 33.9%166197166Ford Bronco920.1%– 28.1%1565320.1%– 26.4%177175167BMW 1 Series890.1%+ 61.8%1584670.1%+ 173.1%186259168Foton Tunland890.1%+ 304.5%1515270.1%+ 136.3%179245169Seat Ateca870.1%– 55.8%1597650.1%– 26.1%152132170Volvo XC90860.1%+ 115.0%2422410.0%+ 0.0%237241171Lincoln Nautilus850.1%+ 80.9%1915320.1%+ 31.0%178206172Lexus NX830.1%– 40.3%1774360.1%+ 0.5%192191173JAC 6820.1%new2721990.0%new258316174Porsche Cayenne820.1%+ 24.2%1875470.1%+ 15.4%176198175Porsche Macan810.1%+ 35.0%1784160.1%+ 20.2%194224176Suzuki Grand Vitara800.1%– 75.2%1499480.1%– 53.2%13187177JAC X350790.1%– 24.8%1476100.1%+ 14.4%164181178Mazda BT-50790.1%new2343930.1%new198 –179Nissan Frontier790.1%+ 75.6%1826800.1%– 8.2%160164180Peugeot Manager760.1%– 58.9%1746300.1%– 16.4%162156181Chevrolet Express710.1%+ 222.7%1723050.0%+ 281.3%221274182Mercedes G-Class700.1%+ 268.4%2692320.0%+ 5.0%243257183Mitsubishi Outlander PHEV700.1%+ 118.8%1924800.1%+ 90.5%182227184Ford Mustang690.1%– 30.3%1524620.1%– 18.2%187201185Changan CS75680.1%new2221120.0%new286 –186Renault Stepway680.1%+ 223.8%1554250.1%– 37.3%193204187BMW 3 Series670.1%– 26.4%1753770.1%– 54.6%205161188Mercedes C-Class670.1%+ 36.7%2352680.0%– 21.6%228213189Mercedes GLA660.1%+ 450.0%2312240.0%+ 20.4%247232190Nissan Pathfinder650.1%+ 12.1%1803860.1%– 11.7%201214191Range Rover Sport640.1%+ 42.2%2113860.1%+ 18.4%202239192Mini Countryman630.1%– 36.4%1895230.1%– 13.4%180171193Mazda MX-5610.1%+ 1.7%1843840.1%– 36.7%204174194JMC Vigus600.1%+ 1900.0%2032330.0%– 44.8%242222195Lexus RX600.1%+ 11.1%2362580.0%– 35.0%233212196Fiat Fastback570.0%– 68.2%1864770.1%– 68.2%183135197Mercedes GLB570.0%+ 16.3%2162740.0%– 3.9%226229198Audi Q2560.0%– 60.8%2212600.0%– 54.2%232216199Kia Niro560.0%– 44.0%1694700.1%– 35.4%184176200Suzuki S-Cross560.0%+ 133.3%2513620.1%+ 112.9%208255201BMW X4550.0%– 49.5%1704690.1%– 35.1%185159202Land Rover Defender550.0%+ 34.1%1982890.0%+ 49.0%224254203Audi A1540.0%– 33.3%2292640.0%– 53.0%230207204BMW 4 Series540.0%– 49.1%1833540.0%– 8.3%211211205Buick Encore540.0%+ 42.1%2302520.0%– 21.5%234230206Mercedes A-Class540.0%+ 8.0%2323190.0%– 15.8%217235207Porsche 911540.0%– 18.2%1793600.1%+ 31.9%210238208GMC Acadia520.0%+ 67.7%1715600.1%+ 294.4%172240209Hyundai Santa Fe520.0%– 57.7%2124520.1%+ 59.7%188192210JAC Sei2520.0%– 85.6%2773040.0%– 82.8%222116211BAIC X35510.0%+ 64.5%2151710.0%– 68.2%268228212JAC E10X510.0%– 80.2%1973360.0%– 61.6%215183213Volvo XC60510.0%– 48.0%1545920.1%+ 13.4%167184214Audi Q7500.0%n/a2192500.0%+ 525.0%235297215Cadillac Escalade ESV500.0%+ 56.3%1943880.1%+ 54.0%200264216JAC Traveler500.0%new305600.0%new319 –217Buick Enclave490.0%+ 96.0%1903100.0%+ 47.6%220283218GMC Yukon XL490.0%+ 6.5%1993630.1%+ 27.4%207256219GWM Tank 300480.0%– 41.5%1933450.0%– 12.9%212182220Mercedes CLA480.0%– 52.9%1952850.0%– 42.9%225203221Audi Q8470.0%+ 80.8%2002670.0%+ 221.7%229271222Cadillac Escalade460.0%+ 35.3%2063930.1%+ 105.8%197269223Lincoln Navigator460.0%+ 91.7%1962060.0%+ 57.3%253288224Buick Envision450.0%+ 55.2%2013440.0%+ 10.3%213231225BAIC U5440.0%– 44.3%2242020.0%– 26.5%255218226GWM Ora 03430.0%– 21.8%2652090.0%– 59.6%251210227Peugeot 3008430.0%– 80.2%1855570.1%– 40.7%174153228Peugeot Expert430.0%+ 13.2%2022280.0%– 39.8%245246229JAC X200420.0%– 20.8%2102610.0%– 1.9%231243230Porsche Cayman410.0%+ 95.2%2262020.0%+ 242.4%256302231BMW iX1400.0%+ 1900.0%2861070.0%+ 386.4%290339232Fiat Argo390.0%– 76.2%1765810.1%– 55.0%170137233Changan UNI-K380.0%– 61.2%1813380.0%– 36.3%214188234Chevrolet Blazer380.0%– 45.7%2232360.0%– 33.1%240234235Fiat Mobi380.0%– 82.1%1685550.1%– 61.5%175127236Mercedes E-Class380.0%+ 137.5%2981970.0%+ 159.2%259285237MG 7380.0%new2482080.0%new252320238BMW X7360.0%+ 33.3%2491920.0%+ 42.2%260281239Range Rover Evoque360.0%– 7.7%2332170.0%+ 39.1%249268240Lexus UX340.0%+ 9.7%2522100.0%+ 27.3%250270241GMC Yukon330.0%– 5.7%1883960.1%+ 95.1%196266242Lexus TX330.0%+ 1550.0%2701050.0%– 4.5%291313243GWM Tank 500310.0%new2431640.0%new269358244Mercedes CLE310.0%new2731420.0%new274321245Toyota Tundra300.0%– 68.4%2183660.1%+ 4.9%206196246Mini Aceman290.0%new2401330.0%new277342247BMW iX2280.0%+ 16.7%2841150.0%+ 117.0%284317248JAC J7280.0%– 33.3%2282690.0%– 25.5%227195249Kia Telluride280.0%– 54.8%2252500.0%+ 78.6%236263250Volvo XC40270.0%– 59.7%2603170.0%– 57.7%219170251DFSK E5250.0%+ 25.0%268800.0%– 50.6%302286252Lincoln Corsair250.0%– 44.4%2472260.0%– 11.0%246249253Mercedes GLS250.0%– 37.5%2581890.0%+ 0.0%262265254VW Transporter250.0%– 75.7%2093920.1%– 50.6%199145255Audi A5240.0%– 71.8%2541990.0%– 51.6%257223256Deepal S07240.0%new2171860.0%new263 –257Foton Hi-Van240.0%– 14.3% –1030.0%+ 134.1%293336258Audi Q6 e-Tron220.0%new274780.0%new306 –259Infiniti QX60220.0%– 24.1%2372050.0%– 43.2%254237260BMW iX210.0%– 8.7%285930.0%– 25.0%296292261Toyota Sequoia210.0%+ 16.7%2441390.0%– 7.9%276284262Acura RDX200.0%– 39.4%3081110.0%– 48.4%288252263MG Cyberster200.0%new282360.0%new347 –264Chevrolet Equinox EV190.0%new2531190.0%new281303265JMC Grand Avenue190.0%– 86.7%2272280.0%– 44.5%244202266Renault Master190.0%+ 216.7%2711410.0%+ 487.5%275267267Subaru BRZ190.0%– 40.6%2381300.0%+ 18.2%279295268Volvo C40190.0%– 44.1%2551820.0%+ 7.1%265273269BMW 5 Series180.0%– 35.7%267840.0%+ 3.7%299315270JAC E30X180.0%new3071160.0%new283306271Lexus GX180.0%new2621120.0%new287 –272Range Rover180.0%– 18.2%281710.0%– 28.3%312301273Jeep Wagoneer170.0%– 50.0%2591140.0%– 25.0%285278274Lexus LX170.0%+ 41.7%290880.0%+ 15.8%298318275Mercedes EQB170.0%+ 88.9%321300.0%– 57.7%354338276MG 3 HEV170.0%– 41.4%2643610.1%+ 1144.8%209199277Lexus ES160.0%+ 23.1%287760.0%– 29.0%308299278Chevrolet Blazer EV150.0%new325540.0%new323361279Foton TM 3150.0%– 82.6%1362910.0%– 12.9%223251280Mazda CX-70150.0%– 73.7%2634000.1%+ 284.6%195242281Mercedes EQE SUV150.0%+ 150.0%309690.0%+ 60.5%314335282Porsche Boxster150.0%+ 1400.0%275640.0%+ 2033.3%316367283Subaru Outback150.0%+ 0.0%295970.0%– 32.2%295287284VW ID.4150.0%new –150.0%new377 –285BMW i5140.0%+ 133.3%310530.0%– 5.4%325333286BMW Z4140.0%+ 40.0%276470.0%+ 56.7%333350287Changan CS95140.0%new294280.0%new356 –288Ford Mustang Mach-E140.0%– 12.5%296760.0%+ 5.6%307323289MG RX9140.0%new3232340.0%new241325290Volvo EX90140.0%new257490.0%new330 –291BMW i4130.0%+ 18.2%291790.0%+ 102.6%304334292Cadillac Optiq130.0%new297340.0%new349 –293GMC Hummer EV SUV130.0%new351500.0%new326381294Cadillac XT4120.0%– 52.0%2561080.0%+ 260.0%289309295Mini E120.0%– 7.7%3011020.0%+ 85.5%294294296Subaru Impreza/WRX120.0%– 33.3%2391180.0%+ 59.5%282296297Acura MDX110.0%– 31.3%2891290.0%– 19.9%280279298Alfa Romeo Tonale110.0%– 52.2%279790.0%– 52.4%303275299Chevrolet Corvette110.0%+ 1000.0%293490.0%+ 40.0%328341300Dodge Attitude110.0%– 97.9%2661580.0%– 96.7%27068301Hyundai Elantra110.0%– 91.2%2201910.0%– 57.8%261221302Kia EV6110.0%– 15.4%353420.0%– 33.3%337322303Peugeot E-Partner110.0%+ 266.7%302500.0%+ 117.4%327369304Audi A6100.0%+ 100.0%314570.0%+ 21.3%321328305IM LS7100.0%new250360.0%new346 –306Lincoln Aviator100.0%+ 25.0%300750.0%+ 7.1%310307307Acura ADX90.0%new292750.0%new309 –308DFSK 50090.0%+ 200.0% –370.0%– 31.5%345345309Infiniti QX5090.0%+ 28.6%280630.0%– 11.3%317312310Infiniti QX8090.0%– 10.0%2781300.0%+ 136.4%278305311Audi A780.0%+ 166.7%336260.0%– 42.2%361332312JAC EX45080.0%+ 300.0% –120.0%+ 9.1%381326313Mercedes EQA80.0%+ 166.7%347220.0%– 59.3%367346314Alfa Romeo Stelvio70.0%+ 16.7%330230.0%– 48.9%365347315Audi A470.0%– 72.0%318470.0%– 68.9%332276316BAIC X5570.0%+ 40.0%311400.0%– 61.2%339310317Dodge Durango70.0%– 86.5%2452380.0%– 7.4%238258318GMC Hummer EV Pickup70.0%new342450.0%new335382319Infiniti QX5570.0%– 41.7%313820.0%– 2.4%301304320JAC Sei6 Pro70.0%– 63.2%354250.0%– 85.9%364282321Range Rover Velar70.0%– 56.3%303740.0%+ 25.4%311324322Renault Megane E-Tech70.0%new288220.0%new368 –323Toyota Supra70.0%+ 250.0%364160.0%– 20.0%374373324BMW iX360.0%– 40.0%320330.0%– 48.4%350327325BMW XM60.0%+ 100.0%332310.0%+ 93.8%352368326Hyundai Palisade60.0%– 86.4%299840.0%– 67.9%300261327Porsche Taycan60.0%+ 100.0%338360.0%+ 28.6%348356328Cadillac XT550.0%+ 0.0%312380.0%– 50.0%342319329Chevrolet Cavalier50.0%– 97.6%3171820.0%– 87.6%264119330Foton Miler50.0%– 44.4%322120.0%– 78.6%380330331Land Rover Discovery Sport50.0%+ 150.0%329270.0%+ 12.5%360351332MG 450.0%– 93.3%3061540.0%– 27.4%272247333MG RX850.0%– 86.8%2612370.0%– 43.4%239205334Suzuki Ciaz50.0%– 54.5%326380.0%– 72.7%344293335Acura Integra40.0%– 63.6%315470.0%– 47.2%331308336Alfa Romeo Giulia40.0%– 42.9%346200.0%– 53.5%371353337BAIC EU540.0%new316430.0%new336398338Cadillac Lyriq40.0%– 42.9%352390.0%– 2.5%341340339DFSK 60040.0%+ 0.0%361300.0%– 50.0%353343340JAC Sei7 Pro40.0%– 94.7%337490.0%– 81.8%329253341Lexus IS40.0%+ 0.0%344280.0%+ 12.0%358363342Mercedes EQE40.0%+ 300.0%34990.0%– 18.2%386374343Mercedes EQS40.0%n/a340160.0%+ 166.7%373379344Mercedes S-Class40.0%– 50.0%345210.0%– 51.2%370352345BMW i730.0%new357110.0%new383 –346DFSK EC3530.0%+ 200.0%328270.0%+ 575.0%359389347Foton View30.0%– 93.9%3412190.0%+ 11.2%248311348Hyundai Ioniq 530.0%– 83.3%333260.0%+ 73.3%363359349JAC Sei4 Pro30.0%– 98.7%331700.0%– 95.6%313141350Mercedes AMG GT30.0%+ 200.0% –60.0%– 72.7%392375351Mercedes SL-Class30.0%+ 0.0%355150.0%– 40.0%375365352Mercedes Vito30.0%n/a –420.0%n/a338 –353Acura TLX20.0%– 84.6%339140.0%– 44.0%378366354Auteco E-Van S1.0 T PRO20.0%new –50.0%new394 –355Bentley Bentayga20.0%n/a20.0%n/a406400356BMW 7 Series20.0%– 75.0%327260.0%+ 0.0%362360357Ford E-Transit20.0%– 94.3%204670.0%– 27.2%315200358Foton S320.0%– 80.0% –790.0%+ 0.0%305344359Mercedes EQS SUV20.0%n/a343300.0%+ 36.4%355362360Mitsubishi Montero Sport20.0%– 91.3%304580.0%– 4.9%320314361Nissan Z20.0%– 60.0% –150.0%– 76.2%376337362Porsche Panamera20.0%– 33.3%319320.0%+ 113.3%351357363Auteco Rich 6 EV10.0%new –80.0%new387 –364BAIC BJ4010.0%n/a34880.0%+ 14.3%388385365BMW 8 Series10.0%n/a –40.0%+ 33.3%397394366Dodge Challenger10.0%– 88.9% –30.0%– 96.2%399331367Dodge Charger10.0%n/a334230.0%– 43.9%366233368Foton TM EV10.0%+ 0.0%36560.0%– 25.0%390383369Lexus LS10.0%n/a10.0%+ 0.0%419401370Mercedes EQC10.0%n/a36030.0%+ 200.0%400371371Nissan Altima10.0%– 93.3%335190.0%– 90.9%372290372Ram ProMaster10.0%– 97.0%3241740.0%– 38.5%267173373Renault Logan10.0%n/a2837910.1%+ 69.4%147226374Seres 5 Max10.0%– 75.0%356110.0%+ 175.0%384386
Source: INEGI

More Stories
How Mechanical Design Influences the Feel of a Vehicle
You know that feeling. You slide into the driver’s seat. You press the start button. The vehicle comes alive. It...
Competition Time. Chance to win a Smallest Cog goodies bundle.
The Smallest Cog Unveils Exciting New Merchandise Range Inspired by Richard Hammond’s iconic restoration workshop, The Smallest Cog’s exclusive new...
Florida Tolls Could Vanish for Residents as Tourists Pick Up the Tab
Florida drivers may eventually cruise the Turnpike without paying a cent at the toll gantries if a new idea from...
Extending Vehicle Lifespan Through Proven Engine Technology
We all want our cars to last. A vehicle is a major investment. It gets us to work. It takes...
China retail November 2025: Fang Cheng Bao, Lynk & Co hit all-time highs, market off -16.8% on high year ago basis
This content is for members only. Visit the site and log in/register to read.
China imports November 2025: Market down -20%, BMW 7 Series (+88.9%) and 2 Series (+53.8%) shoot up
This content is for members only. Visit the site and log in/register to read.