
Netherlands June 2025: Renault signs first victory in 7 years, Tesla Model Y #1
Renault is the #1 carmaker in the Netherlands for the first time since August 2018.
New car sales in the Netherlands edge down -1.5% year-on-year in June to 34,641, leading to a year-to-date volume off -5.5% to 182,680. At 88,283 registrations, HEVs represent 48.3% of the Dutch market, followed by BEVs at 35% (63,877), petrol at 15% (27,382), diesel at 1.4% (2,556) and LPG at 0.3% (572).
In the brands charts, Renault (+76.4%) delivers a big surprise by snapping the pole position with 8.7% share, upsetting traditional leader Kia (-3.7%) which lurks 19 units behind, also at 8.7% of the market vs. 10.7% over H1. This is the French carmaker’s first podium finish since November 2020 (#2) and first win since August 2018. BMW (+17.1%) and Volkswagen (+31.7%) defy the negative market below, but Toyota (-19.3%), Tesla (-42.3%) and Volvo (-39.4%) all collapse. Audi (+50.7%) and Skoda (+47.1%) surge in the remainder of the Top 10.
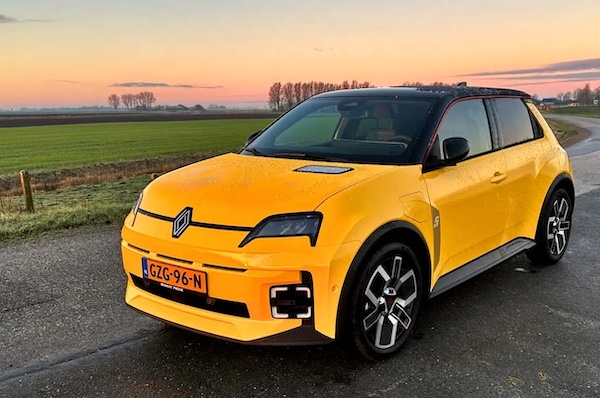
Model-wise, the Tesla Model Y (-29.3%) signs its first win of the year with 3.6% share and despite a drastic year-on-year loss. Leader last month, the new Skoda Elroq now ranks at #2 and climbs yo #5 over H1. The Tesla Model 3 (-55%) freefalls but still rounds out the podium. Three Kias follow: the Picanto (+27.2%) posts a very solid month at #4, the new EV3 is down to #5 but stays in the lead year-to-date and the Niro (-44.1%) implodes at #6. The Volvo XC40 (-14.7%) and Toyota Yaris Cross (-13.5%). Renault places four models inside the Top 20: the Captur (+137.3%) at #9, the Clio (+5.5%) at #15, the new R5 at #17 and the new Symbioz at #18.
Previous month: Netherlands May 2025: Skoda Elroq best-seller
One year ago: Netherlands June 2024: Tesla manages 1-2 with Model Y and Model 3
Full June 2025 Top 60 All brands and Top 326 All models below.
Netherlands June 2025 – brands:
PosBrandJun-25%/24May2025%/24PosFY241Renault3,0248.7%+ 76.4%710,8786.0%+ 31.2%592Kia3,0058.7%– 3.7%119,63210.7%+ 5.0%113BMW2,6517.7%+ 17.1%611,7806.4%+ 9.4%474Volkswagen2,4347.0%+ 31.7%412,5586.9%+ 17.4%355Toyota2,2806.6%– 19.3%312,5956.9%– 24.6%236Skoda2,1996.3%+ 47.1%210,6555.8%+ 6.1%667Tesla2,0025.8%– 42.3%136,8813.8%– 48.8%1348Volvo1,7905.2%– 39.4%510,1835.6%– 42.8%729Audi1,3884.0%+ 50.7%97,4004.1%+ 14.8%111110Ford1,3353.9%+ 4.0%117,8504.3%+ 37.6%101311Mercedes1,2873.7%– 16.4%127,0903.9%– 4.3%121212Peugeot1,2093.5%– 29.3%107,8944.3%– 0.9%91013Hyundai1,0983.2%– 35.0%88,1754.5%– 28.0%8814Dacia8322.4%+ 35.1%173,0281.7%– 6.3%171615Opel7312.1%– 19.4%145,1332.8%+ 18.9%141416Citroen7232.1%+ 117.8%154,2152.3%+ 64.8%152117Suzuki6952.0%– 19.2%163,7682.1%– 20.2%161518Mazda6401.8%– 31.9%263,0081.6%– 22.5%181719Mini4441.3%– 17.6%222,9571.6%+ 38.1%191820Polestar4341.3%+ 53.9%321,1770.6%+ 24.2%303021Nissan4231.2%+ 18.8%182,6151.4%– 20.3%202022BYD4121.2%+ 83.9%231,7561.0%+ 47.2%252423MG4071.2%+ 208.3%201,2820.7%+ 37.6%282924Lynk & Co3881.1%+ 121.7%211,3950.8%+ 1.8%273125Seat3761.1%– 27.4%192,3971.3%– 21.3%211926Cupra3451.0%+ 128.5%241,8821.0%+ 102.8%242827Mitsubishi2880.8%– 38.1%272,1851.2%– 15.9%222228Land Rover2210.6%– 7.9%301,9751.1%+ 9.1%232529Jeep1930.6%+ 1.6%281,1980.7%– 32.2%292630Porsche1800.5%– 30.5%291,6010.9%+ 5.2%262731Zeekr1500.4%+ 120.6%315600.3%+ 45.8%333632Fiat1360.4%– 71.5%259900.5%– 64.7%312333Lexus870.3%+ 38.1%356340.3%+ 47.1%323434Honda860.2%+ 0.0%364730.3%– 26.4%363335Alfa Romeo790.2%+ 49.1%345200.3%+ 200.6%353836Leapmotor750.2%new383280.2%new385037Xpeng670.2%– 31.6%335320.3%+ 15.2%343238Smart300.1%– 53.1%372470.1%– 32.1%393539Dongfeng280.1%new453430.2%new374240DS260.1%– 67.1%392020.1%– 37.7%403741Bentley220.1%+ 633.3%431290.1%+ 180.4%414542Alpine190.1%+ 375.0%401020.1%+ 500.0%425843Hongqi160.0%– 27.3%51230.0%– 28.1%525244Ferrari120.0%+ 33.3%42770.0%+ 54.0%434345Jaguar120.0%+ 71.4%44500.0%– 26.5%464446Abarth80.0%+ 60.0%49400.0%+ 66.7%475147Lancia70.0%– 22.2%46760.0%+ 744.4%444648NIO70.0%– 50.0%50530.0%– 61.3%453949Lamborghini70.0%+ 16.7%47400.0%+ 25.0%485350Subaru50.0%+ 66.7%57330.0%– 25.0%494951Lotus40.0%– 69.2%55230.0%– 78.3%534152Maserati30.0%+ 50.0%56140.0%+ 0.0%575753Lucid20.0%– 60.0%48280.0%+ 0.0%505454Voyah20.0%+ 0.0%54250.0%+ 108.3%516055SsangYong10.0%n/a52210.0%+ 90.9%544756Aston Martin10.0%– 50.0%58150.0%– 21.1%565557Rolls Royce10.0%– 50.0%53110.0%– 31.3%585958Aiways00.0%n/a41190.0%– 87.3%554059Morgan00.0%– 100.0%5950.0%– 37.5%596160Vinfast00.0%– 100.0% –50.0%– 64.3%6056 –Others3140.9%+ 18.9% –1,9191.1%+ 21.8% – –
Netherlands June 2025 – models:
PosModelJun-25%/24May2025%/24PosFY241Tesla Model Y1,2503.6%– 29.3%43,8282.1%– 52.5%312Skoda Elroq9792.8%new13,2111.8%new5 –3Tesla Model 37492.2%– 55.0%123,0111.6%– 42.4%844Kia Picanto7382.1%+ 27.2%24,1652.3%+ 7.0%265Kia EV36571.9%new36,2743.4%new12356Kia Niro6381.8%– 44.1%63,7052.0%– 41.3%427Volvo XC40/EX405981.7%– 14.7%82,5831.4%– 57.9%1258Toyota Yaris Cross5881.7%– 13.5%53,0121.6%– 19.3%7109Renault Captur5791.7%+ 137.3%181,9971.1%+ 44.0%222910Toyota Aygo X5521.6%– 16.1%73,0561.7%– 30.2%6711BMW iX15191.5%+ 46.2%302,1851.2%+ 54.1%192112Peugeot 2084771.4%– 28.7%372,7081.5%– 22.4%91113Citroen C34391.3%+ 416.5%232,6651.5%+ 199.1%116014VW Tiguan4331.2%+ 659.6%112,2521.2%+ 158.0%182815Renault Clio4251.2%+ 5.5%331,9201.1%– 20.7%241416VW Golf4251.2%+ 367.0%291,6760.9%+ 47.0%293917Renault 54241.2%new471,9141.0%new2517718Renault Symbioz4081.2%new391,1910.7%new4514719Suzuki Swift4031.2%+ 61.2%222,2901.3%+ 93.4%174620Skoda Kodiaq3961.1%+ 80.8%142,7011.5%+ 261.6%102521Toyota Yaris3781.1%– 29.2%92,3871.3%– 29.3%161222Lynk & Co 013741.1%+ 113.7%161,3220.7%– 3.5%397123Ford Kuga3611.0%– 4.7%172,5821.4%+ 55.0%131824BMW X13421.0%+ 9.3%431,2920.7%– 17.0%404425Volvo V603351.0%– 20.0%271,5440.8%– 31.5%332426Ford Focus3240.9%– 42.9%851,2330.7%– 31.5%433027Renault Scenic E-Tech3130.9%+ 23.2%531,0880.6%+ 187.8%535128Kia Sportage3070.9%– 2.5%341,5610.9%– 31.3%322029Audi Q42950.9%+ 28.8%281,7741.0%+ 41.9%271730BMW X32890.8%+ 542.2%687300.4%+ 186.3%8116231Renault Megane E-Tech2840.8%+ 142.7%996680.4%– 32.5%906532Volvo XC602760.8%– 23.1%321,6930.9%– 22.6%282333BYD Seal U2690.8%+ 3262.5%359890.5%+ 1469.8%5612734Kia Ceed2680.8%– 30.2%491,3590.7%– 22.7%372635Hyundai Inster2640.8%new191,9381.1%new2329836BMW 5-Series2630.8%+ 93.4%401,3640.7%+ 102.4%357037Polestar 22560.7%– 3.0%1176810.4%– 26.7%877338Hyundai i102520.7%– 34.5%311,8111.0%– 46.5%261339Peugeot 20082520.7%– 41.3%241,6070.9%– 13.5%311940Opel Corsa2450.7%– 39.8%132,4451.3%+ 25.1%151641Ford Puma2430.7%+ 6.6%251,6070.9%+ 9.0%303542Dacia Jogger2400.7%+ 0.8%628260.5%– 21.6%706243Audi A32310.7%+ 92.5%361,2430.7%– 5.6%425244Renault Austral2280.7%+ 23.2%849360.5%– 10.5%605545Dacia Sandero2270.7%– 9.2%548610.5%– 30.9%654346Hyundai Kona2240.6%– 60.0%212,1031.2%– 40.9%21847Opel Frontera2230.6%new754820.3%new110 –48Ford Explorer EV2200.6%new521,4450.8%new34 –49VW Polo2160.6%– 55.3%152,1131.2%– 10.3%20950BMW 3-Series2150.6%– 29.7%749690.5%– 35.4%574851VW Tayron2150.6%new446850.4%new86 –52Skoda Enyaq2130.6%+ 0.0%389300.5%– 44.1%612253Toyota C-HR2130.6%– 8.2%411,1210.6%– 5.8%493654Kia Stonic2100.6%+ 61.5%581,2520.7%+ 7.1%414255VW ID.72080.6%+ 477.8%937110.4%+ 84.7%829356Skoda Octavia2050.6%– 53.9%511,2130.7%– 62.5%441557Mini1970.6%– 39.6%501,3370.7%+ 2.1%382758Nissan Qashqai1930.6%+ 12.2%661,1650.6%– 26.7%484059Seat Leon1840.5%+ 44.9%598580.5%+ 26.9%669260BMW 1-Series1810.5%+ 4.0%721,0480.6%+ 40.1%557961Peugeot 30081810.5%+ 20.7%671,0900.6%+ 82.9%526762Suzuki Vitara1790.5%– 6.3%789400.5%– 20.3%595863Audi Q6 e-Tron1760.5%new631,3610.7%new3612464Toyota Corolla Cross1680.5%– 25.0%481,1200.6%– 17.3%503165VW ID.31680.5%+ 41.2%801,0680.6%+ 61.1%546366Mazda21670.5%– 51.7%1276670.4%– 43.8%915767Toyota RAV41670.5%+ 63.7%827060.4%+ 2.2%849868Audi A51660.5%+ 418.8%1014740.3%+ 118.4%11416869Mercedes GLC-Class1610.5%+ 49.1%567770.4%– 0.1%768970BMW i41590.5%– 18.0%1068370.5%– 22.8%675471Jeep Avenger1590.5%+ 15.2%608800.5%– 42.2%624572Polestar 41590.5%new1504280.2%new12219073Renault Espace1580.5%+ 12.9%1054670.3%– 18.9%11711074Volvo XC901580.5%+ 58.0%768070.4%+ 18.3%749575Volvo EX301560.5%– 86.7%102,4711.4%– 53.2%14376Volvo EX901530.4%new795310.3%new10527377Audi A6 E-tron1490.4%new457550.4%new79 –78Hyundai Tucson1480.4%– 66.0%649480.5%– 48.9%583379VW T-Cross1470.4%– 35.0%717750.4%– 8.1%775680Dacia Spring1450.4%+ 383.3%1904380.2%– 7.2%1209681Seat Ibiza1430.4%– 25.5%651,0930.6%– 7.0%514982Mercedes A-Class1400.4%– 50.4%967570.4%– 19.3%787583Mazda CX-51390.4%– 37.9%2118640.5%– 17.4%646684MG 41360.4%+ 166.7%1462920.2%– 40.0%14910085Toyota Corolla1350.4%– 47.1%837000.4%– 46.8%855386Citroen C3 Aircross1320.4%+ 50.0%614670.3%+ 21.9%11516987Peugeot 3081300.4%– 65.4%201,1820.6%– 8.3%465088Peugeot 50081290.4%+ 416.0%738130.4%+ 129.7%7311789VW ID.41290.4%– 32.1%868230.5%+ 52.4%717490Mercedes C-Class1280.4%+ 3.2%1035970.3%+ 1.7%9610991Mini Aceman1270.4%new978350.5%new6918992Dacia Duster1260.4%+ 28.6%907080.4%+ 54.2%836893MG ZS1240.4%+ 726.7%954330.2%+ 207.1%12118094Skoda Kamiq1230.4%– 41.1%558690.5%– 21.9%634195Mercedes GLA-Class1210.3%+ 80.6%1343910.2%+ 32.5%12915096Mini Countryman1200.3%– 42.9%1367850.4%+ 29.3%756497Mercedes CLA-Class1190.3%– 55.4%916800.4%– 19.9%889098BMW i51180.3%– 30.2%1205530.3%– 5.8%1028299Opel Mokka1170.3%+ 41.0%1215660.3%– 4.9%10197100Mercedes EQB1160.3%+ 19.6%1047480.4%+ 18.9%8069101VW T-Roc1130.3%– 51.9%778160.4%– 46.7%7232102Nissan Ariya1110.3%+ 98.2%463970.2%+ 29.3%126144103BMW 2-Series Gran Coupe1100.3%+ 1471.4%1543720.2%+ 136.9%133174104Skoda Superb1100.3%+ 5.8%924810.3%– 24.7%11194105Renault Arkana1090.3%– 35.1%2023620.2%– 52.1%13683106Cupra Terramar1050.3%new895820.3%new99269107Mazda CX-601040.3%– 6.3%1184670.3%+ 19.4%116141108Mercedes EQA1030.3%– 10.4%886620.4%+ 8.9%9280109Suzuki SX4 S-Cross1010.3%+ 42.3%1144770.3%– 28.3%113108110Nissan Juke1000.3%+ 13.6%1098370.5%– 16.5%6877111Zeekr 7X990.3%new942140.1%new172 –112Kia EV6980.3%– 59.5%576260.3%– 65.6%9538113Mitsubishi ASX970.3%– 40.9%1085930.3%+ 6.8%97113114BMW IX2960.3%+ 0.0%1164830.3%+ 71.3%109122115Mazda CX-30950.3%– 9.5%1314800.3%– 18.1%112101116Dacia Bigster940.3%new1761950.1%new178 –117Cupra Born920.3%+ 76.9%1154130.2%– 22.7%12378118VW Taigo910.3%– 42.8%1103810.2%– 40.8%13061119Mitsubishi Colt890.3%+ 107.0%1486590.4%+ 38.4%93118120Audi A1880.3%+ 3.5%1474050.2%– 20.9%125111121Ford Capri880.3%new1242740.1%new155246122Mitsubishi Outlander860.2%n/a1004910.3%n/a108 –123BMW 2-Series Tourer840.2%+ 154.5%1712640.1%+ 13.3%157163124Audi Q2830.2%+ 84.4%1563660.2%– 8.3%135119125Hyundai i20790.2%– 24.0%1113560.2%– 62.0%13787126Opel Astra790.2%– 68.8%261,1660.6%+ 11.5%4759127Skoda Scala790.2%+ 46.3%1293780.2%– 43.5%13286128BYD Atto 3780.2%– 13.3%1753500.2%– 51.0%13991129Mercedes GLE-Class750.2%+ 56.3%1533010.2%+ 35.6%146166130VW Multivan740.2%– 8.6%1352320.1%– 54.5%167140131Mercedes E-Class730.2%– 16.1%1075520.3%+ 44.1%103116132BMW X5720.2%– 44.6%875710.3%– 9.4%10088133Volvo C40/EC40720.2%– 12.2%1383800.2%– 52.5%13185134Hyundai Ioniq5710.2%+ 108.8%1304460.2%– 4.7%119126135Skoda Fabia710.2%– 56.2%695930.3%– 41.5%9847136Citroen C4 700.2%+ 75.0%1285330.3%– 8.7%104115137Fiat 600700.2%+ 62.8%425000.3%+ 163.2%106139138MG 5700.2%+ 94.4%812310.1%+ 30.5%169193139Alfa Romeo Junior 690.2%new1233930.2%new128238140Mercedes Sprinter670.2%+ 76.3%1263390.2%+ 8.0%143131141VW Passat670.2%+ 19.6%1373680.2%+ 81.3%134130142Audi Q8660.2%+ 214.3%1402920.2%+ 251.8%148165143Mazda3660.2%+ 0.0%1642420.1%– 19.6%164135144Land Rover Defender640.2%+ 42.2%1414530.2%+ 29.8%118142145Range Rover Sport640.2%– 12.3%1256690.4%+ 15.9%89107146Porsche Macan600.2%+ 5900.0%1136280.3%+ 2890.5%94146147Renault 4600.2%new325710.0%new236 –148VW Caddy600.2%+ 5900.0%1651360.1%+ 750.0%198292149BMW iX580.2%+ 314.3%1691400.1%– 19.1%197197150Cupra Tavascan570.2%+ 612.5%1583450.2%+ 4212.5%141205151Porsche Cayenne570.2%– 62.7%1324920.3%– 49.8%10784152Toyota bZ4X520.2%– 25.7%1393960.2%– 5.0%127103153Audi Q5500.1%+ 61.3%1421520.1%– 12.1%192183154Citroen C5 Aircross500.1%+ 31.6%703000.2%– 19.8%147132155Ford Mustang Mach-E500.1%– 45.7%1802430.1%– 31.0%163125156Leapmotor T03490.1%new1912250.1%new170285157Cupra Leon460.1%+ 39.4%1432790.2%+ 73.3%153182158Xpeng G6460.1%new1123560.2%new138154159Cupra Formentor450.1%– 22.4%1662630.1%+ 16.9%158170160Ford Tourneo/Transit Custom450.1%n/a984100.2%+ 20400.0%124247161Fiat Grande Panda430.1%new182740.0%new233 –162Range Rover 430.1%– 24.6%1512900.2%– 26.4%150129163Volvo V90420.1%– 27.6%1591560.1%+ 27.9%190200164Audi A6400.1%+ 14.3%1492140.1%– 18.9%171152165BMW 4-Series400.1%– 29.8%1722340.1%– 19.6%166157166MG 3390.1%+ 143.8%1332510.1%+ 457.8%160159167Porsche 911/Carrera390.1%+ 116.7%1572520.1%+ 2.4%159181168VW ID.BUZZ390.1%+ 225.0%1442010.1%+ 171.6%176229169Opel Grandland X380.1%– 2.6%1193490.2%+ 43.6%140161170Mercedes Vito370.1%+ 27.6%1851880.1%+ 9.9%179192171Kia EV9360.1%– 62.9%1023200.2%– 49.8%145102172Mercedes B-Class360.1%– 39.0%1602360.1%– 34.3%165145173Renault Rafale 340.1%– 15.0%1552470.1%+ 517.5%161186174Honda CR-V330.1%+ 83.3%2201090.1%– 18.7%216213175Lexus LBX310.1%– 27.9%1632850.2%+ 65.7%152134176Mazda CX-80300.1%new2121580.1%new189248177Zeekr X300.1%+ 25.0%1812140.1%+ 65.9%173172178Opel Vivaro290.1%+ 70.6%2441100.1%+ 32.5%214187179Dongfeng Box280.1%new2223430.2%new142245180Honda Jazz270.1%+ 35.0%1831270.1%– 3.8%205204181Kia Sorento270.1%– 12.9%1451840.1%– 8.5%181155182Mazda MX-30270.1%– 57.1%223790.0%– 66.8%229178183Leapmotor C10260.1%new1731030.1%new219339184BMW X2250.1%– 45.7%2391140.1%– 33.7%212184185BYD Seal250.1%– 67.1%2081750.1%– 13.4%184148186Seat Ateca250.1%– 51.9%1222660.1%+ 17.7%156156187Seat Arona240.1%– 73.0%2181800.1%– 34.1%183114188Hyundai Bayon230.1%– 77.0%1931820.1%– 67.3%182112189Mercedes EQE230.1%– 54.0%1941200.1%– 62.1%209158190MG HS230.1%new1611270.1%new206303191Skoda Karoq230.1%– 74.2%1622790.2%– 70.8%15472192Audi Q7220.1%+ 0.0%1891350.1%+ 246.2%199207193VW Touareg210.1%+ 50.0%197750.0%– 38.0%232209194Zeekr 001210.1%– 52.3%1881320.1%– 48.2%201138195BYD Sealion 07200.1%new227430.0%new253338196Land Rover Discovery Sport200.1%– 4.8%2351690.1%+ 13.4%185201197Range Rover Evoque200.1%– 25.9%1962890.2%+ 35.7%151167198Citroen Jumpy190.1%– 72.1%2041430.1%– 20.6%195173199Kia Xceed190.1%– 24.0%279520.0%– 72.3%245188200Polestar 3190.1%+ 5.6%201680.0%+ 277.8%237211201Toyota Proace190.1%– 67.8%329260.0%– 70.1%269242202Xpeng G9190.1%– 79.6%1701590.1%– 63.0%188123203Alpine A290180.1%new179960.1%new222393204BMW XM180.1%– 21.7%2141300.1%+ 1.6%202196205Lexus NX180.1%+ 200.0%1771550.1%+ 118.3%191220206Lexus RX180.1%+ 80.0%236560.0%– 34.1%243233207Peugeot 408180.1%– 64.0%1783380.2%+ 34.7%144153208BMW 7-Series170.0%+ 70.0%250620.0%– 21.5%240241209Hyundai Santa Fe170.0%+ 240.0%2332310.1%+ 140.6%168199210Nissan X-Trail170.0%– 19.0%2071220.1%– 18.7%207194211Bentley Continental160.0%n/a224970.1%+ 438.9%221291212VW California160.0%+ 100.0%186790.0%+ 97.5%230263213DS 3 Crossback150.0%– 63.4%308360.0%– 74.5%261195214Mitsubishi Eclipse Cross150.0%– 85.3%2491970.1%– 59.5%177104215Audi Q3140.0%– 87.4%2191680.1%– 75.4%186106216BMW iX3140.0%– 85.1%2252050.1%– 54.3%175121217Lynk & Co 02140.0%new210730.0%new234 –218Porsche Panamera140.0%– 77.0%2161300.1%+ 38.3%203210219Hyundai Ioniq 6130.0%– 74.5%247790.0%– 79.5%228137220Jeep Renegade130.0%– 38.1%1991150.1%+ 32.2%211226221Honda HR-V120.0%– 40.0%2211520.1%– 18.3%193185222Mazda MX-5120.0%– 47.8%252470.0%– 14.5%249251223Smart #3120.0%– 64.7%2451010.1%– 37.3%220164224Fiat Panda110.0%– 60.7%1981850.1%– 2.6%180176225Lexus UX110.0%+ 266.7%281460.0%+ 48.4%250253226Mercedes G-Class110.0%+ 450.0%2061130.1%+ 841.7%213275227Mercedes GLB110.0%– 21.4%253650.0%– 21.7%239227228Mercedes S-Class110.0%– 47.6%192820.0%– 18.0%226221229Peugeot Expert110.0%+ 450.0%2001100.1%+ 266.7%215268230Smart #1110.0%– 63.3%1741210.1%– 40.4%208143231Suzuki Swace110.0%+ 175.0%257390.0%+ 14.7%259250232BMW 2-Series100.0%+ 42.9%213600.0%– 32.6%241230233BYD Atto 2100.0%new226400.0%new258309234Fiat 500100.0%– 97.5%1522100.1%– 91.1%17437235Hongqi E-HS9100.0%– 54.5%272170.0%– 46.9%296276236Jeep Wrangler100.0%+ 900.0%241430.0%+ 115.0%254294237Range Rover Velar100.0%– 41.2%2171050.1%– 18.6%218214238BYD Dolphin90.0%– 80.9%1871290.1%– 35.2%204136239Mercedes EQV90.0%+ 28.6%243550.0%– 26.7%244240240Peugeot 50890.0%+ 12.5%283320.0%– 59.0%263215241BMW i780.0%– 20.0%269470.0%– 41.3%248232242BMW Z480.0%– 55.6%230430.0%– 38.6%252244243Citroen C4 X80.0%– 38.5%231490.0%– 38.0%246225244Ferrari 29680.0%+ 166.7%271260.0%+ 73.3%268301245Honda Civic 80.0%– 27.3%240410.0%– 51.2%257206246Mercedes EQE SUV80.0%– 85.7%2051680.1%– 39.8%187151247Mercedes EQS SUV80.0%– 38.5%248450.0%– 55.9%251224248Porsche Taycan80.0%– 61.9%237840.0%– 39.6%225198249Alfa Romeo Tonale70.0%– 85.1%1681180.1%– 23.4%210203250Hyundai i3070.0%– 56.3%264810.0%– 28.9%227208251Kia Proceed70.0%– 95.9%2091340.1%– 63.7%200128252Lancia Ypsilon70.0%– 22.2%234760.0%+ 744.4%231255253Lexus RZ70.0%+ 600.0%228710.0%+ 82.1%235256254Mercedes EQS70.0%– 46.2%242360.0%– 36.8%262254255MG S570.0%new –200.0%new283 –256Smart #570.0%new203250.0%new271 –257DS 7 Crossback60.0%– 50.0%1671050.1%+ 22.1%217223258Honda ZR-V60.0%+ 20.0%278420.0%+ 31.3%256270259Hongqi EHS760.0%new –60.0%new335 –260Jeep Compass60.0%– 80.0%1841410.1%+ 6.8%196191261Mercedes CLE-Class60.0%– 72.7%215960.1%+ 11.6%223222262VW Touran60.0%– 33.3%238380.0%+ 153.3%260272263Audi e-Tron GT50.0%+ 25.0%302160.0%– 27.3%299299264DS 450.0%– 79.2%255570.0%– 37.4%242219265Jaguar F-Pace50.0%+ 150.0%232300.0%+ 3.4%264295266MG Cyberster50.0%new275290.0%new266359267Toyota Prius50.0%n/a286430.0%– 44.2%255218268VW ID.550.0%– 70.6%258680.0%– 6.8%238216269Abarth 50040.0%– 20.0% –170.0%– 29.2%294274270Abarth 60040.0%new254230.0%new274 –271Bentley Flying Spur40.0%+ 300.0%303180.0%+ 100.0%289344272Citroen C5 X40.0%n/a260480.0%– 21.3%247243273Jeep Grand Cherokee40.0%n/a291180.0%+ 200.0%291331274Lamborghini Aventador40.0%n/a265170.0%n/a297 –275Alfa Romeo Giulia30.0%– 40.0%29990.0%– 35.7%316315276Audi A430.0%– 97.3% –250.0%– 95.8%270105277Ferrari SF9030.0%+ 0.0%262240.0%+ 71.4%272313278Ford Explorer30.0%– 50.0%263290.0%– 31.0%26576279Jaguar E-Pace30.0%+ 0.0%290130.0%– 45.8%304288280Jaguar F-Type30.0%+ 200.0%31240.0%– 33.3%341353281Mercedes AMG GT30.0%+ 200.0%292160.0%+ 0.0%300319282Mercedes GLS-Class30.0%+ 0.0%293110.0%– 56.0%310297283Mercedes SL-Class30.0%+ 0.0%273180.0%+ 38.5%292321284Mercedes V-Class30.0%+ 200.0%274220.0%+ 22.2%278286285MG Marvel R30.0%+ 200.0%32050.0%– 80.0%337277286Subaru Forester30.0%+ 200.0%328200.0%+ 300.0%280335287Tesla Model X30.0%– 78.6%285240.0%– 63.1%273239288Toyota Proace City Verso30.0%+ 50.0%330200.0%+ 53.8%281329289Bentley Bentayga20.0%+ 0.0%276140.0%– 26.3%302305290BMW X420.0%– 81.8%288180.0%– 45.5%290279291BMW X620.0%– 50.0%289170.0%– 29.2%295281292Lamborghini Revuelto20.0%+ 0.0%280120.0%+ 100.0%308352293Lexus ES20.0%n/a266190.0%– 34.5%287280294Lotus Emira20.0%+ 0.0% –30.0%– 57.1%350347295Lucid Air20.0%– 60.0%251280.0%+ 0.0%267278296Maserati Grecale20.0%n/a31890.0%+ 12.5%318333297Mercedes EQT20.0%n/a –50.0%+ 0.0%336349298Peugeot Rifter20.0%+ 100.0% –100.0%+ 25.0%315308299Voyah Free20.0%+ 0.0%333230.0%+ 109.1%277324300Xpeng P720.0%– 60.0%287170.0%– 46.9%298264301Alpine A11010.0%– 75.0%30060.0%– 64.7%331316302Aston Martin DB1210.0%– 50.0% –60.0%– 60.0%332306303BMW 8-Series10.0%– 83.3%304230.0%– 14.8%275289304BYD Tang10.0%n/a305230.0%+ 475.0%276293305Citroen SpaceTourer10.0%n/a30730.0%n/a348317306Ferrari Roma10.0%– 50.0%27780.0%– 11.1%320330307Fiat Ducato10.0%n/a –20.0%– 83.3%354328308Fiat Scudo10.0%n/a –190.0%+ 171.4%286307309Ford Tourneo/Transit Connect10.0%n/a256130.0%+ 1200.0%303390310Jaguar i-Pace10.0%+ 0.0% –30.0%– 40.0%349350311Lamborghini Urus10.0%– 66.7%31390.0%– 50.0%317300312Lotus Eletre10.0%– 88.9%31480.0%– 91.1%321234313Lotus Emeya10.0%– 50.0%315120.0%+ 33.3%309345314Maserati Levante10.0%+ 0.0% –10.0%– 66.7%382362315Mitsubishi Space Star10.0%– 99.4%3212450.1%– 77.3%16281316NIO EL810.0%new323110.0%new311355317Nissan Leaf10.0%– 94.7% –860.0%– 63.2%224171318Nissan Townstar10.0%new29480.0%new323360319Porsche 718 Boxster10.0%– 50.0%29540.0%– 71.4%345327320Porsche 718 Cayman10.0%– 66.7% –110.0%– 59.3%312296321Renault Megane10.0%– 99.3%32680.0%– 98.2%325149322Rolls Royce Cullinan10.0%n/a –20.0%n/a360379323Ssangyong Torres10.0%n/a284210.0%+ 2000.0%279267324Subaru Legacy/Outback10.0%+ 0.0% –50.0%– 44.4%338341325Subaru Solterra10.0%+ 0.0% –70.0%– 46.2%330332326Suzuki Ignis 10.0%– 99.7%229110.0%– 99.3%31434
Source: BOVAG
More Stories
Serbia November 2025: Skoda Octavia now #1 YTD, Toyota Yaris Cross up to #2
The Toyota Yaris Cross is up to 2nd place in Serbia in November. CE Auto data indicates a Serbian new...
Albania November 2025: BYD monopolises Top 5, holds over 50% share
The BYD Yuan Up is the most popular vehicle in Albania in November. Thanks to our local partner CE Auto...
Moldova November 2025: Jetour X50 up to record third place
The Jetour X50 is up to #3 in Moldova in November. Based on data by our local partner CE Auto, the...
Bosnia & Herzegovina November 2025: Skoda Octavia and Fabia on top
The Skoda Octavia is by far the most popular vehicle in Bosnia & Herzegovina. Data by CE Auto shows a...
Montenegro November 2025: Toyota Yaris snaps up top spot
The Toyota Yaris holds 6.8% of the Montenegrin new car market in November. Based on data by our local partner...
North Macedonia November 2025: Skoda Kamiq and Octavia now equal #1 YTD
The Skoda Kamiq easily wins November in North Macedonia. Data shared with us by our local partner CE Auto, new...