
Brazil June 2025: Volkswagen (+25%), BYD (+53%) strong, VW Tera lands
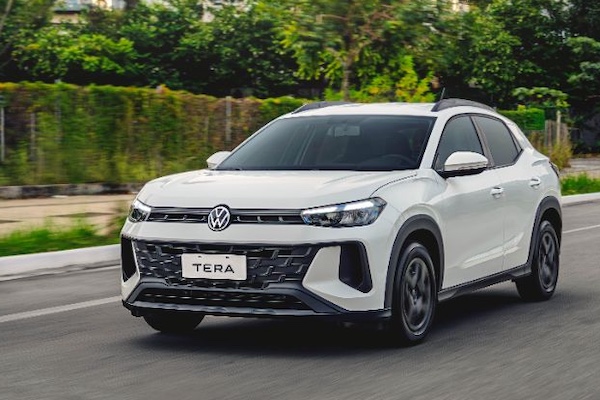
The VW Tera enters the Brazilian Top 30 in June.
201,437 new cars hit Brazilian roads in June, a small -0.5% year-on-year drop. The H1 2025 tally is in positive however at +5% to 1,131,271. Pre-pandemic levels aren’t that far away: the market totalled 1,248,299 sales over H1 2019, or 9% more. Fiat (+8.9%) defies the negative market to 20.8% share, to be compared with 8.3% at home in Italy this month. Volkswagen (+25%) does even better in 2nd place but remains at a fair distance with 18.5% share. In contrast Chevrolet (-23.6%), Hyundai (-16.5%) and Toyota (-14.5%) all struggle to round out the Top 5. BYD (+53%) posts the biggest gain in market once again but falls one spot on last month to #9, a ranking it also holds YTD. Honda (+22.5%) and Renault (+4.9%) are both solid.
Model-wise, the VW Polo (+18.7%) threepeats at #1, but its advantage over the Fiat Strada (+52%) has thawed to just 18 units. The Strada easily remains the leader YTD with 5.6% share vs. 5.1% for the Polo. In fact the Top 5 is unchanged on last month, with the VW T-Cross (+45.4%), Fiat Argo (-2.5%) and Hyundai HB20 (-29.1%) in tow. The Chevrolet Onix (-23.4%) is back up two spots on last month to #6 but freefalls year-on-year. Excellent performances of the Honda HR-V (+43.7%) and Toyota Corolla Cross (+25.9%) to close out the Top 10. The BYD Song Plus (+46.8%) is the best-selling Chinese model at #26. We welcome the arrival of the locally-produced subcompact VW Tera at #29. The Citroen Basalt (#38) is the 2nd ranked recent launch.
Previous month: Brazil May 2025: Market up 16.4%, VW Polo and Honda HR-V shine
One year ago: Brazil June 2024: HB20 pushes Hyundai up 55.5%, VW Polo #1 over H1
Full June 2025 Top 34 All brands and Top 189 All models below.
Brazil June 2025 – brands:
PosBrandJun-25%/24May2025%/24PosFY241Fiat 41,83020.8%+ 8.9%1241,42721.4%+ 9.4%112Volkswagen37,30218.5%+ 25.0%2186,32216.5%+ 11.1%223Chevrolet21,91110.9%– 23.6%3119,77410.6%– 15.2%334Hyundai 16,1868.0%– 16.5%486,1387.6%– 2.0%545Toyota 14,8967.4%– 14.5%588,9627.9%– 3.0%456Renault 10,3995.2%+ 4.9%761,0065.4%+ 9.3%667Honda9,1774.6%+ 22.5%950,6074.5%+ 32.8%888Jeep9,1574.5%– 9.3%855,5664.9%+ 3.3%779BYD8,1634.1%+ 53.0%650,0064.4%+ 53.6%91010Nissan5,1802.6%– 28.4%1134,9963.1%– 16.7%10911Caoa Chery4,7422.4%– 4.5%1028,2552.5%+ 1.0%111112Ford 3,9292.0%– 5.8%1222,3722.0%+ 14.1%121213Citroen 3,4031.7%+ 6.1%1419,6441.7%+ 26.9%131314GWM3,0211.5%+ 10.2%1315,2621.4%+ 19.9%141515Mitsubishi2,5051.2%+ 40.0%1613,3661.2%+ 26.8%161716Ram2,2511.1%– 20.7%1513,6901.2%– 7.1%151417Peugeot1,7650.9%– 32.7%1711,6061.0%– 3.6%171618BMW1,2700.6%– 20.2%187,4520.7%– 2.6%181819Mercedes8750.4%+ 45.8%194,7630.4%+ 34.8%192020Volvo6730.3%– 41.4%204,3500.4%+ 5.6%201921Porsche4690.2%– 23.9%222,8010.2%– 7.7%212122Iveco4220.2%n/a212,1940.2%n/a232523Jaecoo3810.2%new256910.1%new28 –24Audi3160.2%n/a242,3260.2%n/a222225Kia2820.1%n/a231,9750.2%n/a242326Land Rover2660.1%n/a261,6790.1%n/a252427Effa2190.1%n/a271,1220.1%n/a262728Mini1330.1%n/a296500.1%n/a292829Suzuki1140.1%n/a288410.1%n/a272930JAC1100.1%n/a305150.0%n/a302631Foton450.0%n/a35460.0%n/a343532Lexus420.0%n/a314470.0%n/a313033Jaguar20.0%n/a –80.0%n/a423134Subaru10.0%n/a –710.0%n/a3332
Brazil June 2025 – Models:
PosModelJun-25%/24Pos2025%/24PosFY241VW Polo 11,4925.7%+ 18.7%157,2175.1%– 1.1%222Fiat Strada11,4745.7%+ 52.0%262,7035.6%+ 10.8%113VW T-Cross8,6294.3%+ 45.4%344,5323.9%+ 41.3%364Fiat Argo7,2353.6%– 2.5%444,4693.9%+ 12.2%455Hyundai HB206,9173.4%– 29.1%536,8753.3%– 13.6%546Chevrolet Onix6,7823.4%– 23.4%834,3943.0%– 21.1%637Hyundai Creta6,4153.2%+ 9.5%1331,1822.8%+ 2.1%988Fiat Mobi6,3473.2%+ 5.7%633,2312.9%+ 3.1%799Honda HR-V6,1793.1%+ 43.7%732,0042.8%+ 45.8%81710Toyota Corolla Cross5,3352.6%+ 25.9%1130,0912.7%+ 37.8%102111Renault Kwid5,3252.6%+ 17.8%1226,3862.3%+ 2.9%141212Chevrolet Tracker4,9932.5%– 15.6%1927,2432.4%– 5.6%13713Fiat Fastback4,9302.4%+ 38.6%1425,1612.2%+ 15.8%152014VW Saveiro4,8492.4%+ 52.4%1029,1472.6%+ 19.1%111315VW Nivus4,7912.4%– 10.6%1622,6622.0%– 12.4%191416Toyota Hilux4,5762.3%+ 17.5%1723,1522.1%+ 3.9%181917Jeep Compass4,5462.3%+ 14.8%927,5332.4%+ 20.8%121818Fiat Pulse3,8231.9%+ 29.3%2320,2681.8%+ 12.0%222319VW Virtus3,7191.8%+ 45.3%2417,1731.5%+ 14.6%242620Chevrolet Onix Plus3,4941.7%– 46.6%2021,5601.9%– 27.9%201121Fiat Toro3,4141.7%– 28.6%1523,3352.1%+ 0.5%161622Jeep Renegade3,4111.7%– 24.8%2120,6701.8%– 12.0%211523Nissan Kicks3,3941.7%– 27.4%2223,2012.1%– 17.7%171024Toyota Corolla3,0041.5%– 5.8%2518,3991.6%+ 11.5%232425Ford Ranger2,9611.5%– 2.1%3015,9761.4%+ 25.1%252726BYD Song Plus2,8051.4%+ 46.8%279,1040.8%– 9.3%393027Chevrolet S102,6121.3%+ 18.8%2813,7831.2%+ 11.5%293128Chery Tiggo 72,5891.3%+ 38.1%2614,1841.3%+ 50.1%282829VW Tera2,5551.3%new862,7500.2%new64 –30GWM Haval H62,4971.2%+ 16.0%3212,6751.1%+ 40.2%313631Hyundai HB20S2,2411.1%– 40.4%1814,9311.3%+ 6.0%262532Fiat Fiorino2,2241.1%+ 24.4%359,9120.9%+ 10.5%384133Ram Rampage2,0001.0%+ 1.6%3411,4291.0%+ 0.5%323534Chevrolet Spin1,9751.0%– 12.3%3310,3480.9%+ 9.9%333335Fiat Cronos1,9191.0%– 43.6%2914,5531.3%– 13.2%272236BYD Dolphin Mini1,9130.9%+ 45.1%3113,2211.2%+ 46.1%303737Chevrolet Montana1,6920.8%– 28.0%3610,1310.9%– 22.1%352938Citroen Basalt1,5650.8%new3710,0170.9%new378439BYD Dolphin1,4900.7%– 1.6%386,2880.6%– 34.6%504940Honda City1,4530.7%+ 8.2%458,3640.7%+ 34.9%424741Renault Duster1,4260.7%+ 4.2%448,6000.8%– 15.5%404042Toyota Hilux SW41,3430.7%– 7.6%438,3130.7%+ 8.9%434343Renault Kardian1,2400.6%– 29.3%4110,2840.9%+ 99.6%343444Honda City Hatch1,2060.6%– 2.1%497,4020.7%+ 30.5%464845Jeep Commander1,1940.6%– 24.8%487,2200.6%+ 2.0%474646Citroen C31,1460.6%– 42.3%536,3160.6%– 37.7%493947Renault Master1,0800.5%+ 85.2%427,6540.7%+ 64.8%445248Chery Tiggo 81,0620.5%+ 88.3%407,4670.7%+ 72.4%455449Mitsubishi Triton9830.5%n/a513,7930.3%n/a61 –50Nissan Versa9490.5%– 25.6%615,3670.5%– 9.8%545151Renault Oroch9070.5%+ 5.3%525,6830.5%– 8.8%525052VW Taos8890.4%– 53.0%508,5520.8%+ 21.9%414553Peugeot 20088690.4%+ 2019.5%476,6200.6%+ 795.8%485854Mitsubishi Eclipse Cross8330.4%+ 9.9%544,2730.4%+ 7.3%555655Chery Tiggo 5X8220.4%– 67.4%465,6120.5%– 60.3%534256BYD King7970.4%+ 921.8%556,2570.6%+ 7921.8%516657Peugeot 2087960.4%– 66.4%564,2030.4%– 57.4%564458BYD Yuan Pro7430.4%new621,9710.2%new73 –59Citroen C3 Aircross6360.3%– 37.3%732,8330.3%– 27.6%635760Nissan Sentra5240.3%+ 6.1%632,5150.2%– 0.8%656261Iveco Daily 4220.2%+ 22.0%652,1940.2%+ 54.5%687362Renault Kangoo4180.2%+ 88.3%691,8490.2%+ 670.4%757763Jaecoo 73810.2%new766920.1%new105 –64Ford Bronco3780.2%+ 136.3%1299790.1%– 8.4%908765Toyota RAV43700.2%+ 86.9%751,5330.1%+ 19.9%778366BMW X13610.2%– 35.0%662,4120.2%– 1.6%666567BMW 3 Series3510.2%– 25.3%682,0980.2%– 6.3%696868Hyundai HR3490.2%+ 405.8%711,9440.2%+ 359.6%749269Mitsubishi L2003430.2%– 56.1%604,0060.4%– 27.3%575370GWM Tank 3003410.2%new591,2180.1%new84 –71Volvo EX303320.2%– 50.2%672,0350.2%+ 79.5%718272BYD Seal3220.2%+ 13.8%701,4180.1%– 35.4%787273Nissan Frontier3130.2%– 60.3%723,9130.3%– 26.6%595574Volvo XC602790.1%+ 14.3%921,3280.1%– 8.3%817475Chery Arrizo 62690.1%n/a849900.1%+ 4400.0%8919476Ford Maverick2420.1%– 25.1%958820.1%– 38.6%977177Honda ZR-V2350.1%– 31.1%821,2300.1%– 55.8%836378Mitsubishi Pajero Sport2000.1%– 19.7%851,1480.1%+ 9.2%857879Kia K25001980.1%+ 41.4%791,2790.1%+ 61.5%828580VW/MAN Express1980.1%+ 31.1%831,1470.1%+ 25.2%869081Porsche Cayenne1870.1%– 42.3%889210.1%+ 9.6%969682Chevrolet Trailblazer1850.1%+ 39.1%979540.1%+ 17.2%938983GWM Ora 031830.1%– 68.9%911,3690.1%– 62.9%796084Mercedes GLC1780.1%+ 408.6%801,0290.1%+ 215.6%8712485Fiat Titano1700.1%– 74.9%583,9860.4%+ 287.0%586186Ford Transit1670.1%– 44.0%741,3300.1%– 7.6%807687Mercedes GLB1660.1%+ 492.9%935820.1%+ 119.6%11112088Effa V211640.1%+ 36.7%988300.1%+ 32.6%9910789BMW X21580.1%+ 2533.3%966110.1%+ 10083.3%11014890Fiat Ducato1500.1%+ 40.2%772,0500.2%+ 116.5%708891Mitsubishi Outlander1460.1%n/a –1460.0%n/a149 –92Toyota Yaris Hatch1460.1%– 93.8%643,5630.3%– 71.1%623293Fiat Scudo1440.1%– 4.0%811,7580.2%+ 21.7%767094VW Tiguan1440.1%– 39.0%948170.1%– 54.9%1027995Hyundai Tucson1400.1%+ 13900.0%901,0190.1%+ 995.7%8815796BMW X51380.1%+ 137.9% –5130.0%+ 54.5%11512797Porsche Macan1330.1%+ 54.7%1028290.1%+ 39.6%10010098Mercedes Sprinter 1310.1%– 9.0%1037480.1%– 0.8%1039199Audi Q51260.1%+ 5.9%1067080.1%– 5.9%10497100Hyundai Kona1240.1%+ 12300.0%1611800.0%+ 73.1%145161101Toyota Yaris Sedan1220.1%– 94.2%783,9110.3%– 60.0%6038102Mercedes C Class1190.1%+ 83.1%1006730.1%+ 15.2%107101103Suzuki Jimny1140.1%+ 2180.0%1651560.0%+ 642.9%147190104Mercedes GLA1120.1%+ 23.1%1116280.1%+ 59.4%108115105Chevrolet Equinox1070.1%– 59.3%1019390.1%– 26.2%9575106Ram 35001030.1%– 39.1%879430.1%+ 9.9%9494107Ram 1500930.0%– 64.9%1108510.1%+ 3.3%98104108BYD Shark860.0%new1056230.1%new109151109Land Rover Defender810.0%+ 88.4%1234570.0%+ 30.6%120122110Audi Q3800.0%– 62.3%1048210.1%– 11.1%10186111Mercedes CLA200790.0%+ 41.1%1143170.0%– 12.4%128117112Mercedes GLE750.0%– 11.8%1134610.0%+ 4.1%118119113Ford Territory740.0%– 74.4%892,3190.2%– 0.8%6764114Porsche 911720.0%– 21.7%1174500.0%– 44.2%12198115Range Rover710.0%– 25.3%1093940.0%– 10.0%123125116JAC E-JS1690.0%+ 64.3%1193000.0%– 58.5%130105117BMW IX1680.0%+ 161.5%1212300.0%+ 46.5%136155118Mini Hatch 3 Portas660.0%+ 10.0%1203750.0%– 24.5%125123119BMW X4650.0%– 19.8%1165160.0%– 6.9%114108120Ford F-150650.0%+ 58.5%1075650.1%+ 119.0%112135121Chevrolet Silverado630.0%– 7.4%1183580.0%– 57.9%127103122Honda CR-V560.0%– 62.4%1154870.0%– 25.4%116102123Ram 2500550.0%– 70.9%1124620.0%– 37.3%11793124Volvo XC90530.0%– 23.2%1085480.0%+ 4.8%113113125Mini Hatch 5 Portas480.0%+ 242.9%1431220.0%+ 82.1%153176126Foton Tunland450.0%new188460.0%new181 –127Audi A3 Sedan440.0%+ 51.7%1262640.0%+ 25.1%131140128Effa V22430.0%+ 10.3%1442270.0%+ 14.6%137139129Ford Mustang410.0%+ 64.0%1453140.0%+ 201.9%129131130JAC Hunter410.0%new1502050.0%new139203131Peugeot Expert410.0%– 71.1%1243800.0%– 22.3%124111132Land Rover Discovery400.0%– 50.0%1314460.0%+ 19.3%122133133Kia Sportage370.0%– 66.7%1283590.0%– 38.9%126109134BMW X6360.0%– 58.6%1252390.0%– 46.2%135118135Range Rover Evoque350.0%– 44.4%1461950.0%– 44.1%143134136Porsche Boxster340.0%– 38.2%1272570.0%– 30.2%132121137Peugeot Partner330.0%– 32.7%1372510.0%– 40.8%133129138Citroen Jumpy320.0%– 73.8%1602430.0%– 62.8%134114139Honda Civic310.0%– 71.0%1339770.1%+ 40.0%9195140Lexus NX310.0%– 8.8%1402000.0%– 11.1%140136141Porsche Panamera300.0%+ 7.1%1392230.0%+ 12.6%138152142Land Rover Discovery Sport280.0%– 44.0%1321280.0%– 72.1%152116143Kia Carnival270.0%n/a1351490.0%n/a148162144Peugeot Boxer250.0%+ 66.7%1411430.0%+ 83.3%150169145VW Jetta230.0%– 91.5%1224600.0%– 70.3%11981146BMW M2220.0%+ 10.0%1661170.0%– 7.9%155154147Citroen Jumper220.0%+ 340.0%1301810.0%+ 269.4%144171148Mini Countryman190.0%– 36.7%1481160.0%– 58.9%156138149Audi RS6 Avant180.0%+ 63.6%172500.0%+ 42.9%179189150Audi A3170.0%– 39.3%177570.0%– 69.5%175146151Honda Accord170.0%+ 13.3%1531430.0%+ 24.3%151164152BMW 5 Series160.0%+ 300.0%151910.0%+ 1200.0%164170153BMW X3140.0%– 92.4%1341980.0%– 72.8%14299154BMW X7140.0%n/a –1080.0%n/a158197155Kia Niro130.0%– 73.5%1571180.0%– 64.1%154137156Effa V25120.0%+ 33.3%154650.0%+ 35.4%171182157Porsche Cayman120.0%– 47.8%163950.0%– 37.5%162147158Audi Q7110.0%+ 0.0%167700.0%+ 34.6%167188159BMW 4 Series Cabrio110.0%+ 22.2%164490.0%– 23.4%180178160Range Rover Velar110.0%– 57.7%175680.0%– 63.4%170150161Lexus ES300100.0%n/a152800.0%+ 77.8%165173162VW Amarok100.0%– 98.6%1362,0110.2%– 16.1%7259163Audi Q890.0%– 62.5%1621040.0%+ 35.1%159156164Mercedes E Class80.0%+ 700.0%169630.0%+ 350.0%173199165BMW M370.0%– 61.1%156550.0%– 52.6%176163166BYD Tan70.0%new155570.0%new174 –167Chevrolet Blazer EV70.0%– 30.0%191250.0%+ 127.3%188184168Kia Stonic70.0%– 88.9%168640.0%– 87.3%172132169Audi A460.0%– 68.4%1581020.0%+ 29.1%160167170Volvo XC4060.0%– 93.7% –1990.0%– 65.3%141126171Audi A550.0%– 86.8%1701140.0%– 34.5%157142172BMW IX350.0%– 75.0%180310.0%– 62.2%185175173Jeep Grand Cherokee50.0%– 16.7%179920.0%+ 39.4%163183174Mercedes G class50.0%– 83.9%149960.0%– 11.1%161180175BMW IX40.0%– 73.3%178510.0%– 32.9%178158176Volvo C4030.0%– 95.9%176740.0%– 82.0%166128177VW Gol30.0%+ 50.0%183140.0%– 54.8%192196178Citroen C4 Cactus20.0%– 97.5%159540.0%– 92.6%177112179Jaguar F-Pace20.0%– 85.7% –80.0%– 92.7%194159180Mercedes A Class20.0%– 77.8%181160.0%– 69.2%190186181Renault Sandero20.0%– 99.1%1871730.0%– 91.7%14669182Chevrolet Camaro10.0%– 88.9%182130.0%– 83.1%193179183Ford e-Transit10.0%n/a17470.0%– 93.1%195144184Jeep Gladiator10.0%– 50.0% –150.0%– 95.4%191149185Lexus UX10.0%– 94.1% –60.0%– 94.4%200174186Peugeot 300810.0%– 85.7% –50.0%– 94.5%201181187Porsche Taycan10.0%– 87.5%190320.0%– 53.6%184160188Renault Kwid E-tech10.0%new171700.0%new168 –189Subaru Forester10.0%n/a –700.0%– 1.4%169177
Source: Manufacturers

More Stories
Uruguay November 2025: Chevrolet repeats at #1 with 15.2% share
Chevrolet holds 15.2% of the Uruguayan market in November. New light vehicle sales in Uruguay are off -1.1% year-on-year in...
How Mechanical Design Influences the Feel of a Vehicle
You know that feeling. You slide into the driver’s seat. You press the start button. The vehicle comes alive. It...
Competition Time. Chance to win a Smallest Cog goodies bundle.
The Smallest Cog Unveils Exciting New Merchandise Range Inspired by Richard Hammond’s iconic restoration workshop, The Smallest Cog’s exclusive new...
Florida Tolls Could Vanish for Residents as Tourists Pick Up the Tab
Florida drivers may eventually cruise the Turnpike without paying a cent at the toll gantries if a new idea from...
Extending Vehicle Lifespan Through Proven Engine Technology
We all want our cars to last. A vehicle is a major investment. It gets us to work. It takes...
China retail November 2025: Fang Cheng Bao, Lynk & Co hit all-time highs, market off -16.8% on high year ago basis
This content is for members only. Visit the site and log in/register to read.