
Spain June 2025: Renault #1, Dacia Sandero breaks record
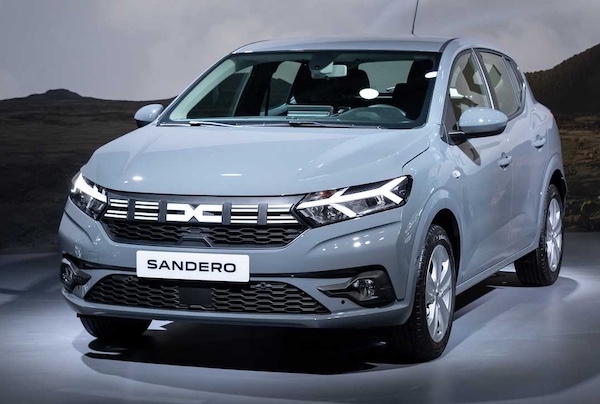
The Dacia Sandero reaches its highest ever monthly volume in June.
It’s another excellent month for new car sales in Spain, up 15.2% year-on-year in June to 119,125 units. This is the best June result since the pre-pandemic June 2019 volume of 134,341 and marks a 10th straight month of year-on-year gains. The year-to-date tally is up an equally satisfying 13.9% to 609,801. Once again sales are boosted by the demand stemming from replacement vehicles in the wake of the DANA storm (“Depresión Aislada en Niveles Altos”) with registrations in the Valencian region up 42.2% year-on-year to 12,089 and 58% YTD at 79,483. Other strong regions include Baleares (+47.4%), Ceuta y Melilla (+25.2%), Extremadura (+23.3%) and Andalucia (+23.2%).
Very encouragingly, private sales are once again the most dynamic channel, shooting up 28.8% to 48,836 units. Company sales match the market at +14.2% to 42,208 but rentals drop -1.5% to 28,081. All channels do well year-to-date, with private sales up 18.6% to 256,859, company sales up 9.8% to 197,964 and rentals up 11.9% to 154,978. Once again the main event of the month is the surge of electrified vehicles (BEV+PHEV) up 130.7% to 24,776 sales for the month, an all-time record volume, and representing an all time high 20.8% of the market vs. 10.4% a year ago in June 2024. Year-to-date, they are up 83% to 102,348 and 16.8% share vs. 10.4% last year.
Renault (+44.4%) delivers an outstanding performance and signs its second win in the past four month with 8.1% share, the same as last March when it also ranked #1. Toyota (+3.2%) is relegated to 2nd place with 7.5% of the market with Volkswagen (+22.6%) also down one spot on May to #3. Dacia (+29.4%) soars year-on-year but stays at #4 vs. #6 year-to-date. Seat (-19.2%) endures the worst performance in the Top 20 at #5. Mercedes (+21.9%) and Peugeot (+17.8%) also shine in the remainder of the Top 10 while below, BYD (+791.9%), Tesla (+60.7%), MG (+40.5%), Mazda (+39.3%), Skoda (+37.8%), Ford (+32.5%), Nissan (+31.3%) and Opel (+30.2%) all make themselves noticed.
Model-wise, the Dacia Sandero (+33.6%) simply reaches its highest ever monthly volume at over 4,300 sales, its previous best being 4,063 just last month. This is the 11th time in the past 13 months the Sandero is #1 in Spain. Like in May, the Renault Clio (+113%) follows in 2nd place and more than doubles its sales year-on-year, scoring its best monthly volume in over 8 years: since March 2017 (3,394). The Seat Arona (-17.6%) is in trouble year-on-year but rallies back up four spots on May to land on the third step of the podium. The Peugeot 208 (+88.8%), Opel Corsa (+69.1%) and VW T-Roc (+39.6%) all impress below. Notice also the VW Taigo (+118.3%) up 10 spots on last month to #13, the Mercedes GLC (+76.2%), Kia Stonic (+136.7%) and Tesla Model Y (+127.2%).
Previous month: Spain May 2025: Dacia Sandero and Renault Clio on top, BYD breaks all records
One year ago: Spain June 2024: Cupra breaks all records, rental sales pull market up 2.2%
Full June 2025 Top 68 All brands and Top 349 All models below.
Spain June 2025 – brands:
PosBrandJun-25%/24May2025%/24PosFY241Renault9,5908.1%+ 44.4%345,1897.4%+ 44.0%252Toyota8,9937.5%+ 3.2%149,5328.1%+ 1.5%113Volkswagen8,8227.4%+ 22.6%239,6446.5%+ 14.2%324Dacia7,2486.1%+ 29.4%434,2765.6%+ 25.4%675Seat6,5275.5%– 19.2%736,6346.0%+ 1.7%436Mercedes6,2745.3%+ 21.9%1027,8774.6%+ 15.3%997Hyundai6,1655.2%+ 1.5%533,9425.6%+ 4.1%748Peugeot6,1555.2%+ 17.8%833,1195.4%+ 3.2%889Kia5,4254.6%+ 7.0%635,3455.8%+ 13.7%5610BMW5,0504.2%+ 9.8%1124,1944.0%+ 3.2%111011Skoda4,5093.8%+ 37.8%1221,9703.6%+ 20.8%121312Citroen4,3423.6%– 19.1%1320,1033.3%– 22.0%141213Audi3,7673.2%– 9.7%1420,6293.4%+ 5.1%131114Opel3,6993.1%+ 30.2%1714,7712.4%– 8.9%171615MG3,6063.0%+ 40.5%925,4944.2%+ 78.7%101516Ford3,1222.6%+ 32.5%1617,5832.9%+ 29.7%161717Nissan3,1162.6%+ 31.3%1819,9163.3%+ 14.0%151418Cupra2,8072.4%– 16.9%1514,2312.3%+ 15.9%181819Tesla2,6322.2%+ 60.7%277,1661.2%– 1.1%222120BYD2,4082.0%+ 791.9%1910,1961.7%+ 756.1%202821Mazda2,3051.9%+ 39.3%2010,5441.7%+ 26.8%192022Fiat1,5091.3%– 30.4%236,5361.1%– 35.4%232223Volvo1,3781.2%– 16.7%227,2541.2%– 22.2%211924Omoda1,3061.1%+ 57.9%216,0431.0%+ 158.1%242625Jeep8970.8%– 8.7%265,4300.9%– 11.8%252326Ebro8770.7%new283,6980.6%new305827Lexus8490.7%+ 8.7%254,8670.8%+ 15.0%262428Jaecoo8240.7%new244,3420.7%new283829Mini6250.5%+ 5.9%294,8090.8%+ 23.0%272530Lynk & Co5060.4%+ 96.9%418750.1%+ 25.5%393731Suzuki4730.4%– 35.2%313,1280.5%– 9.0%312732Honda4580.4%+ 78.2%322,3530.4%+ 24.8%323333Mitsubishi4540.4%– 30.4%304,2980.7%+ 30.4%293034Porsche2970.2%– 21.8%341,9620.3%– 16.7%343235Polestar2340.2%+ 37.6%454650.1%+ 70.3%424036Land Rover2330.2%– 36.9%361,6780.3%– 5.1%363437Leapmotor2270.2%new359070.1%new384638Alfa Romeo2190.2%+ 16.5%371,6810.3%– 9.0%353539KGM/SsangYong2160.2%– 23.7%332,1230.3%– 30.6%332940DS2110.2%– 49.3%381,1130.2%– 54.6%373141Subaru1480.1%+ 12.1%396530.1%– 0.5%403642Evo870.1%+ 155.9%406220.1%+ 277.0%414143Smart720.1%– 7.7%432820.0%– 54.8%453944SWM640.1%+ 966.7%424090.1%+ 671.7%444545Xpeng630.1%new462610.0%new465046Alpine520.0%+ 1633.3%471910.0%+ 496.9%485147DFSK510.0%+ 240.0%512190.0%+ 99.1%474348Maserati350.0%+ 34.6%541400.0%– 15.2%494449Lancia330.0%new444100.1%new435450Ineos300.0%+ 1400.0%55720.0%+ 94.6%534951Bestune300.0%new48690.0%new54 –52Dongfeng270.0%n/a501040.0%+ 10300.0%515653Livan190.0%new491360.0%new505954Ferrari180.0%+ 157.1%52590.0%+ 34.1%554855Bentley70.0%– 12.5%57370.0%+ 8.8%585256Voyah60.0%n/a6690.0%+ 80.0%626157Aston Martin50.0%– 16.7%56400.0%+ 25.0%565358Lamborghini50.0%– 44.4%53390.0%+ 30.0%575759Abarth40.0%– 90.9%60130.0%– 91.0%614760McLaren40.0%+ 300.0% –60.0%+ 100.0%656761Seres30.0%+ 200.0% –70.0%– 41.7%646262Yudo10.0%– 75.0%59170.0%– 60.5%595563DR Motor10.0%+ 0.0%6570.0%+ 75.0%636464Sportequipe10.0%new6160.0%new66 –65Skywell10.0%+ 0.0%6250.0%+ 25.0%676866Lotus10.0%n/a –40.0%+ 100.0%686567Caterham10.0%n/a6330.0%+ 200.0%697668Moke Interational10.0%– 80.0% –30.0%– 57.1%7066
Spain June 2025 – models:
PosModelJun-25%/24May2025%/24PosFY241Dacia Sandero4,3293.6%+ 33.6%120,3663.3%+ 24.9%112Renault Clio3,3172.8%+ 113.0%213,4452.2%+ 31.0%373Seat Arona2,6232.2%– 17.6%712,1072.0%– 1.4%664Peugeot 2082,4862.1%+ 88.8%412,1952.0%+ 64.6%5195Opel Corsa2,3442.0%+ 69.1%169,7951.6%+ 7.8%14166VW T-Roc2,2661.9%+ 39.6%118,9891.5%+ 8.2%15157Toyota Corolla2,2021.8%+ 6.8%911,2241.8%– 8.0%728Peugeot 20082,1081.8%+ 6.8%1910,1211.7%– 6.3%12129Seat Ibiza2,0361.7%– 29.2%512,2602.0%+ 1.5%4310Toyota Yaris Cross2,0321.7%+ 28.8%189,8221.6%+ 16.3%13911Hyundai Tucson1,9321.6%+ 10.2%1210,5271.7%– 3.6%10412Toyota C-HR1,9131.6%+ 2.4%610,1321.7%+ 27.5%11813VW Taigo1,9101.6%+ 118.3%238,5951.4%+ 88.8%193614Nissan Qashqai1,9041.6%+ 68.0%2610,8591.8%+ 10.0%91115MG ZS1,8891.6%+ 24.0%315,0142.5%+ 50.8%2516Renault Captur1,7391.5%– 11.0%1311,2041.8%+ 34.1%81317VW T-Cross1,7031.4%+ 21.9%346,8281.1%– 3.6%252018BMW X11,5121.3%+ 28.7%216,6691.1%+ 13.5%262419Dacia Duster1,4821.2%– 1.7%158,0291.3%+ 22.9%221820Citroen C3 1,4651.2%– 28.7%286,9931.1%– 35.2%241721Tesla Model 31,4511.2%+ 31.1%1064,0890.7%– 10.0%532922Citroen C41,3161.1%– 21.8%108,8561.5%+ 36.7%162623Kia Sportage1,3031.1%– 35.6%178,6081.4%– 9.0%171024Mercedes GLC1,2531.1%+ 76.2%376,2511.0%+ 41.1%283225Seat Leon1,2481.0%+ 17.4%148,5961.4%+ 34.4%182226Skoda Kamiq1,2171.0%+ 8.1%355,8961.0%+ 14.4%343427Kia Stonic1,2051.0%+ 136.7%258,0881.3%+ 39.6%213128Mercedes GLA1,1941.0%– 13.7%454,5860.8%– 10.9%474029Hyundai Kona1,1801.0%+ 13.8%246,6091.1%+ 7.4%272130Tesla Model Y1,1791.0%+ 127.2%643,0520.5%+ 16.1%696531Ford Kuga1,1691.0%+ 53.4%416,1251.0%+ 39.4%305332Renault Austral1,1361.0%– 14.0%535,4910.9%+ 2.7%372733Mercedes A Class1,1331.0%+ 20.9%493,9870.7%+ 11.4%555534Skoda Fabia1,1331.0%+ 70.9%405,4850.9%+ 51.8%384535Citroen C3 Aircross1,1240.9%+ 51.1%1071,4310.2%– 70.9%1016036Ford Puma1,1060.9%+ 53.2%296,1801.0%+ 24.6%293737Omoda 51,0980.9%+ 33.3%335,4910.9%+ 137.3%365038VW Tiguan1,0890.9%– 12.2%305,9911.0%+ 14.1%323339Toyota Yaris1,0790.9%– 5.4%88,2631.4%– 4.7%201440MG HS/eHS1,0650.9%+ 267.2%324,5210.7%+ 93.5%497241Renault Arkana1,0260.9%+ 11.0%753,8890.6%– 4.9%594642BYD Seal U1,0150.9%+ 2206.8%225,3250.9%+ 7095.9%4010943Renault Symbioz9970.8%+ 297.2%714,3150.7%+ 1619.1%5213544Kia Niro9850.8%+ 52.2%395,8381.0%+ 16.2%353545Hyundai i209780.8%– 19.9%317,1211.2%+ 12.0%232546Audi A39680.8%+ 27.0%364,7030.8%+ 16.6%465447Toyota RAV49390.8%– 12.1%515,9711.0%– 16.6%332348Fiat 6009270.8%+ 1224.3%853,9060.6%+ 2403.8%5714049Cupra Formentor9240.8%– 38.0%385,1380.8%– 22.3%423050VW Golf8930.7%+ 56.4%524,4470.7%+ 16.6%504851Hyundai i108920.7%+ 27.6%423,6050.6%+ 48.8%666652Nissan Juke8900.7%+ 9.2%566,0871.0%+ 12.6%313853Skoda Karoq8750.7%+ 38.2%464,0850.7%+ 20.5%545154Cupra Leon8460.7%– 45.7%274,7940.8%– 1.8%454255Cupra Terramar8360.7%+ 16620.0%542,7380.4%+ 11804.3%7216156Jaecoo 78240.7%new444,3420.7%new5114357Opel Mokka7990.7%+ 49.3%682,6780.4%+ 7.4%757758Mazda CX-307830.7%+ 32.3%613,6770.6%+ 34.4%606459Peugeot 30087580.6%+ 17.9%474,8400.8%– 17.3%434160BMW X27560.6%+ 234.5%483,6090.6%+ 150.3%657361Ford Focus7380.6%– 2.8%744,5260.7%+ 26.1%485662Jeep Avenger7270.6%+ 43.7%693,9460.6%+ 22.5%566163Ebro S7007060.6%new702,7720.5%new7130664Audi Q36780.6%– 52.4%633,6520.6%– 40.1%612865Dacia Bigster6460.5%new911,2180.2%new110 –66Dacia Jogger6370.5%– 21.5%593,6220.6%– 9.6%645267Volvo XC406260.5%– 12.2%583,3840.6%– 16.9%683968Mini Lineup6250.5%+ 5.9%554,8090.8%+ 23.1%444969Seat Ateca6200.5%– 16.8%653,6410.6%– 8.0%624370Audi A16190.5%– 13.1%573,6320.6%+ 45.3%637071Kia Ceed5820.5%– 28.4%503,8940.6%+ 7.1%586272Kia Xceed5760.5%– 23.5%433,4330.6%– 18.2%674773Renault Rafale5600.5%+ 247.8%962,3180.4%+ 511.6%8112074Mazda CX-55260.4%+ 46.9%932,2770.4%+ 15.5%837475Lynk & Co 014820.4%+ 87.5%1837940.1%+ 13.9%13613476BMW 1-Series4750.4%– 46.4%602,6960.4%– 32.9%746377BMW X34730.4%+ 49.7%832,1620.4%+ 8.8%857678Audi Q54660.4%+ 8.1%862,2960.4%+ 47.7%827179BYD Seal4580.4%+ 604.6%1111,0250.2%+ 219.3%12214480Mazda34510.4%+ 40.1%762,1380.4%+ 36.3%868681VW Polo4480.4%– 61.1%802,1380.4%– 46.4%875782MG 34290.4%+ 15.3%205,2380.9%+ 1071.8%419183Skoda Octavia4150.3%+ 16.6%1002,3720.4%– 8.5%796984Kia EV33930.3%new672,7130.4%new7315985Mercedes C Class3930.3%+ 57.2%771,9000.3%– 1.9%908886Fiat Panda3830.3%+ 14.0%621,6330.3%– 17.5%978487Hyundai Bayon3720.3%– 30.1%662,2410.4%– 12.8%846888Peugeot 3083630.3%– 56.3%822,5220.4%– 42.0%775889BYD Dolphin Surf3610.3%newn/a4650.1%new169 –90Toyota Aygo X3560.3%– 55.5%731,9830.3%– 25.1%897591Mercedes EQA3550.3%+ 38.7%1131,2080.2%+ 44.7%11111892Toyota bZ4X3550.3%+ 1320.0%781,3080.2%+ 550.7%10721193Skoda Kodiaq3400.3%+ 73.5%811,8850.3%+ 61.8%919394Audi Q23360.3%– 11.3%842,4640.4%– 19.9%786795Mercedes CLA3310.3%+ 4.4%1051,6100.3%+ 3.2%998996Mercedes V Class3270.3%+ 39.7%921,6140.3%+ 40.6%9810597Opel Frontera3250.3%new878190.1%new133 –98Audi A53140.3%+ 881.3%1031,4570.2%+ 387.3%10016699Skoda Scala3140.3%+ 65.3%1041,4250.2%– 12.8%10294100Volvo XC603080.3%– 8.9%981,7940.3%– 19.6%9478101Lexus NX3070.3%+ 6.2%941,8660.3%+ 8.4%9282102Renault 53050.3%new902,3650.4%new80206103Peugeot 50082990.3%+ 86.9%722,0320.3%– 7.8%8880104Lexus LBX2940.2%– 14.8%1011,7370.3%+ 49.4%9587105Nissan X-Trail2940.2%– 21.0%892,6480.4%+ 34.3%7681106Hyundai Inster2930.2%new991,0580.2%new117275107BMW ix12840.2%+ 76.4%1171,0320.2%+ 29.5%120112108Renault Espace2760.2%+ 53.3%1181,3740.2%+ 19.3%103107109BMW X42720.2%+ 28.9%1101,0290.2%– 4.5%121100110BMW 3-Series2510.2%– 34.5%971,3720.2%– 32.3%10483111Mitsubishi Eclipse Cross2400.2%+ 1163.2%1566410.1%+ 248.4%149193112Mercedes GLE2330.2%+ 12.6%1221,2080.2%+ 9.9%112103113Mazda CX-602140.2%+ 132.6%1308910.1%+ 49.0%129131114Hyundai i302030.2%– 68.7%791,8060.3%– 49.2%9359115BMW 4-Series2010.2%– 29.7%1459860.2%– 25.2%124104116Volvo EX302010.2%– 36.2%1316940.1%– 47.1%14498117BMW 2-Series1970.2%– 29.1%1251,1120.2%– 33.5%11697118Citroen C4 X1970.2%– 40.7%1331,2960.2%+ 9.9%108111119BYD Atto 31960.2%+ 102.1%1211,1800.2%+ 140.8%115136120Mercedes CLE1900.2%+ 72.7%1268700.1%+ 30.0%131130121Mercedes T Class1900.2%+ 65.2%1286270.1%+ 95.3%151182122Kia Picanto1820.2%+ 55.6%951,6720.3%+ 2.5%9685123Suzuki SX4 S-Cross1720.1%+ 13.9%1536800.1%– 14.8%147128124Ebro S8001710.1%new1029260.2%new127 –125Mazda21700.1%– 2.9%1299540.2%– 1.5%126106126Citroen C5 Aircross1660.1%– 68.2%1121,3360.2%– 39.5%10679127Renault Scenic1660.1%+ 268.9%1945930.1%+ 273.0%155216128Polestar 21640.1%+ 6.5%2452510.0%– 2.3%200179129Lexus UX1550.1%+ 86.7%1418050.1%– 12.1%134114130Dacia Spring1540.1%+ 258.1%1191,0410.2%+ 120.6%119168131BYD Atto 21530.1%new1474660.1%new168 –132BYD Sealion 71530.1%new1385160.1%new161301133Mercedes GLB1490.1%– 30.0%1379910.2%– 12.2%123101134Porsche Cayenne1420.1%+ 20.3%1506850.1%– 5.4%145138135Skoda Elroq1390.1%new1713870.1%new180 –136Suzuki Swift1380.1%+ 5.3%1358850.1%+ 64.5%130133137Suzuki Vitara1370.1%– 30.8%1161,3650.2%+ 37.0%10599138Honda CR-V1350.1%+ 255.3%1754010.1%+ 111.1%176187139Mercedes B Class1340.1%+ 36.7%1617020.1%+ 2.8%143142140BMW ix21320.1%+ 38.9%1277140.1%+ 119.0%141145141Mercedes E Class1310.1%+ 17.0%1148920.1%+ 47.0%128129142Omoda 91310.1%new1425,4830.9%new39 –143Opel Astra1300.1%– 45.8%1248190.1%– 37.5%132108144Alfa Romeo Junior1280.1%new1481,0420.2%new118212145Mitsubishi ASX1160.1%– 49.3%1547030.1%– 54.1%142102146Leapmotor T031150.1%new1345460.1%new160232147Audi Q41130.1%+ 36.1%1684820.1%+ 20.5%166157148Leapmotor C101120.1%new1463610.1%new183283149MG 41120.1%– 68.6%1595130.1%– 64.2%16295150DS 7 Crossback1110.1%– 65.1%1447650.1%– 50.1%13796151BMW X51100.1%– 29.0%1436810.1%– 14.8%146122152Cupra Tavascan1100.1%+ 0.9%1159610.2%+ 558.2%125169153Kia Sorento1080.1%+ 8.0%1726490.1%– 13.2%148137154Honda HR-V1060.1%+ 30.9%1656100.1%+ 3.0%153139155Honda Civic1050.1%+ 54.4%1705570.1%+ 7.7%157148156VW Tayron1030.1%new1514150.1%new173 –157VW Touran1010.1%+ 60.3%1327620.1%+ 135.2%138147158Mercedes EQE990.1%+ 23.8%1854950.1%+ 42.7%164151159Audi Q8970.1%+ 79.6%1497480.1%+ 169.1%139146160Volvo XC90970.1%– 28.1%1367390.1%– 9.7%140124161Fiat 500930.1%– 94.4%2075940.1%– 92.2%15444162BMW 5-Series910.1%– 28.3%1406180.1%+ 38.3%152150163Peugeot 408900.1%– 34.8%881,2530.2%+ 33.6%109123164VW Passat880.1%+ 39.7%1664360.1%+ 35.8%171165165Opel Grandland870.1%– 59.7%1575590.1%– 53.1%156119166KGM Tivoli/Grand860.1%– 46.3%1231,2020.2%– 35.2%11390167Hyundai Staria840.1%+ 8300.0%2421970.0%+ 155.8%211235168Cupra Born830.1%+ 5.1%1395000.1%+ 43.3%163149169Hyundai Santa Fe820.1%– 26.1%1673930.1%+ 25.6%177162170Jeep Renegade800.1%– 74.0%1644710.1%– 68.8%167110171Mercedes EQB800.1%+ 35.6%1603920.1%+ 49.0%178177172VW ID.4790.1%+ 38.6%1893850.1%+ 2.7%182186173Audi A6780.1%+ 41.8%1554560.1%+ 40.3%170175174DS 4770.1%+ 20.3%2262670.0%– 48.9%198158175Omoda E5770.1%+ 2466.7%1822950.0%+ 992.6%194231176Toyota Corolla Cross760.1%+ 13.4%1973150.1%– 55.5%191152177Citroen C5 X740.1%+ 174.1%1741910.0%– 7.7%212200178Hyundai Ioniq5720.1%+ 28.6%1902760.0%+ 51.6%196204179Jeep Compass710.1%– 55.6%1207980.1%– 38.6%135116180Kia EV6700.1%– 19.5%1583310.1%– 16.8%188160181VW ID.3700.1%– 11.4%1983240.1%+ 12.9%189188182BYD Dolphin690.1%+ 9.5%1091,1930.2%+ 315.7%114141183Polestar 4670.1%new2101890.0%new214259184BMW X6660.1%– 12.0%1734070.1%– 0.5%175153185Mazda MX-5640.1%+ 8.5%2271890.0%– 11.7%213197186Hyundai Inoiq9630.1%new –630.0%new269 –187MG Marvel620.1%+ 376.9%2361140.0%+ 78.1%245252188Range Rover Sport (est)620.1%– 10.1%1863860.1%– 4.9%181167189KGM Korando/C300600.1%– 23.1%1786350.1%– 11.1%150132190BMW i4590.0%– 31.4%1523530.1%– 10.6%186173191KGM Torres580.0%+ 87.1%2201610.0%– 47.2%225201192Subaru Crosstrek580.0%+ 56.8%1622860.0%+ 43.0%195180193Porsche Macan550.0%– 56.7%1765550.1%– 32.8%159127194Renault Megane540.0%– 77.1%2081660.0%– 86.9%223115195Fiat Tipo530.0%– 3.6%1803070.1%+ 169.3%192185196Honda Jazz530.0%+ 112.0%1634220.1%+ 122.1%172191197Xpeng G6530.0%new2022010.0%new209286198Alfa Romeo Tonale510.0%– 3.8%2333600.1%– 71.0%184121199Fiat Grande Panda510.0%new n/a600.0%new271 –200Mitsubishi Colt510.0%– 85.9%1082,7980.5%+ 177.9%70126201Peugeot 508510.0%– 68.9%2291550.0%– 71.7%227155202Subaru Legacy510.0%+ 104.0%2341410.0%– 23.8%233217203Honda ZR-V500.0%+ 13.6%1923310.1%+ 10.7%187174204Mazda MX-30500.0%– 2.0%2351460.0%– 37.6%230199205BMW IX 490.0%+ 390.0%2301040.0%+ 20.9%250239206Land Rover Defender490.0%– 44.9%1775570.1%+ 43.6%158164207Alpine A290480.0%new2031670.0%new220367208Ford Explorer470.0%+ 1466.7%2092970.0%+ 1137.5%193181209Lexus ES470.0%+ 67.9%1912400.0%+ 13.7%203205210Mazda CX-80470.0%new2012720.0%new197234211Porsche 911470.0%– 14.5%1843570.1%– 21.2%185171212Skoda Enyaq470.0%– 30.9%2251860.0%– 55.3%215170213Volvo C40470.0%+ 88.0%2511070.0%– 54.3%249208214Audi Q7460.0%+ 53.3%1813880.1%+ 187.4%179194215EVO5460.0%+ 666.7%2043200.1%+ 611.1%190222216Mitsubishi Outlander460.0%n/a1791360.0%n/a236 –217Audi Q6440.0%+ 340.0%2242130.0%+ 2030.0%207248218MG S5390.0%new260510.0%new275 –219Range Rover Evoque390.0%– 53.6%2212510.0%– 30.3%201176220Range Rover (est)380.0%– 7.3%2052340.0%– 2.1%205202221Toyota Land Cruiser380.0%– 38.7%1994910.1%+ 16.9%165113222Lancia Ypsilon330.0%new1884100.1%new174282223Range Rover Velar330.0%– 29.8%2501410.0%– 41.3%231210224Smart #1330.0%– 34.0%2221410.0%– 57.4%232183225VW ID.7330.0%+ 560.0%2551500.0%+ 94.8%228256226Porsche Taycan320.0%+ 88.2%2911160.0%+ 30.3%244238227BMW i5310.0%+ 63.2%238990.0%+ 25.3%252242228Ford Capri310.0%new2121670.0%new221245229VW Touareg310.0%– 38.0%2321480.0%– 20.4%229203230Ineos Grenadier300.0%+ 1400.0%277720.0%+ 94.6%262277231SWM G01300.0%+ 400.0%2191750.0%+ 307.0%219247232Maserati Grecale290.0%+ 52.6%2781180.0%– 13.2%241229233Skoda Superb290.0%– 25.6%1952490.0%+ 13.2%202196234Subaru Forester290.0%– 51.7%2371990.0%– 11.9%210198235Alfa Romeo Stelvio280.0%– 78.0%1692360.0%– 57.6%204156236Volvo EX40280.0%+ 211.1%2131640.0%+ 62.9%224n/a237BMW X7270.0%– 22.9%1931840.0%+ 2.2%216215238Dongfeng Box270.0%new2531040.0%new251284239SWM G03F270.0%+ 2600.0%2281350.0%+ 13400.0%237278240BMW 7-Series260.0%+ 0.0%2061400.0%– 23.5%234219241Volvo V60260.0%+ 100.0%2142310.0%+ 61.5%206218242Suzuki Swace250.0%– 72.8%2741760.0%– 29.6%218172243Lynk & Co 02240.0%new243810.0%new260 –244Volvo EX90240.0%new262820.0%new259300245Mercedes G Class230.0%+ 360.0%2161550.0%+ 58.2%226221246Bestune T77220.0%new217540.0%new272 –247Smart #3220.0%– 21.4%2001170.0%– 45.8%243207248Lexus RZ210.0%+ 950.0%327510.0%+ 121.7%274295249Mercedes EQS210.0%+ 133.3%2471260.0%+ 180.0%238254250Porsche Panamera200.0%– 44.4%2152060.0%+ 167.5%208230251DFSK E5190.0%new2881070.0%new248292252Ford Mustang190.0%– 24.0%2181660.0%+ 88.6%222220253Mercedes S Class190.0%– 24.0%2111240.0%– 13.3%239228254Nissan Ariya190.0%– 24.0%1872590.0%+ 219.8%199226255Lexus RX180.0%+ 0.0%2231360.0%– 12.8%235214256BMW XM170.0%+ 30.8%239920.0%+ 37.3%256240257DS 3170.0%– 48.5%241630.0%– 83.8%268190258Smart #5170.0%new322230.0%new302 –259Livan X3 Pro160.0%new2401170.0%new242311260Jeep Wrangler150.0%+ 400.0%1961840.0%+ 132.9%217225261EVO3140.0%– 12.5%2441220.0%+ 93.7%240244262Hyundai Ioniq6140.0%+ 16.7%268450.0%– 22.4%278241263Opel Crossland140.0%– 97.0%266950.0%– 95.6%25492264Mercedes GLS130.0%+ 0.0%249780.0%+ 18.2%261255265Renault 4130.0%new272270.0%new295 –266Alfa Romeo Giulia120.0%+ 50.0%263430.0%– 15.7%279272267BMW Z4120.0%+ 20.0%269910.0%– 18.0%257243268DFSK 500120.0%+ 50.0%310370.0%– 15.9%281262269KGM Rexton120.0%– 14.3%2311100.0%– 40.2%246209270Kia Proceed120.0%+ 71.4%284530.0%– 14.5%273253271Land Rover Discovery Sport120.0%– 69.2%2461090.0%– 18.0%247224272EVO6110.0%new265660.0%new265315273Subaru Solterra100.0%+ 11.1%302210.0%– 36.4%305289274BMW 8-Series90.0%+ 12.5%285270.0%– 42.6%293269275EVO790.0%+ 80.0%264690.0%+ 187.5%264257276Ford Mustang Mach-E90.0%– 87.3%257840.0%– 79.5%258178277Honda E:NY190.0%+ 800.0%271320.0%+ 28.0%286298278Kia EV990.0%– 40.0%252660.0%– 23.3%266236279Nissan Leaf90.0%– 67.9%258630.0%– 54.0%270233280Xpeng G990.0%new256480.0%new276337281MG 580.0%– 27.3%270230.0%– 14.8%301296282Volvo EC4080.0%new304270.0%new296195283Volvo V9080.0%+ 60.0%300230.0%– 28.1%303265284DFSK Seres 370.0%n/a332150.0%+ 150.0%315339285EVO470.0%+ 0.0%293450.0%+ 36.4%277271286SWM G0570.0%new248970.0%new253302287Cupra Ateca60.0%– 95.6%273940.0%– 65.6%255189288DFSK 60060.0%new295340.0%new284334289Lexus LM60.0%– 62.5%259290.0%– 17.1%290246290Voyah Free60.0%n/a32990.0%+ 80.0%336331291VW ID.560.0%– 50.0%299320.0%– 55.6%287263292Bestune T9050.0%new283110.0%new326 –293DFSK 58050.0%+ 66.7%328150.0%– 60.5%314270294Ferrari 296 GTS50.0%+ 150.0%301160.0%+ 45.5%311319295Ferrari Roma50.0%+ 400.0%333120.0%+ 20.0%321325296Lamborghini Urus50.0%+ 25.0%276280.0%+ 86.7%291309297Abarth 50040.0%– 90.9%292130.0%– 91.0%320223298Alpine A11040.0%+ 33.3%280240.0%– 25.0%299279299Aston Martin DBX40.0%n/a315140.0%+ 75.0%317317300Audi A740.0%+ 33.3%279270.0%– 28.9%292276301DS No 840.0%newn/a100.0%new333 –302Jeep Grand Cherokee40.0%– 33.3%286310.0%– 27.9%288274303Maserati Gran Turismo40.0%n/a318110.0%+ 1000.0%329340304Volvo S6040.0%– 95.5%32370.0%– 96.2%343227305Bentley Bentayga30.0%+ 0.0%31380.0%– 38.5%338318306Bentley Continental30.0%– 25.0%314210.0%+ 31.3%304304307Bestune B7030.0%new34140.0%new352 –308BYD Tang30.0%n/a334260.0%+ 550.0%297348309Ferrari SF9030.0%+ 50.0%316110.0%+ 175.0%328354310Ford Bronco30.0%– 78.6%281380.0%– 38.7%280260311Livan X6 Pro30.0%new282190.0%new308 –312McLaren Cabrio30.0%n/a–30.0%n/a361 –313Mercedes AMG GT30.0%– 40.0%275370.0%+ 48.0%282285314Mercedes SL30.0%– 25.0%294240.0%+ 20.0%300297315Polestar 330.0%– 81.3%289250.0%+ 56.3%298290316Seres 530.0%+ 200.0% –70.0%– 41.7%342328317Audi A420.0%– 98.9%267690.0%– 91.6%263125318Audi A820.0%– 84.6%326320.0%– 5.9%285288319Cupra Raval20.0%+ 100.0% –60.0%+ 500.0%344392320DFSK ix520.0%– 50.0% –110.0%– 52.2%327294321DS 920.0%+ 100.0%305140.0%+ 40.0%318313322Ferrari 296 GTB20.0%+ 100.0%30860.0%– 33.3%346323323Ferrari Purosangue20.0%+ 100.0%31980.0%+ 60.0%340333324Fiat 500X20.0%– 95.0%261350.0%– 88.2%283184325MG Cyberster20.0%new296200.0%new306329326Tesla Model X20.0%– 71.4%330140.0%– 65.0%319267327Toyota Highlander20.0%– 92.9% –120.0%– 93.0%322213328VW Arteon20.0%– 81.8% –40.0%– 95.8%355251329Aston Martin DB1210.0%– 66.7%312110.0%– 35.3%324310330Bentley Flying Spur10.0%+ 0.0%30680.0%+ 60.0%339343331Caterham Seven10.0%n/a –20.0%+ 100.0%365381332DR 4.010.0%n/a –30.0%+ 50.0%356352333Ferrari 12Cilindri10.0%new32060.0%new345 –334Lexus LS10.0%n/a34030.0%+ 50.0%358364335Lotus Emeya10.0%new –10.0%new376 –336Maserati Ghibli10.0%n/a33850.0%– 16.7%348336337Maserati MC2010.0%+ 0.0% –30.0%– 25.0%359346338McLaren Coupe10.0%n/a –30.0%+ 200.0%360371339Mitsubishi Space Star10.0%– 97.7%324200.0%– 96.5%307154340Moke International10.0%– 80.0% –30.0%– 66.7%362342341Porsche Cayman10.0%– 92.3%325270.0%– 65.8%294264342Renault Zoe10.0%– 83.3% –20.0%– 96.8%368266343Skywell BE1110.0%+ 0.0%31750.0%+ 66.7%349357344Sportequipe XK210.0%new29760.0%new347368345Suzuki Across10.0%– 90.9%331110.0%– 26.7%330291346Toyota Mirai10.0%n/a –10.0%n/a385 –347Volvo S9010.0%n/a –20.0%– 85.7%370312348Xpeng P710.0%new336120.0%new323350349Yudo K310.0%– 75.0%287170.0%– 60.5%310281
Source: ANFAC

More Stories
Mexico November 2025: Mazda at all time high, Geely data now available
2024 and 2025 Mexican data is now available for Geely. The Mexican new light vehicle market edges down -0.4% year-on-year...
Top Reasons to Choose a UK Specialist for Your Range Rover Engine Rebuild
Range Rover engines are engineered for power, durability, and smooth performance but even the strongest units eventually experience wear and...
India November 2025: Tata Nexon threepeats at #1 in market up 18.7%
The Tata Nexon is the best-selling vehicle in India for the 3rd straight month. After smashing its monthly volume record...
Updated Suzuki Dzire dials up the style with new interior treatment
Suzuki Auto South Africa has unveiled a sleek new black interior for the Dzire range, delivering a more modern, durable...
Vietnam November 2025: VinFast breaks record again, Limo Green #1 with 14.2% share
The VinFast Limo Green is by far the best-selling vehicle in Vietnam in November. Based on data by local association...
Ecuador November 2025: GWM Poer up to #2
The GWM Poer is the 2nd best-selling vehicle in Ecuador in November. New vehicle sales in Ecuador continue to surge...