
Slovenia May 2025: Renault Captur catches up on Skoda Octavia YTD
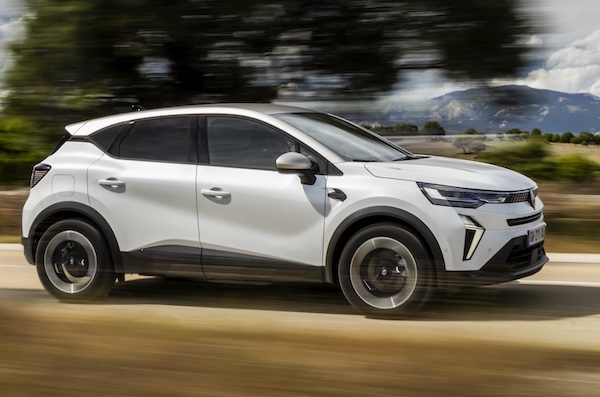
The Renault Captur is only 15 sales below the Skoda Octavia year-to-date.
5,118 new cars found a buyer in Slovenia in May, a satisfying 5.2% year-on-year uptick. The year-to-date volume is also in positive at +6.1% to 24,983. Both Volkswagen (-9%) and Renault (-5,.3%) don’t benefit from the market growth but top the brands charts. In contrast Skoda (+41.4%) and Hyundai (+37.7%) both shoot up below. But the most dynamic carmaker in the Top 10 is without a doubt Ford, up 193.5% to #7. Dacia (+11.3%) and Audi (+10.1%) also beat the market in the remainder of the Top 10. Further down, Cupra (+86.5%), Opel (+64.4%) and Mazda (+50%) stand out.
As for models, the Renault Clio (+45.5%) rallies back up four spots on April to land its first victory since last February. It is however stuck in third place year-to-date whereas it led the overall charts over the Full Year 2024. The Renault Captur (+5%) follows and is getting a lot closer to the Skoda Octavia (+88.7%) in the year-to-date ranking: only 15 units separate the two models. The Octavia is down two ranks on last month to #3. Below the VW Tiguan (-2.4%), the Hyundai Tucson (+51.9%) surges to #5 ahead of the Citroen C3 (+5.3%) and Skoda Kodiaq (+31.5%). The Toyota Yaris Cross (+14.1%) and Dacia Duster (+11.2%) also shine below.
Previous month: Slovenia April 2025: Skoda places three models in Top 4
One year ago: Slovenia May 2024: Renault Captur manages first pole position in almost 3 years
Full May 2025 Top 43 All brands and Top 247 All models below.
Slovenia May 2025 – brands:
PosBrandMay-25%/24Apr2025%/24PosFY241Volkswagen78615.4%– 9.0%13,86115.5%+ 14.9%112Renault57511.2%– 5.3%32,3889.6%+ 3.7%323Skoda56010.9%+ 41.4%22,91211.7%+ 23.1%234Hyundai3587.0%+ 37.7%41,5396.2%+ 25.5%465Toyota3096.0%+ 4.7%51,3985.6%– 14.7%546Peugeot2384.7%– 24.0%71,2985.2%– 6.6%657Ford2264.4%+ 193.5%61,1854.7%+ 87.2%7118Citroen2184.3%+ 0.5%119143.7%– 12.2%9109Dacia1973.8%+ 11.3%127433.0%– 15.5%11710Audi1963.8%+ 10.1%88933.6%+ 2.9%10911Kia1843.6%– 18.6%91,1164.5%+ 6.5%8812Opel1713.3%+ 64.4%146282.5%– 5.1%141313BMW1492.9%+ 1.4%107212.9%– 3.0%121214Tesla901.8%– 4.3%213141.3%– 25.8%191815Mercedes871.7%– 29.3%136702.7%+ 18.0%131516Nissan781.5%– 4.9%194501.8%+ 14.2%151717Suzuki741.4%– 25.3%184481.8%– 30.9%161618Mazda721.4%+ 50.0%203571.4%– 0.8%182019Cupra691.3%+ 86.5%173731.5%+ 58.1%172220Seat601.2%– 54.2%152841.1%– 40.2%201921MG551.1%– 16.7%162481.0%– 28.5%222122Forthing370.7%+ 1750.0%232611.0%+ 2272.7%213023Geely300.6%– 3.2%261700.7%+ 29.8%252324Jeep260.5%+ 4.0%221910.8%+ 2.7%232525KG Mobility260.5%+ 85.7%251540.6%+ 62.1%272926Porsche260.5%+ 44.4%271180.5%– 8.5%282627Volvo230.4%– 8.0%241750.7%– 12.1%242428Mitsubishi230.4%+ 15.0%31730.3%– 32.4%322829Dongfeng180.4%#DIV/0!351090.4%#DIV/0!293730Fiat170.3%– 75.0%301680.7%– 66.1%261431Honda160.3%– 23.8%29850.3%– 20.6%302732Lexus130.3%+ 44.4%34850.3%+ 97.7%313133Land Rover120.2%+ 9.1%32610.2%+ 79.4%343334Subaru120.2%+ 1100.0%37340.1%+ 209.1%363635Alfa Romeo90.2%– 40.0%28700.3%+ 20.7%333236Man80.2%n/a33240.1%+ 700.0%383937DS70.1%– 53.3%38320.1%– 36.0%373538Mini40.1%+ 0.0%36400.2%+ 14.3%353439Hongqi20.0%new –20.0%new46 –40Lynk & Co10.0%– 66.7% –120.0%+ 140.0%393841Ferrari10.0%+ 0.0%4040.0%+ 33.3%414142Voyah10.0%new –30.0%new44 –43Sportequipe10.0%new –10.0%new51 – –Others531.0%+ 1.9% –3571.4%+ 43.4% – –
Slovenia May 2025 – models:
PosModelMay-25%/24Apr2025%/23PosFY241Renault Clio2404.7%+ 45.5%58063.2%+ 2.8%312Renault Captur2104.1%+ 5.0%28653.5%+ 45.6%233Skoda Octavia1833.6%+ 88.7%18803.5%+ 5.8%124VW Tiguan1212.4%– 2.4%84962.0%+ 18.4%895Hyundai Tucson1202.3%+ 51.9%75252.1%+ 41.1%7106Citroen C31192.3%+ 5.3%184892.0%– 0.2%9197Skoda Kodiaq1172.3%+ 31.5%46272.5%+ 27.7%548Dacia Duster1092.1%+ 11.2%114281.7%– 15.1%1269Toyota Yaris Cross1052.1%+ 14.1%153591.4%– 31.2%151210Peugeot 20081042.0%– 23.0%134451.8%– 32.3%11511Skoda Kamiq951.9%– 5.9%37022.8%+ 52.3%4712VW T-Roc891.7%– 18.3%234141.7%– 9.6%131413VW Taigo841.6%– 1.2%93411.4%– 17.6%171514Hyundai i20831.6%+ 118.4%381820.7%– 0.5%374415VW T-Cross781.5%– 45.8%64121.6%– 11.8%14816Tesla Model Y751.5%+ 141.9%521920.8%– 7.7%364117VW Golf731.4%+ 49.0%105502.2%+ 77.4%61118Peugeot 208671.3%– 36.8%194511.8%+ 13.9%101319Ford Tourneo Custom631.2%+ 2000.0%403011.2%+ 652.5%208820VW Passat601.2%– 16.7%172471.0%+ 10.8%263121VW Polo551.1%– 31.3%311570.6%– 34.3%442722Opel Mokka541.1%+ 58.8%731540.6%– 16.8%454623Mazda CX-30531.0%+ 130.4%502220.9%+ 38.8%304324Nissan Qashqai511.0%– 20.3%313201.3%+ 13.5%181825Toyota Corolla511.0%– 40.7%212961.2%– 28.2%211626Opel Corsa491.0%+ 133.3%411940.8%+ 16.9%353527Audi Q3480.9%– 27.3%302330.9%– 2.9%282928Kia Sportage480.9%– 30.4%283071.2%– 12.0%192029Toyota C-HR470.9%+ 95.8%342090.8%+ 18.1%334030Suzuki Vitara450.9%– 8.2%472210.9%– 24.8%313031VW Multivan450.9%– 25.0%163551.4%+ 47.3%162330VW Touran440.9%+ 0.0%122120.8%+ 94.5%323031Kia Ceed420.8%– 6.7%202701.1%+ 109.3%243332Renault Austral420.8%+ 55.6%222711.1%+ 0.4%232233Skoda Karoq420.8%– 2.3%262280.9%+ 0.0%292634Kia Stonic410.8%– 18.0%292711.1%+ 3.8%223135Ford Tourneo Courier400.8%+ 66.7%532661.1%+ 454.2%254936Hyundai Bayon400.8%– 2.4%551460.6%– 24.4%503937Skoda Superb390.8%+ 178.6%82950.4%– 12.0%736038Ford Kuga380.7%+ 52.0%142401.0%– 8.4%272539Toyota Yaris370.7%– 28.8%891110.4%– 47.9%672840Citroen C3 Aircross350.7%+ 34.6%85530.2%– 77.2%1063841Dacia Bigster350.7%new136420.2%new123 –42Hyundai i10350.7%+ 118.8%752020.8%+ 71.2%347343Skoda Elroq350.7%new98800.3%new83 –44Dacia Sandero330.6%– 49.2%451570.6%– 33.2%421745Audi A3320.6%+ 68.4%461170.5%+ 62.5%637646MG ZS EV320.6%– 30.4%251180.5%– 46.6%623747Hyundai Kona300.6%– 30.2%322260.9%+ 10.2%304548VW ID.4300.6%+ 172.7%601570.6%+ 273.8%4311149VW Tayron300.6%new351190.5%new61 –50Forthing T5 Evo290.6%+ 2800.0%372240.9%+ 3100.0%318551Toyota RAV4280.5%+ 27.3%631480.6%– 5.7%485252BMW X1270.5%+ 50.0%331320.5%+ 131.6%557753Citroen C4270.5%+ 8.0%801160.5%– 23.2%646554Ford Focus260.5%+ 136.4%56740.3%– 21.3%868255Peugeot 3008260.5%– 18.8%571370.5%+ 158.5%537556Renault Symbioz250.5%new102830.3%new8216057Skoda Fabia250.5%+ 8.7%301600.6%+ 55.3%405558Toyota Proace250.5%+ 212.5%491510.6%+ 54.1%476460Geely Coolray240.5%+ 50.0%831100.4%+ 197.3%686761VW Caddy240.5%+ 4.3%681070.4%+ 37.2%697462Citroen Berlingo230.4%+ 15.0%421460.6%+ 508.3%496963Ford Puma230.4%+ 155.6%64900.4%– 32.3%786264Hyundai Ioniq 5230.4%+ 283.3%119490.2%+ 69.0%11513865Opel Grandland X230.4%+ 666.7%84850.3%+ 372.2%8016466Suzuki SX4 S-Cross220.4%– 15.4%651590.6%– 24.6%414867Cupra Born210.4%+ 5.0%771670.7%+ 31.5%385068BMW 1 Series200.4%+ 185.7%122580.2%+ 176.2%10117469Jeep Avenger200.4%+ 25.0%361520.6%+ 12.6%465470Kia Xceed200.4%– 25.9%661230.5%– 1.6%585171Mercedes GLC200.4%+ 53.8%671380.6%+ 112.3%528473Opel Frontera200.4%new –200.1%new173 –74Peugeot 308200.4%– 31.0%481320.5%– 25.4%564275Seat Ibiza200.4%– 31.0%81510.2%– 32.0%11111276Audi Q2190.4%– 38.7%71910.4%– 56.3%763677Dacia Jogger190.4%+ 111.1%70900.4%– 13.5%775378Cupra Leon180.4%+ 38.5% –180.1%– 33.3%18223279Ford Transit Custom180.4%+ 1700.0%241600.6%+ 3900.0%3910880Hyundai i30180.4%– 45.5%271350.5%+ 26.2%545781Mercedes V-Class180.4%+ 20.0%145530.2%– 8.6%10810082Opel Astra180.4%– 18.2%116700.3%– 49.6%886683Seat Leon180.4%– 50.0%431400.6%+ 16.7%515884Skoda Scala180.4%+ 20.0%441130.5%+ 15.3%666385Dongfeng Box170.3%new1501060.4%new7020386Audi A5160.3%+ 1500.0%54920.4%+ 441.2%7515587Renault Trafic160.3%– 88.1%105850.3%– 67.9%812188Audi A6150.3%+ 66.7%126430.2%+ 53.6%12114789BMW iX1150.3%+ 87.5%107470.2%+ 0.0%12812090BMW X3150.3%+ 36.4%100450.2%– 11.8%11910491Tesla Model 3150.3%– 75.8%921220.5%– 41.3%603492Audi Q5140.3%+ 100.0%79950.4%+ 39.7%717093BMW 5 Series140.3%+ 40.0%87940.4%+ 54.1%7410294Kia EV3140.3%new124650.3%new9333995Audi Q4130.3%+ 44.4%138260.1%– 38.1%15612596Cupra Terramar130.3%new61860.3%new7924497Renault Megane Conquest130.3%– 43.5%781150.5%+ 5.5%656898Cupra Tavascan120.2%new94680.3%new8918099Mercedes A-Class120.2%+ 300.0%58720.3%+ 118.2%87133100Mitsubishi ASX120.2%+ 300.0%219250.1%– 21.9%162144101Renault 5120.2%new114660.3%new92343102Seat Arona120.2%– 60.0%76550.2%– 48.6%10471103BMW 2 Series110.2%+ 10.0%90540.2%– 34.9%10592104Fiat 600110.2%new97670.3%new90215105Mercedes CLA110.2%– 38.9%99480.2%– 37.7%116105106Porsche 911110.2%+ 450.0%118390.2%+ 34.5%131156107VW ID.7110.2%– 31.3%62790.3%+ 36.2%8491108Audi Q6 e-tron100.2%new166350.1%new139269109Citroen C5 Aircross100.2%– 56.5%110750.3%– 21.9%8583110Lexus LE100.2%+ 233.3%127660.3%+ 214.3%91121111MG 3100.2%new208250.1%new161207112Nissan Juke100.2%+ 11.1%142430.2%+ 26.5%122127113VW ID.3100.2%+ 233.3%146500.2%+ 85.2%11489114Audi Q790.2%+ 350.0%134360.1%+ 414.3%136182115Mazda390.2%+ 80.0%132420.2%– 4.5%124124116MG 490.2%+ 125.0%101520.2%– 10.3%10990117Nissan X-Trail 90.2%+ 28.6%139640.3%+ 39.1%94119118Seat Ateca90.2%– 67.9%194360.1%– 60.9%13880119VW Touareg90.2%– 10.0%88630.3%– 1.6%96107120Alfa Romeo Junior80.2%new69510.2%new110 –121Forthing U-Tour80.2%new151360.1%new137195122Honda CR-V80.2%+ 14.3%140320.1%– 22.0%143135123Kia Picanto80.2%– 71.4%137380.2%– 70.8%13261124Man TGE80.2%n/a120240.1%+ 700.0%164233125Mercedes B-Class80.2%– 52.9%391250.5%+ 115.5%57114126Peugeot 500880.2%n/a109620.2%+ 1140.0%97149127Peugeot Rifter80.2%+ 0.0%185320.1%+ 190.9%144141128Volvo XC9080.2%+ 14.3%147440.2%+ 41.9%120140129VW Caravelle80.2%n/a –80.0%n/a228 –130VW Transporter80.2%– 71.4%214460.2%– 63.2%11856131BMW X270.1%+ 600.0%224220.1%+ 120.0%167188132DS 770.1%– 22.2%176280.1%– 6.7%149146133Hyundai Inster70.1%new51410.2%new126 –134Nissan Townstar70.1%+ 250.0%175220.1%– 8.3%169151135Opel Combo70.1%+ 133.3%130380.2%+ 245.5%135162136Porsche Macan70.1%+ 133.3%156280.1%+ 21.7%153154137Renault Megane70.1%– 78.8%170180.1%– 79.1%18194138Suzuki Swift70.1%– 30.0%95620.2%+ 24.0%9893139Volvo XC6070.1%+ 40.0%111410.2%– 28.1%127110140Audi Q860.1%– 50.0%96410.2%– 4.7%125118141BMW i460.1%– 40.0%141340.1%– 40.4%140115142Ford Tourneo Connect60.1%+ 200.0%207200.1%– 23.1%172132143KG Mobility Tivoli60.1%new135280.1%new151225144Mitsubishi Space Star60.1%– 45.5%121380.2%– 24.0%13495145Range Rover60.1%+ 0.0%162210.1%– 12.5%170153146Skoda Enyaq60.1%– 57.1%91270.1%– 40.0%154131147Subaru Crosstrek60.1%n/a241100.0%+ 400.0%217237148Toyota Aygo X60.1%+ 100.0%128240.1%+ 71.4%165189149BMW M550.1%n/a188130.1%n/a196270150Cupra Formentor50.1%+ 25.0%115340.1%– 58.5%14186151Ford Mustang Mach-E50.1%+ 150.0% –60.0%– 45.5%236198152Geely Starray50.1%new103590.2%new100181153Jeep Compass50.1%+ 0.0%215150.1%– 53.1%193142154Kia Niro50.1%n/a165130.1%+ 333.3%199240155Land Rover Defender50.1%+ 400.0%167280.1%+ 300.0%152190156Mitsubishi Outlander50.1%n/a152100.0%n/a216 –157Renault Espace50.1%+ 66.7%148230.1%– 30.3%166145158Toyota bZ4X50.1%+ 25.0%123320.1%+ 190.9%145196159Audi S540.1%n/a181110.0%+ 1000.0%205278160BMW X440.1%– 71.4%154220.1%– 62.7%168109161BMW X540.1%– 42.9%106390.2%– 32.8%129106162Honda Civic40.1%– 42.9%133190.1%– 36.7%174148163Kia Sorento40.1%– 20.0%221100.0%– 54.5%213168164Mazda CX-6040.1%+ 33.3%157130.1%– 50.0%201152165Mercedes E-Class40.1%– 55.6%155290.1%+ 3.6%147134166Mercedes G-Class40.1%+ 300.0% –70.0%– 12.5%234253167Peugeot 40840.1%+ 33.3%195300.1%– 64.3%146113168Porsche Cayenne40.1%– 50.0%108340.1%– 40.4%142116169Renault Scenic40.1%– 20.0%19780.0%– 77.8%226166170Subaru Forester40.1%n/a179190.1%+ 1800.0%177247171Toyota Land Cruiser40.1%+ 100.0%184500.2%+ 1150.0%113176172Volvo XC4040.1%– 55.6%86620.2%– 27.9%9981173VW California40.1%+ 100.0%113270.1%+ 200.0%155221174BMW 4 Series30.1%– 40.0%203100.0%– 52.4%208184175BMW IX30.1%+ 200.0%149130.1%+ 62.5%171216176BMW M330.1%+ 50.0%163160.1%– 36.0%188157177BMW X630.1%– 72.7%161250.1%– 21.9%160143178Citroen Jumpy30.1%n/a112260.1%+ 2500.0%157317179Fiat Doblo30.1%n/a143460.2%n/a117201180Ford Capri30.1%new19270.0%new232 –181Ford Explorer30.1%n/a187130.1%+ 550.0%197220182Honda Jazz30.1%n/a209100.0%+ 42.9%212213183Mazda230.1%– 66.7%125380.2%– 58.2%13379184Mini Aceman30.1%new236100.0%new215290185VW Crafter30.1%+ 200.0%180160.1%+ 128.6%191223186Audi A120.0%+ 0.0%172160.1%– 27.3%186167187Audi RS320.0%n/a23780.0%+ 300.0%219272188Audi S620.0%n/a –50.0%n/a242295189BMW 7 Series20.0%+ 0.0%20670.0%– 41.7%229212190BMW i520.0%– 75.0%201170.1%+ 6.3%183171191Fiat 500 20.0%– 77.8% –140.1%– 91.9%19524192Hyundai Ioniq 620.0%– 50.0%218110.0%– 15.4%206183193KG Mobility Torres20.0%+ 100.0%93530.2%+ 1225.0%107173194Kia Proceed20.0%+ 0.0% –50.0%– 61.5%244187195Lexus UX20.0%n/a –60.0%+ 50.0%238249196Mazda CX-520.0%– 71.4%160260.1%– 27.8%159123197Mercedes AMG/GT20.0%– 66.7%158390.2%+ 105.3%130159198Mercedes C-Class20.0%+ 0.0%216190.1%– 26.9%175139199Mercedes GLA20.0%– 71.4%117550.2%+ 17.0%103103200Mercedes GLE20.0%+ 100.0%173170.1%– 32.0%184161201MG HS20.0%– 87.5%131500.2%– 25.4%11287202Porsche Panamera20.0%n/a16980.0%n/a224218203Porsche Taycan20.0%– 33.3%24060.0%+ 20.0%240226204Subaru Outback20.0%+ 100.0% –80.0%+ 60.0%227254205Alfa Romeo Stelvio10.0%– 80.0%202110.0%– 26.7%204179206Audi A710.0%n/a –10.0%+ 0.0%313287207Audi S310.0%n/a18980.0%+ 700.0%220252208Audi S710.0%+ 0.0% –10.0%+ 0.0%314306209Audi SQ810.0%+ 0.0%22950.0%– 28.6%243243210BMW M210.0%+ 0.0%199100.0%– 28.6%209194211BMW X710.0%– 66.7%222100.0%– 52.4%211169212BMW XM10.0%n/a18280.0%+ 60.0%221224213BMW Z410.0%n/a23220.0%+ 100.0%266268214BYD Seal10.0%+ 0.0% –10.0%+ 0.0%315336215Citroen C4 X10.0%– 83.3%22070.0%– 69.6%231170216Dacia Spring10.0%– 80.0% –260.1%– 16.1%158136217Dongfeng Huge10.0%new –10.0%new319 –218Ferrari 296 GTS10.0%+ 0.0%25120.0%+ 100.0%269312219Fiat Panda10.0%– 98.2% –280.1%– 88.1%15032220Ford Mustang10.0%n/a21170.0%n/a233250221Geely EX510.0%new –10.0%new320 –222Honda HR-V10.0%– 50.0%129240.1%+ 118.2%163165223Hongqi HS310.0%new –10.0%new321 –224Hongqi HS510.0%new –10.0%new322 –225Jeep Renegade10.0%– 75.0%159180.1%– 5.3%178178226KG Mobility Rexton10.0%– 66.7%22760.0%– 40.0%237217227Lexus NX10.0%– 75.0%226130.1%– 13.3%200158228Lynk & Co 0110.0%– 66.7% –100.0%+ 100.0%214219229Mazda CX-8010.0%new168150.1%new194245230Mercedes CLE10.0%n/a23320.0%– 75.0%272208231Mercedes GLB10.0%– 95.2%200190.1%– 62.0%176126232Mercedes GLS10.0%n/a18380.0%+ 33.3%222248233MG Cyberster10.0%new –10.0%new323 –234MG Marvel R10.0%n/a –10.0%n/a316323235Mini Cooper10.0%+ 0.0%178180.1%– 21.7%180150236Nissan Ariya10.0%n/a –10.0%– 80.0%317256237Peugeot 50810.0%n/a –10.0%– 75.0%318262238Range Rover Evoque10.0%n/a19080.0%+ 166.7%225242239Renault Rafale10.0%new104290.1%new148191240Seat Terraco10.0%– 87.5% –20.0%– 97.5%27797241Sportequipe 610.0%new –10.0%new324 –242Toyota Highlander10.0%– 50.0%225160.1%– 5.9%190186243Volvo EX3010.0%– 75.0%164130.1%– 7.1%202177244Volvo EX9010.0%new24340.0%new254 –245Volvo V6010.0%n/a19350.0%– 16.7%245227246Volvo V9010.0%n/a24440.0%+ 33.3%255265247Voyah Courage10.0%new –10.0%new325 –
Source: ADS SLO
More Stories
Spain February 2026: Seat Ibiza signs first #1 ranking in almost 8 years
The Seat Ibiza is the best-seller at home for the first time since April 2018. The Spanish new car market...
Slovakia January 2026: Suzuki (+76.3%), Opel (+51.4%) defy weak market (-15.4%)
Opel Mokka sales triple year-on-year in January. Only 5,591 new cars found a buyer in Slovakia in January, a poor...
Israel February 2026: Omoda Jaecoo snaps first ever pole position
Omoda Jaecoo is the most popular carmaker in Israel in February. According to data by our local partner cartube.co.il, the...
Rolls-Royce Black Badge Turns 10 and Its Dark Alter Ego Is Just Getting Started
Rolls-Royce is marking 10 years of Black Badge, the in-house alter ego that first arrived in 2016 and quickly became...
Breaking News: Hyundai Faces Class Action Over Alleged Phantom Braking in Tucson Models
A class action lawsuit filed in the US claims certain Hyundai Tucson models suffer from what the complaint describes as...
Hands On with the Economy Fuel Cost Calculator – Review
If there is one topic that unites every Australian driver, it’s the frustration of the bowser. Whether you are planning...