
Poland April 2025: Volvo XC60 up to best ever 4th place
The Volvo XC60 hits a new ranking record in April.
Polish new car sales advance 5.8% year-on-year in April to 46,968 units, leading to a year-to-date volume up 3.3% to 189,064. Toyota (-10.9%) easily retains the brands pole position with 15.7% share, albeit down one percentage point on its YTD level of 16.7%. Skoda (-7.2%) is at 10.5% of the market vs. 9.8% YTD and Volkswagen (-1%) just edges down at #3. Audi (+43.2%), BMW (+33.8%) and Kia (+21.7%) all post fantastic gains below, BMW hitting its highest ranking since March 2024 at #4. Volvo (+7.6%) also makes itself noticed at #8, its highest level in one year. MG (+146.3%), Peugeot (+60.5%) and Cupra (+36.6%) stand out further down.
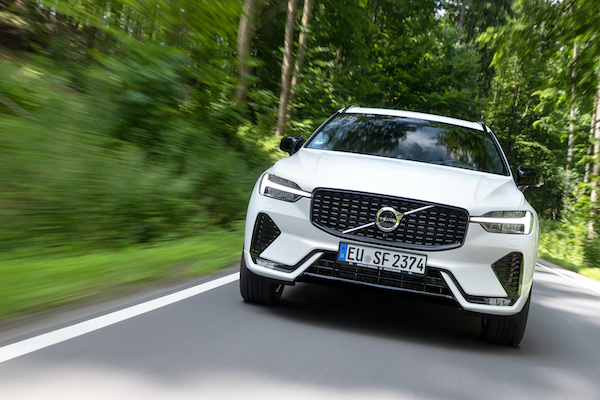
Model-wise, the Toyota Corolla (-27.7%) and Skoda Octavia (-22.9%) stay on top despite drastic falls. 86% of Corollas and 87% of Octavias are sold as fleet. The Toyota C-HR (+4.3%) is up one spot on last month to #3 and the Volvo XC60 (+39.3%) surges to a new all-time best 4th place overall. The Kia Sportage (+24.2%) and Toyota Yaris Cross (+45%) also impress.
Previous month: Poland March 2025: Nissan Qashqai on podium
One year ago: Poland April 2024: Toyota, Mercedes, Volvo highlight robust market
Full April 2025 Top 50 brands and Top 15 models below.
Poland April 2025 – brands:
PosBrandApr-25%/24Mar2025%/24PosFY241Toyota7,36615.7%– 10.9%131,60716.7%– 12.5%112Skoda4,95210.5%– 7.2%218,5649.8%– 7.5%223Volkswagen3,1766.8%– 1.0%313,7077.2%+ 29.9%334BMW2,8766.1%+ 33.8%69,5625.1%+ 2.7%775Kia2,7315.8%+ 21.7%510,9585.8%+ 3.4%446Audi2,6475.6%+ 43.2%410,5435.6%+ 23.4%567Mercedes2,4185.1%– 9.8%98,7894.6%– 0.0%888Volvo2,1924.7%+ 7.6%117,2113.8%+ 2.3%9119Hyundai2,0724.4%– 10.5%89,7175.1%– 1.5%6510Dacia1,7693.8%+ 11.0%126,5403.5%+ 5.5%10911Renault1,3953.0%– 22.4%76,4143.4%– 0.2%111012Ford1,2192.6%– 1.8%154,9312.6%+ 12.7%131313MG1,1752.5%+ 146.3%144,2242.2%+ 247.6%15n/a14Cupra1,1282.4%+ 36.6%163,9992.1%+ 13.1%161415Lexus1,0552.2%+ 6.1%136,0683.2%+ 40.4%121216Peugeot8411.8%+ 60.5%173,3401.8%– 10.2%17n/a17Opel7071.5%– 6.0%182,6051.4%– 27.7%19n/a18Citroen6291.3%+ 43.3%192,4211.3%– 23.9%20n/a19Suzuki6011.3%– 24.1%202,8091.5%– 19.4%18n/a20Omoda5651.2%new231,7580.9%new23n/a21Mazda5411.2%– 55.6%241,8881.0%– 49.8%221522Nissan5341.1%+ 21.9%104,5252.4%+ 9.2%14n/a23Jaecoo4611.0%new261,6630.9%new24n/a24BAIC4040.9%+ 461.1%301,2600.7%+ 549.5%27n/a25Seat3780.8%– 16.7%271,6230.9%– 6.8%25n/a26Porsche3750.8%– 22.0%251,3490.7%– 26.1%26n/a27Honda3680.8%+ 37.3%211,8911.0%+ 53.1%21n/a28Land Rover3440.7%+ 43.3%311,0030.5%+ 47.7%30n/a29BYD3240.7%#######338550.5%n/a33n/a30Jeep2740.6%+ 5.4%329720.5%+ 5.5%31n/a31Mini2560.5%+ 32.0%299570.5%+ 6.0%32n/a32Alfa Romeo2050.4%+ 89.8%347060.4%+ 40.1%34n/a33Tesla2030.4%– 18.5%221,1020.6%– 27.2%28n/a34Leapmotor1670.4%new382230.1%new39 –35KGM1430.3%– 21.0%281,0410.6%+ 22.3%29n/a36Fiat1170.2%– 51.0%376110.3%– 25.2%35n/a37Mitsubishi960.2%– 54.7%364620.2%– 43.9%37n/a38Forthing720.2%+ 3500.0%392260.1%n/a38n/a39Subaru640.1%– 36.6%354990.3%+ 12.6%36n/a40DS560.1%– 3.4%401810.1%– 13.4%40n/a41Ferrari140.0%+ 75.0%47340.0%+ 30.8%41n/a42Lamborghini100.0%+ 100.0%45230.0%+ 0.0%45n/a43Bentley70.0%– 41.7%41280.0%– 26.3%42n/a44Jaguar60.0%– 60.0%43230.0%– 68.9%44n/a45DFSK60.0%n/a49190.0%+ 375.0%46n/a46MAN40.0%+ 100.0%48140.0%+ 55.6%47n/a47Aston Martin30.0%+ 0.0%44240.0%+ 71.4%43n/a48Maserati30.0%– 57.1%50120.0%– 45.5%50n/a49Xpeng20.0%new42120.0%new48 –50Abarth10.0%– 92.9%46120.0%– 57.1%49n/a
Poland April 2025 – models:
Note: This ranking features the Top 15 models year-to-date ordered based on their April sales data and may therefore not be 100% accurate.
PosModel Apr-25%/24Mar2025%/24PosFY241Toyota Corolla1,7053.6%– 27.7%17,4964.0%– 28.0%112Skoda Octavia1,5263.2%– 22.9%26,1473.3%– 19.5%223Toyota C-HR1,2162.6%+ 4.3%45,7433.0%+ 18.4%344Volvo XC601,1702.5%+ 39.3%63,9282.1%+ 54.3%6165Kia Sportage1,1462.4%+ 24.2%54,5942.4%+ 5.9%466Toyota Yaris Cross9792.1%+ 45.0%74,0322.1%– 29.6%537Toyota Yaris9482.0%– 23.9%83,8192.0%– 18.4%758Toyota RAV48491.8%– 30.1%153,0331.6%– 28.3%1089Hyundai Tucson7701.6%– 6.7%103,5851.9%– 14.3%8710Dacia Duster7581.6%– 5.5%92,8341.5%– 7.4%13911VW T-Roc6951.5%+ 18.2%122,9401.6%+ 24.1%111012Skoda Superb6421.4%– 6.7%112,3591.2%+ 17.6%151113VW Tiguan6251.3%– 29.7%132,3681.3%– 0.5%141514Lexus NX4150.9%– 7.8%142,8991.5%+ 96.9%121915Nissan Qashqai3960.8%+ 29.8%33,0971.6%+ 6.0%921
Source: SAMAR


More Stories
Top 5 Brands for Tailor-Made Car Accessories
Your vehicle deserves accessories that match your unique style and specific needs. While mass-produced car accessories serve basic functions, tailor-made...
How Car Finance Protects Your Buying Power in 2026
For many UK buyers, financing a vehicle isn’t just a way to “afford” a better car. It can be a deliberate choice to keep cash...
Hyundai Venus and Earth Concepts Signal a Bold New Ioniq Future for China
Hyundai has never been shy about taking a design risk, but the new Venus and Earth concepts feel like a...
A Chance To Win Tickets To The Wonderful Concours des Légendes 2026
We are delighted to offer you, our readers, another exciting competition. Are you signed up to our newsletter here, and...
How CGI Transforms Automobile Design & Prototyping
Car design has always depended on a mix of imagination, engineering, and revision. A sketch can set the direction, but...
Small Cars, Big Value: Suzuki’s Guide to Affordable Driving
Looking for big value in a small package? Our guide to affordable driving breaks down why our small cars are...