
Romania April 2025: Market down -24.7%
Dacia Duster sales are down -27.9% year-on-year despite a new generation.
It’s a mediocre month for new car sales in Romania with April off -24.7% year-on-year to 9,996 units. To be fair, April 2024 was up 34.6% on the year prior. Year-to-date volumes are off -6.1% to 43,688. Local behemoth Dacia (-40.3%) falls significantly faster than its home market to 23.3% share vs. 28% so far this year. Toyota (-27.8%) is also in trouble but notches a round 10% share vs. 8.9% year-to-date. Skoda (-13.6%) and Volkswagen (-20%) resist better than the market but are still in deep negative. BMW (+16.2%) and Mercedes (+7.8%) swim upstream and end of the month at #8 and #6 respectively.
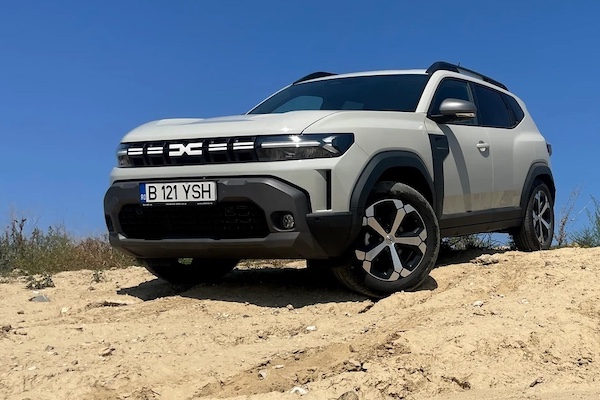
The Dacia Duster (-27.9%) threepeats at #1, cementing its year-to-date lead at 9.3% share (-13.9%). The Dacia Logan (-45.4%) is stuck in 2nd place but loses less ground than the Duster year-to-date (-5.4%). As a reminder, in 2024 the Duster was #1 year-to-date up until September when the Logan retook the lead to finally end the year at #1 for the 20th consecutive time. The Sandero (-31.9%) means the podium is back to being 100% Dacia. The Toyota Corolla (-26.7%) is the best of the rest at #4 while the Skoda Octavia (-33.9%), #3 last month, falls to #5. Outstanding performances by the Hyundai Tucson (+62%), Renault Clio (+27.2%) and Ford Kuga (+15%) in the remainder of the Top 10. After appearing in the charts two months ago, the Dacia Bigster is still only #68 at home.
Previous month: Romania March 2025: Dacia Duster keeps Logan at bay, sales up 8.4%
One year ago: Romania April 2024: Dacia Logan claws back on top in surging market
Full April 2025 Top 47 All brands and Top 265 All models below.
Romania April 2025 – brands:
PosBrandApr-25%/24Mar2025%/24PosFY241Dacia2,32523.3%– 40.3%112,22628.0%– 10.0%112Toyota99710.0%– 27.8%23,9038.9%– 2.3%223Skoda8428.4%– 13.6%33,4818.0%+ 1.9%334Volkswagen6576.6%– 20.0%43,1957.3%+ 14.6%465Renault5695.7%– 30.0%62,5715.9%– 5.1%556Mercedes5095.1%+ 7.8%81,8524.2%– 1.1%887Hyundai4995.0%– 31.2%52,2965.3%– 15.4%648BMW4884.9%+ 16.2%91,7374.0%+ 0.6%999Ford4864.9%– 31.5%72,0684.7%+ 5.2%7710Suzuki3223.2%– 44.5%101,4223.3%– 12.2%101011Kia3183.2%– 21.1%111,0602.4%– 24.1%111112Audi2422.4%+ 38.3%168872.0%+ 0.5%121213MG2082.1%+ 100.0%148481.9%+ 193.4%131714Mazda2052.1%– 23.2%157091.6%– 18.9%161315Peugeot1972.0%+ 95.0%127931.8%+ 3.7%151616SsangYong1801.8%– 19.6%138281.9%– 7.7%141417Cupra991.0%+ 62.3%193240.7%+ 28.6%202318Citroen920.9%– 15.6%184000.9%– 7.4%172419Volvo880.9%– 11.1%173980.9%– 7.2%181820Tesla700.7%– 65.9%252900.7%– 76.3%211521Seat700.7%+ 22.8%311370.3%– 44.5%282522Jeep670.7%+ 52.3%203440.8%+ 96.6%192223Land Rover540.5%+ 1.9%222050.5%– 1.4%232624Geely430.4%new231490.3%new264125Porsche420.4%– 42.5%241690.4%– 31.6%242726Nissan410.4%– 59.8%292090.5%– 41.5%221927Honda410.4%– 58.2%271680.4%– 41.7%252028Opel380.4%– 67.0%211340.3%– 52.7%292129Mini330.3%+ 10.0%301300.3%+ 12.1%303130Fiat320.3%+ 45.5%281140.3%– 46.5%312831DS260.3%+ 188.9%39500.1%+ 72.4%353432Lexus220.2%– 12.0%321040.2%– 11.9%323033Mitsubishi210.2%– 61.8%34620.1%– 56.0%342934Alfa Romeo180.2%+ 100.0%38680.2%+ 25.9%333235Subaru150.2%+ 400.0%41280.1%+ 33.3%383636BAIC70.1%+ 40.0%36200.0%+ 53.8%393737Bentley60.1%+ 50.0%35290.1%+ 31.8%374038Forthing60.1%+ 200.0%43140.0%+ 75.0%414639Lynk & Co40.0%new37150.0%new405140Rolls-Royce40.0%+ 33.3%46120.0%– 20.0%424341Lamborghini40.0%– 20.0%42110.0%– 21.4%433842Leapmotor30.0%new261380.3%new274743DFSK20.0%n/a33440.1%+ 780.0%364444Aston Martin10.0%n/a4090.0%+ 80.0%454945Lotus10.0%n/a4920.0%+ 100.0%505946McLaren10.0%n/a5020.0%n/a515347GAC10.0%n/a –10.0%n/a58 –
Romania April 2025 – models:
PosModelApr-25%/24Mar2025%/24PosFY241Dacia Duster8868.9%– 27.9%14,0739.3%– 13.9%122Dacia Logan6786.8%– 45.4%23,8008.7%– 5.4%213Dacia Sandero5585.6%– 31.9%42,3455.4%+ 5.7%334Toyota Corolla3383.4%– 26.7%61,1142.5%+ 5.0%565Skoda Octavia2963.0%– 33.9%31,5243.5%+ 8.4%446Ford Kuga2452.5%+ 15.0%71,0282.4%+ 49.2%7137Renault Clio2432.4%+ 27.2%149042.1%+ 51.9%11118Toyota RAV42292.3%– 19.6%51,0452.4%+ 18.9%699Hyundai Tucson2222.2%+ 62.0%81,0222.3%+ 28.2%9710Toyota Yaris Cross1661.7%– 14.4%186611.5%+ 29.6%121511Dacia Jogger1581.6%– 53.8%129172.1%– 19.0%10512Suzuki SX4 S-Cross1511.5%– 23.4%106441.5%– 0.2%132213Kia Sportage1461.5%– 34.8%95431.2%– 30.4%161014Skoda Kodiaq1451.5%+ 15.1%155101.2%+ 3.9%172315VW Tiguan1271.3%+ 21.0%115921.4%+ 116.1%152416Skoda Scala1271.3%+ 23.3%164171.0%– 3.9%232517Kia Ceed1201.2%+ 34.8%322650.6%– 7.7%375618VW Golf1181.2%+ 0.9%136431.5%+ 63.6%141619Suzuki Vitara1061.1%– 54.3%195011.1%– 23.5%181820Mercedes GLC1031.0%+ 15.7%303700.8%+ 37.0%253821Mazda CX-30971.0%+ 19.8%273150.7%+ 38.8%324522Ssangyong Korando951.0%– 1.0%204281.0%+ 2.1%223223VW T-Cross940.9%– 30.4%243460.8%+ 12.7%282924MG ZS930.9%+ 50.0%234391.0%+ 190.7%193925BMW X1910.9%+ 167.6%572120.5%+ 57.0%516326Skoda Kamiq890.9%– 10.1%452920.7%+ 2.5%343627Toyota C-HR860.9%– 64.0%372870.7%– 64.0%351728VW Taigo850.9%– 38.0%174381.0%– 17.7%201929Ford Puma820.8%– 66.5%423360.8%– 47.3%301230Renault Arkana820.8%– 28.7%342640.6%– 14.8%393431Peugeot 208810.8%+ 224.0%901380.3%– 12.7%715932Hyundai i30800.8%– 53.2%283760.9%– 9.0%242133VW Passat800.8%+ 90.5%532410.6%+ 162.0%437334Mercedes GLE780.8%– 18.8%383390.8%– 23.1%293335Skoda Karoq780.8%– 12.4%352490.6%– 22.9%424236Hyundai Kona770.8%– 23.0%253570.8%+ 2.3%263137Mazda3730.7%+ 32.7%292380.5%+ 38.4%455538Toyota Yaris720.7%– 6.5%313520.8%+ 67.6%274139VW Touareg700.7%+ 45.8%263190.7%+ 76.2%315840Renault Austral670.7%– 40.7%472060.5%– 40.5%532741Skoda Fabia610.6%– 23.8%462250.5%– 4.7%474742Ford Transit Custom610.6%+ 2950.0%442390.5%+ 2072.7%4410643Audi A3590.6%+ 293.3%631680.4%+ 0.0%626744Jeep Avenger590.6%+ 5800.0%502780.6%+ 2216.7%367045BMW 1 Series580.6%+ 314.3%551800.4%+ 76.5%5611046BMW X5570.6%– 12.3%611810.4%– 23.9%554847MG 3570.6%new861560.4%new6414048Tesla Model Y560.6%+ 9.8%1211110.3%– 74.0%814449Ford Focus550.6%– 69.1%412090.5%– 50.0%523550Peugeot 3008550.6%+ 1275.0%482140.5%+ 92.8%508451MG HS540.5%+ 74.2%492160.5%+ 176.9%484952Hyundai i20490.5%– 61.4%402540.6%– 34.2%402653BMW 4 Series470.5%+ 327.3%772140.5%+ 262.7%4914354Renault Captur450.5%– 37.5%224371.0%+ 30.4%212855Cupra Formentor450.5%– 11.8%591800.4%+ 1.1%575256Skoda Superb430.4%+ 87.0%362540.6%+ 56.8%415357Renault Mégane410.4%– 75.2%333030.7%– 40.2%331458Suzuki Swift410.4%– 46.1%641780.4%+ 21.1%596959Mercedes GLA410.4%+ 51.9%811450.3%+ 8.2%667760Audi Q7400.4%+ 3900.0%1061000.2%+ 455.6%8713961Cupra Terramar400.4%new80980.2%new9130562BMW 3 Series380.4%– 52.5%731420.3%– 49.1%685163Toyota Camry380.4%+ 52.0%511390.3%+ 61.6%709064Toyota Land Cruiser 150/200380.4%+ 111.1%661320.3%+ 51.7%7414465Audi Q8380.4%+ 245.5%881330.3%+ 125.4%739266Seat Arona370.4%+ 311.1%111620.1%+ 44.2%11413767Mercedes C Class360.4%+ 176.9%871000.2%+ 35.1%8810468Dacia Bigster360.4%new172680.2%new109 –69Ssangyong Tivoli350.4%+ 400.0%392320.5%+ 3.6%463770Renault Symbioz350.4%new651000.2%new9019071Peugeot 2008340.3%– 19.0%212640.6%+ 106.3%384672Mercedes A Class340.3%+ 100.0%96760.2%– 13.6%10511173BMW X6330.3%– 13.2%701440.3%– 16.8%676674BMW 5 Series330.3%+ 32.0%671190.3%+ 77.6%7810975BMW X3320.3%+ 18.5%561680.4%+ 12.0%637476Mercedes V Class320.3%+ 100.0%791160.3%+ 36.5%809877Kia Xceed300.3%– 34.8%601410.3%– 10.8%696278Volvo XC60300.3%– 26.8%691310.3%– 19.6%756479Hyundai i10300.3%+ 57.9%761160.3%– 19.4%796580Audi A5300.3%+ 900.0%921050.2%+ 600.0%8320281Nissan Qashqai290.3%– 54.0%931010.2%– 46.6%865482Fiat 600270.3%new82790.2%new10217483Volvo XC40260.3%+ 100.0%95870.2%– 10.3%989784Citroen Jumpy/Spacetourer260.3%n/a161480.1%+ 4700.0%13023985Hyundai Bayon250.3%– 62.7%117860.2%– 64.5%995786Citroen C3250.3%– 13.8%62970.2%– 47.8%927987Mercedes G Class250.3%– 10.7%711000.2%+ 1.0%898688Ssangyong Torres250.3%– 10.7%112790.2%– 24.8%1039189Mercedes E Class250.3%– 3.8%751020.2%+ 17.2%8510090Volvo XC90250.3%+ 19.0%89900.2%+ 8.4%948391Mercedes CLA250.3%+ 31.6%98830.2%+ 20.3%10012192VW T-Roc240.2%– 81.5%431710.4%– 36.2%615093Mercedes GLB240.2%+ 0.0%108690.2%– 11.5%10810194Peugeot 308240.2%+ 200.0%1041490.3%– 15.8%659395Ssangyong Rexton230.2%– 75.3%102870.2%– 41.6%979496Mini230.2%+ 43.8%91880.2%+ 11.4%9611497Geely Coolray230.2%new84930.2%new9323598Citroen C4220.2%– 59.3%741980.5%+ 62.3%548199Porsche Cayenne220.2%– 43.6%101890.2%– 35.0%9580100Opel Corsa210.2%– 65.0%170510.1%– 60.8%12868101DS 4210.2%+ 950.0%183270.1%+ 125.0%170250102Mercedes Vito200.2%– 37.5% –200.0%– 75.9%178126103Suzuki Swace200.2%– 31.0%116610.1%– 6.2%116116104Geely Starray200.2%new100560.1%new120 –105VW Polo190.2%– 5.0%521790.4%– 44.6%5840106Audi Q3190.2%+ 26.7%1101040.2%+ 26.8%8489107Audi A6190.2%+ 1800.0%119760.2%+ 181.5%104131108BMW 7 Series180.2%+ 5.9%97820.2%+ 30.2%101127109Seat Ateca180.2%+ 80.0%152410.1%– 39.7%138146110BMW 2 Series Tourer180.2%+ 157.1%155330.1%– 15.4%152165111Range Rover Sport170.2%+ 21.4%94740.2%+ 37.0%106120112Toyota Highlander170.2%+ 70.0%85630.1%– 36.4%11282113Ford Tourneo Custom170.2%+ 112.5%721200.3%+ 566.7%77156114Renault Rafale170.2%new115700.2%new107197115Range Rover 160.2%+ 0.0%127610.1%– 10.3%115117116Honda HR-V150.2%– 42.3%129490.1%– 27.9%129105117Citroen C5 Aircross150.2%+ 114.3%140270.1%– 20.6%169199118Alfa Romeo Junior140.1%new196510.1%new124275119Renault 5140.1%new –140.0%new194 –120Tesla Model 3130.1%– 91.3%781750.4%– 77.8%6020121Honda Civic130.1%– 68.3%134570.1%– 26.0%11885122Mazda CX-60130.1%– 35.0%113510.1%– 48.0%127103123VW Caddy130.1%– 13.3%1031060.2%+ 130.4%82122124Seat Leon130.1%– 13.3%154310.1%– 65.9%162107125VW Multivan130.1%+ 44.4%139260.1%– 16.1%173168126BMW X7120.1%– 52.0%176340.1%– 61.8%150119127Audi Q3 Sportback120.1%– 47.8%83560.1%– 45.1%11987128Mitsubishi ASX120.1%– 25.0%149350.1%– 5.4%148138129Renault Kangoo120.1%+ 50.0%105630.1%+ 186.4%111166130BMW X2120.1%+ 71.4%125510.1%+ 240.0%125169131Cupra Leon120.1%+ 100.0%148350.1%– 37.5%147134132BMW X4110.1%– 56.0%207280.1%– 56.9%167118133Mercedes S Class110.1%– 47.6%126440.1%– 38.9%133112134Land Rover Defender110.1%+ 0.0%136390.1%+ 2.6%141159135Mercedes EQA100.1%– 41.2%145310.1%– 39.2%160132136Audi Q5100.1%– 28.6%123620.1%– 18.4%113102137Hyundai Santa Fe100.1%+ 233.3%137510.1%+ 88.9%126149138Mazda CX-80100.1%new160480.1%new131258139Dacia Spring90.1%– 96.6%541,0222.3%– 31.4%88140Renault Megane E-Tech90.1%– 82.7%1891280.3%– 13.5%7688141Mazda290.1%– 66.7%169380.1%– 43.3%14399142Ford Tourneo Courier90.1%– 57.1%99540.1%+ 54.3%123113143Porsche 91190.1%– 40.0%130360.1%+ 2.9%145178144Kia Stonic90.1%– 35.7%114440.1%+ 25.7%132108145BMW i490.1%– 18.2%166340.1%– 43.3%149124146Kia Sorento90.1%+ 50.0%120380.1%+ 100.0%142217147Audi Q5 Sportback90.1%+ 50.0%180250.1%– 26.5%174151148Mercedes CLE90.1%+ 80.0%157290.1%+ 93.3%166163149Lexus LBX90.1%new198180.0%new182210150Subaru Forester90.1%n/a215130.0%+ 225.0%196277151Toyota Aygo X80.1%– 75.8%133550.1%– 61.5%12175152Opel Mokka80.1%– 55.6%58600.1%+ 13.2%11778153Opel Grandland X80.1%– 46.7%241150.0%– 44.4%191204154Mini Countryman80.1%– 27.3%141320.1%+ 0.0%157153155VW Tayron80.1%new175130.0%new197 –156Lexus NX70.1%– 22.2%118400.1%– 13.0%139154157Honda CR-V60.1%– 64.7%164190.0%– 81.7%18076158Nissan Juke60.1%– 53.8%233310.1%– 27.9%161129159Range Rover Evoque60.1%– 25.0%179160.0%– 38.5%188175160BMW 2 Series 60.1%+ 0.0%143300.1%– 33.3%164147161Mercedes Sprinter60.1%+ 0.0%177170.0%– 46.9%185170162Mercedes AMG GT60.1%+ 500.0%147230.1%+ 155.6%176212163Nissan X-Trail50.1%– 77.3%122400.1%– 63.6%14095164Honda ZR-V50.1%– 54.5%156330.1%+ 10.0%153142165Lexus RX50.1%– 44.4%167310.1%– 26.2%159133166Mercedes GLS50.1%– 28.6%144420.1%– 25.0%136128167DS 7 Crossback50.1%– 28.6%249220.1%+ 46.7%177211168Mercedes EQE50.1%– 16.7%124330.1%– 21.4%154150169Bentley Continental GT50.1%+ 150.0%158190.0%+ 171.4%179279170BMW iX150.1%+ 150.0%190140.0%– 48.1%192167171Forthing 450.1%+ 150.0%223100.0%+ 66.7%206269172Porsche Panamera50.1%n/a217110.0%+ 266.7%201252173Renault Trafic40.0%– 95.6%142380.1%– 90.2%14430174Suzuki Ignis40.0%– 90.7%132310.1%– 68.0%16396175Jeep Compass40.0%– 89.5%153410.1%– 66.4%13772176Porsche Macan40.0%– 76.5%138250.1%– 51.0%175152177BMW XM40.0%– 63.6%165320.1%– 17.9%156162178Volvo EX3040.0%– 55.6%135550.1%+ 103.7%122123179Ford Mustang Mach-E40.0%– 50.0%23690.0%– 75.7%211171180Mitsubishi Eclipse Cross40.0%+ 0.0%212170.0%– 45.2%186172181Lamborghini Urus40.0%+ 33.3%182110.0%+ 10.0%199259182Fiat Tipo40.0%+ 300.0%159300.1%+ 275.0%165200183Ford Capri40.0%new162150.0%new190349184Subau Crosstrek 40.0%n/a –70.0%+ 133.3%230302185Baic BJ3040.0%new27850.0%new245 –186Mazda CX-530.0%– 95.8% –80.0%– 96.9%22161187Peugeot 40830.0%– 82.4%146140.0%– 75.0%193155188Mercedes EQB30.0%– 57.1%168170.0%– 32.0%184184189Ford Mustang30.0%– 50.0%197130.0%+ 85.7%195216190VW ID.330.0%– 25.0%231640.1%– 5.9%110141191Audi Q230.0%+ 0.0%24380.0%– 46.7%215238192Jeep Wrangler30.0%+ 50.0%191190.0%+ 11.8%181192193Mercedes T-Class30.0%+ 200.0% –70.0%– 12.5%227253194Lynk & Co 0130.0%new188120.0%new198301195Skoda Elroq30.0%new20660.0%new239 –196Mitsubishi Outlander30.0%n/a –30.0%n/a282 –197Audi A420.0%– 96.8%151310.1%– 85.4%15860198Hyundai Ioniq 520.0%– 77.8% –40.0%– 95.8%263130199MG420.0%– 75.0%22890.0%– 76.9%212125200Citroen C4 X20.0%– 71.4%17180.0%– 74.2%217186201Mitsubishi Colt20.0%– 71.4%18470.0%– 56.3%228173202Ford Transit20.0%– 71.4%23540.0%– 86.7%261224203Kia Picanto20.0%– 66.7%21180.0%– 65.2%219219204Alfa Romeo Stelvio20.0%– 66.7%25360.0%– 60.0%235228205Mercedes Maybach GLS20.0%– 60.0%199110.0%+ 120.0%200243206Seat Ibiza20.0%– 50.0%25940.0%– 42.9%267198207Ford Explorer20.0%– 33.3%150270.1%+ 200.0%171181208MG EHS20.0%– 33.3%131270.1%+ 28.6%172189209Honda Jazz20.0%– 33.3%185100.0%+ 42.9%207236210Land Rover Discovery Sport20.0%– 33.3%24280.0%– 20.0%220220211BMW i720.0%– 33.3%24660.0%– 66.7%236249212BMW iX20.0%+ 0.0%210100.0%– 58.3%205208213Subaru Outback20.0%+ 0.0%21470.0%+ 16.7%229268214Rolls-Royce Spectre20.0%+ 0.0% –60.0%– 14.3%238281215Rolls-Royce Cullinan20.0%+ 100.0%21850.0%+ 0.0%251310216Leapmotor T0320.0%new681340.3%new72272217DFSK E520.0%new107430.1%new134314218Citroen e-C320.0%new220150.0%new189397219Toyota bZ4X20.0%n/a192110.0%– 45.0%202203220Mini Aceman20.0%new200100.0%new208326221Cupra Tavascan20.0%new26370.0%new226337222Baic BJ6020.0%new20550.0%new246 –223Hyudai Inster20.0%new26750.0%new248 –224Alfa Romeo Giulia20.0%n/a –40.0%– 33.3%260287225Mercedes Maybach S Class 20.0%n/a25430.0%– 40.0%281300226Ssanyong KG Mobility Actyon20.0%new –20.0%new293 –227Fiat 50010.0%– 93.8%22750.0%– 97.5%24771228Ford Tourneo Connect10.0%– 93.3% –60.0%– 86.4%237177229Kia Rio10.0%– 88.9% –50.0%– 90.6%249160230Toyota Proace City Verso10.0%– 88.9%23250.0%– 78.3%252185231Volvo V6010.0%– 87.5%20950.0%– 75.0%254201232BAIC X7510.0%– 75.0%22180.0%+ 60.0%216246233Opel Astra10.0%– 75.0%20880.0%– 57.9%223188234Kia Proceed10.0%– 75.0% –30.0%– 76.9%278225235Tesla Model X10.0%– 75.0%27330.0%– 40.0%285263236Toyota GR Yaris10.0%– 66.7%22270.0%+ 75.0%231285237Hyundai Ioniq 610.0%– 66.7% –30.0%– 84.2%277182238Jeep Renegade10.0%– 66.7%23920.0%– 91.7%290214239VW ID.5 10.0%– 66.7% –10.0%– 97.1%308221240Mercedes EQV10.0%– 50.0%20280.0%+ 100.0%222308241Toyota Prius10.0%– 50.0%26840.0%– 55.6%268254242Nissan Ariya10.0%– 50.0% –30.0%– 57.1%283229243Porsche 718 Cayman10.0%– 50.0% –30.0%– 70.0%284255244Mercedes EQS10.0%+ 0.0%178180.0%– 5.3%183205245BMW i510.0%+ 0.0%193100.0%– 9.1%204226246Bentley Bentayga10.0%+ 0.0%25090.0%– 18.2%210270247Range Rover Velar10.0%+ 0.0%20440.0%– 55.6%266237248Hyundai Staria10.0%new173160.0%new187 –249Volvo EX9010.0%new163110.0%new203 –250Audi Q610.0%new26190.0%new209306251Ford Bronco10.0%n/a18180.0%+ 60.0%218231252Mercedes Citan Tourer10.0%n/a –50.0%n/a250 –253Volvo EC4010.0%new22450.0%new253 –254Forthing 510.0%n/a25540.0%+ 100.0%262343255Leapmotor C1010.0%new22540.0%new264369256Porsche Taycan10.0%n/a21640.0%– 50.0%265261257VW Crafter10.0%n/a –40.0%+ 300.0%269345258Land Rover Discovery10.0%n/a27130.0%+ 0.0%279291259Lynk & Co 0210.0%new22630.0%new280 –260Lexus LM 10.0%n/a –20.0%n/a291402261McLaren 750S Coupe10.0%n/a27620.0%n/a292406262Aston Martin Vanquish S10.0%n/a –10.0%n/a305 –263GAC Aion10.0%new –10.0%new306 –264Lotus Eletre10.0%n/a –10.0%+ 0.0%307371265VW Transporter10.0%n/a –10.0%n/a309 –
Source: DRPCIV
More Stories
Powerful Reasons Mercedes-AMG’s Latest GT Project Matters More Than You Think
From its base in Affalterbach, Mercedes-AMG has, recently, lifted the lid on a striking new direction for its GT line-up....
Top 5 Brands for Tailor-Made Car Accessories
Your vehicle deserves accessories that match your unique style and specific needs. While mass-produced car accessories serve basic functions, tailor-made...
How Car Finance Protects Your Buying Power in 2026
For many UK buyers, financing a vehicle isn’t just a way to “afford” a better car. It can be a deliberate choice to keep cash...
Hyundai Venus and Earth Concepts Signal a Bold New Ioniq Future for China
Hyundai has never been shy about taking a design risk, but the new Venus and Earth concepts feel like a...
A Chance To Win Tickets To The Wonderful Concours des Légendes 2026
We are delighted to offer you, our readers, another exciting competition. Are you signed up to our newsletter here, and...
How CGI Transforms Automobile Design & Prototyping
Car design has always depended on a mix of imagination, engineering, and revision. A sketch can set the direction, but...