
Taiwan April 2025: Sales down -11.2%, CMC J Space up to record #2
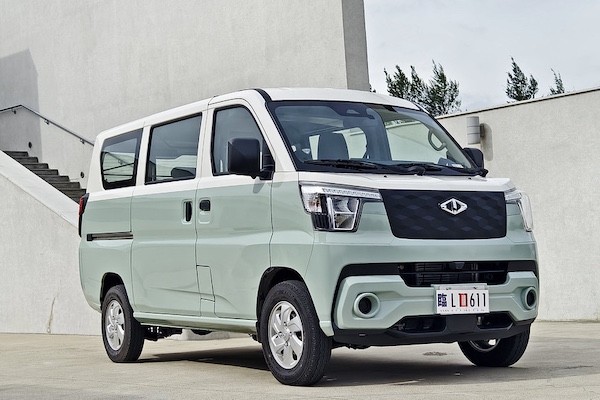
The CMC J Space is the 2nd best-selling vehicle in Taiwan in April.
Another difficult month for Taiwanese new vehicle sales with April at -11.2% year-on-year to 32,876 units. The year-to-date volume is also down -11.2% to 132,736. Brand leader Toyota (+3.8%) defies the negative context to an overwhelming 30.4% share vs. 32% so far this year. Lexus (-0.9%) and Mercedes (-3.7%) both contain their loss to close out the podium whereas CMC (+44.8%) and BMW (+13.8%) both post splendid year-on-year gains. Kia (+15.4%) is the only additional Top 12 member in positive, just as Nissan (-48.8%), Mazda (-41.7%) and Mitsubishi (-27.3%) crumble.
Model-wise, the Toyota Corolla Cross (+41.2%) sails into the distance at 9.7% share. It is followed this month by the new CMC J Space up to a record 2nd place. The Toyota RAV4 (+3.6%) is down to #3 as a result, distancing the Toyota Town Ace (-13.8%) and Yaris Cross (-19%), both in trouble. The Mercedes GLC (+53%) repeats at a fantastic 7th place, a ranking it also holds year-to-date. The Ford Kuga (+2.8%) is up to #10 and the Toyota Camry (+147.1%) up to #12.
Previous month: Taiwan March 2025: CMC (+32.7%), Toyota (+19.8%) defy struggling market
One year ago: Taiwan April 2024: MG HS repeats at #3, Luxgen n7 up to #6
Full April 2025 Top 12 brands and Top 50 models below.
Taiwan April 2025 – brands:
PosBrandApr-25%/24Mar2025%/24PosFY241Toyota9,98630.4%+ 3.8%142,42732.0%+ 8.0%112Lexus2,4777.5%– 0.9%211,0908.4%+ 10.6%223Mercedes2,3447.1%– 3.7%59,3157.0%+ 4.0%344CMC2,2836.9%+ 44.8%38,7526.6%+ 23.9%475BMW1,8975.8%+ 13.8%75,7024.3%+ 5.0%666Hyundai1,7325.3%– 15.1%65,6724.3%– 33.1%757Honda1,4594.4%– 17.1%46,6915.0%– 28.0%538Ford1,1473.5%– 18.4%104,1883.2%– 14.1%9n/a9Mitsubishi1,0233.1%– 27.3%94,2233.2%– 17.4%8910Kia1,0213.1%+ 15.4%133,5692.7%– 6.2%12n/a11Nissan9512.9%– 48.8%124,0683.1%– 41.7%108n/aMazda6422.0%– 41.7%113,8052.9%– 18.3%1112n/aTesla1630.5%n/a82,7992.1%+ 29.2%1311
Taiwan April 2025 – models:
PosModelApr-25%/24Mar2025%/24PosFY241Toyota Corolla Cross3,2029.7%+ 41.2%113,73210.3%+ 45.7%112CMC J Space1,6875.1%new36,2244.7%new3503Toyota RAV41,6264.9%+ 3.6%27,4665.6%+ 18.4%234Toyota Town Ace1,5214.6%– 13.8%45,8434.4%– 17.1%425Toyota Yaris Cross1,1493.5%– 19.0%55,5354.2%– 1.1%546Lexus NX9522.9%– 4.7%84,3803.3%+ 2.4%667Mercedes GLC Class6962.1%+ 53.0%73,2022.4%+ 34.4%7128Mitsubishi Delica6201.9%– 11.3%112,2531.7%– 13.7%10139Toyota Corolla Altis6181.9%– 35.2%93,1092.3%– 21.1%8710Ford Kuga5821.8%+ 2.8%161,8191.4%+ 116.3%132311Honda CR-V5481.7%– 35.1%63,0962.3%– 39.3%9512Toyota Camry5191.6%+ 147.1%311,3341.0%+ 54.2%233413Hyundai Tucson5111.6%– 23.6%331,3801.0%– 56.9%221114Honda HR-V4811.5%+ 7.1%131,7571.3%– 20.7%141815CMC Zinger4801.5%– 20.3%122,1151.6%– 27.8%121416Lexus RX4711.4%– 12.3%172,2181.7%+ 11.2%112117Toyota Alphard4211.3%n/a251,2270.9%n/a26n/a18Ford Focus4031.2%– 31.3%141,6861.3%– 34.3%161619Hyundai Porter3811.2%– 0.3%151,2621.0%+ 80.3%243320Lexus UX3701.1%+ 11.8%201,6961.3%+ 25.5%153121Nissan Kicks3681.1%– 37.7%261,3911.0%– 29.6%211922Toyota Vios3381.0%– 16.3%221,6111.2%– 10.0%172423Mercedes E Class3020.9%+ 22.8%n/a8310.6%+ 4.5%413924Hyundai Venue3000.9%+ 27.7%391,1000.8%– 3.3%293225Honda Fit2980.9%– 13.1%181,5461.2%– 2.4%192026BMW X32970.9%n/an/a4200.3%n/an/an/a27Nissan Sentra2910.9%– 32.6%381,0710.8%– 35.9%323028Hyundai Custin2830.9%– 49.1%191,2370.9%– 42.0%252829Suzuki Jimny2820.9%+ 54.1%n/an/an/an/an/an/a30Kia Sportage2790.8%– 11.7%231,0870.8%– 40.9%312631Luxgen n72710.8%– 74.3%321,3911.0%– 10.5%201532Lexus LM2570.8%+ 89.0%379280.7%+ 26.4%39n/a33MG HS2480.8%– 84.8%291,0960.8%– 81.5%30934Lexus LBX2470.8%– 9.2%429700.7%+ 50.2%364135Suzuki Swift2430.7%– 0.8%301,0100.8%– 5.7%344036Mercedes V Class2110.6%+ 18.5%n/a5430.4%– 12.7%49n/a37Kia Picanto2110.6%+ 142.5%n/an/an/an/an/an/a38Mini Countryman2060.6%n/an/a2560.2%n/an/an/a39BMW 1 Series2050.6%+ 286.8%n/a6280.5%+ 168.4%47n/a40BMW 2 Series2010.6%+ 53.4%n/a4620.3%+ 58.2%n/an/a41Mercedes GLE Class1990.6%– 11.2%n/a8050.6%+ 9.8%424642BMW X21930.6%+ 132.5%48n/an/an/an/an/a43Mercedes GLA Class1910.6%– 55.5%n/a5210.4%– 44.1%50n/a44Mazda CX-301900.6%+ 12.4%278680.7%+ 19.7%404245Skoda Octavia1860.6%– 36.5%435960.4%– 33.5%484446MG ZS1850.6%– 63.2%n/a2870.2%– 88.1% n/a2947Porsche Macan1750.5%n/a401,0310.8%n/a33n/a48Mazda31750.5%– 7.4%349760.7%+ 0.5%353749Hyundai Staria1710.5%n/an/an/an/an/an/an/a50Nissan X-Trail1660.5%– 77.1%211,1860.9%– 52.9%2717
Source: u-car.com.tw
More Stories
UK January 2026: Jaecoo 7 up to #2
The Jaecoo 7 is only outsold by the Kia Sportage in January. The UK new car market is up 3.4%...
Finland January 2026: Tesla Model Y and Toyota Yaris Cross lead, Mercedes CLA in Top 10 again
The Mercedes CLA ranks #9 in Finland this month. Yet more worries for new car sales in Finland at -5.1%...
Argentina January 2026: Ford Territory repeats at record #4
The Territory is Ford’s best-seller in Argentina in January. The Argentinean new vehicle market drops -5.3% year-on-year in January to...
Brazil January 2026: BYD, GWM, Omoda hit records, market up 2.1%
The Dolphin Mini is the #1 BEV in Brazil and helps BYD to a record 6% share. 162,779 new light...
Venezuela Full Year 2025: JAC topples Toyota to 40.9% share, market up 119.9%
This content is for members only. Visit the site and log in/register to read.
GM and Allison Patch Things Up as Allison Badges Return to 2026 Silverado HD and Sierra HD
If you followed the drama around GM’s heavy-duty trucks last fall, you probably assumed the Allison name was headed for...