New Zealand March 2025: Ford Ranger claws back on top, BYD Shark 6 at #13
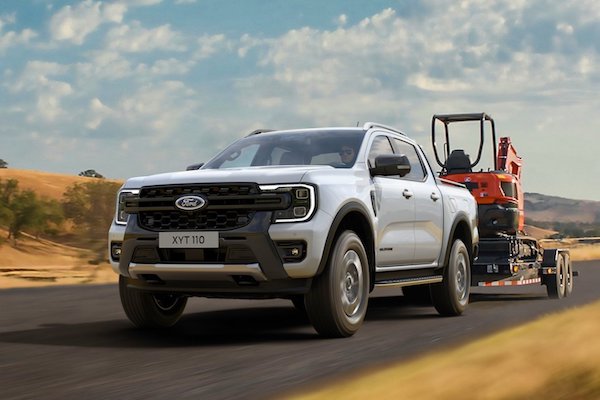
The Ford Ranger is the best-selling vehicle in New Zealand in March.
New vehicle sales in New Zealand edge up 2.6% year-on-year in March to 11,913, a poor showing given March 2024 was off -27.3% on the year prior, which itself was down -24% on March 2022… The Q1 volume is down -3.1% to 32,815. Toyota (+7.6%) is solid in first place in the brands ranking at 21.6% share, followed by Mitsubishi (-12%), Ford (-21.6%) and Kia (-12.1%) all faring miserably. In contrast Honda (+74.5%), Mazda (+50.5%), MG (+31.6%) and Nissan (+20.9%) all shine in the remainder of the Top 10. BYD (+449%) is once again the most dynamic near the top but slips out of the Top 10 at #12.
Model-wise, the Ford Ranger (-29.6%) reclaims the top spot off the Toyota RAV4 (-10.9%) for the first time this year and for just four sales. The Toyota Hilux (+9.5%) is solid at #3 and keeps the Ranger stuck at #3 year-to-date, with the RAV4 still leading the way by far. The Mitsubishi Triton (-28.3%) is back up to #4 but in freefall year-on-year while the Nissan Navara (+31.2%) makes it four pickup trucks in the Top 5. Mitsubishi also places the ASX (+18.2%) at #6 and the Outlander (+11.4%) at #7. The Toyota Corolla is back up to #9, its first Top 10 finish since last November, and is rewarded with a spot in the Q1 Top 20. After repeating at #10, the BYD Shark 6 is down to a still very respectable #13 this month.
Previous month: New Zealand February 2025: BYD Shark 6 repeats at #10
One year ago: New Zealand March 2024: Mitsubishi (+76.6%) defies devastated market
Full March 2025 Top 73 All brands and Top 20 models below.
New Zealand March 2025 – brands:
PosBrandMar-25%/24Feb2025%/24PosFY241Toyota2,57121.6%+ 7.6%17,33022.8%+ 4.7%112Mitsubishi1,31011.0%– 12.0%23,27410.2%– 17.7%233Ford 1,1059.3%– 21.6%33,0149.4%– 38.8%324Kia8517.1%– 12.1%42,3837.4%+ 7.5%445Nissan6725.6%+ 20.9%61,4934.6%– 3.2%566Honda5554.7%+ 74.5%81,1863.7%+ 21.5%7107Mazda4323.6%+ 50.5%91,0893.4%+ 15.6%988Suzuki4073.4%+ 5.7%71,3224.1%– 6.4%659MG4043.4%+ 31.6%51,1543.6%+ 59.0%81110Hyundai3072.6%– 22.7%147812.4%– 21.8%12711GWM2942.5%– 7.8%119022.8%+ 1.1%111212BYD2692.3%+ 449.0%109182.9%+ 628.6%102213Subaru2101.8%+ 42.9%166041.9%+ 22.8%141514BMW2091.8%+ 7.7%185351.7%+ 18.4%161615Volkswagen1931.6%– 30.1%136532.0%– 29.0%13916Mercedes1711.4%– 25.0%125531.7%– 8.0%151417Lexus1591.3%+ 21.4%174051.3%+ 12.8%181718Tesla1451.2%– 27.1%202640.8%– 30.2%221819Isuzu1441.2%– 25.0%154901.5%– 36.8%171320Audi1321.1%+ 9.1%262770.9%– 17.3%212021Land Rover1201.0%– 17.2%233020.9%– 16.8%192122LDV1110.9%+ 184.6%192940.9%+ 62.4%202623Mini980.8%+ 10.1%242510.8%+ 34.2%242324Skoda930.8%– 17.7%212600.8%– 13.6%231925Omoda900.8%+ 2900.0%282160.7%+ 7100.0%253326Polestar770.6%+ 1000.0%221870.6%+ 1068.8%294427Peugeot680.6%+ 30.8%292110.7%+ 17.2%262928Jaecoo670.6%new271970.6%new284229Porsche610.5%+ 79.4%361840.6%+ 4.5%303230Fuso560.5%– 58.2%301410.4%– 49.1%312431KGM/SSangyong530.4%+ 51.4%252000.6%+ 98.0%273132Hino420.4%– 8.7%341340.4%+ 2.3%322833Volvo380.3%+ 5.6%321120.3%+ 19.1%343434Scania360.3%– 36.8%311120.3%– 35.6%332735Cupra350.3%+ 40.0%37790.2%– 16.0%393636Chevrolet320.3%+ 146.2%53600.2%– 34.8%423837Jaguar270.2%– 3.6%39850.3%+ 34.9%384638Fiat260.2%– 27.8%331010.3%– 51.7%352539Jeep250.2%+ 47.1%35880.3%+ 63.0%374540Renault240.2%+ 50.0%45600.2%– 17.8%434341Iveco210.2%– 30.0%40750.2%– 41.4%403042Volvo Trucks200.2%– 23.1%41510.2%– 49.5%443743Mahindra180.2%– 66.0%44900.3%– 42.7%363544Kenworth180.2%– 10.0%38650.2%– 22.6%414145Ram130.1%– 35.0%47400.1%– 50.0%454046DAF120.1%– 60.0%46380.1%– 60.4%463947Foton120.1%– 20.0%48320.1%– 15.8%474848Leapmotor120.1%new42280.1%new497449CRRC60.1%– 57.1%49170.1%– 66.7%514950Zhongtong60.1%n/a59110.0%+ 450.0%597051UD Trucks50.0%– 82.1%43290.1%– 60.3%484752JAC50.0%n/a57150.0%+ 650.0%526853Ineos50.0%– 37.5%52140.0%– 41.7%535454Aston Martin40.0%– 50.0%66180.1%+ 28.6%506055Cadillac40.0%new –40.0%new72 –56Lamborghini30.0%+ 200.0%67110.0%+ 83.3%565657Alfa Romeo20.0%– 50.0%63110.0%+ 0.0%555158Bentley20.0%+ 100.0%6890.0%+ 12.5%606259Can-Am20.0%+ 0.0%5090.0%– 10.0%616160Smart20.0%new5180.0%new62 –61Ferrari20.0%– 50.0%5560.0%– 40.0%635862Freightliner20.0%n/a6450.0%+ 66.7%647563Shacman20.0%+ 100.0%6150.0%+ 150.0%677864International20.0%+ 0.0%6540.0%– 60.0%696465MAN20.0%– 50.0% –30.0%– 81.3%745366Citroen10.0%– 80.0%54130.0%– 40.9%545567Sinotruk10.0%– 75.0%6050.0%– 58.3%685768Mack10.0%– 66.7%7140.0%– 50.0%706369Yutong10.0%n/a –20.0%– 80.0%766670FAW10.0%new –10.0%new777971Sany10.0%n/a –10.0%n/a789172Terex10.0%n/a –10.0%n/a799273Geely10.0%new –10.0%new80 –
New Zealand March 2025 – models:
PosModelMar-25%/24Feb2025%/24PosFY241Ford Ranger 7096.0%– 29.6%31,7875.6%– 48.0%312Toyota RAV47055.9%– 10.9%12,4447.6%+ 30.3%123Toyota Hilux6695.6%+ 9.5%21,8845.9%– 3.9%234Mitsubishi Triton4884.1%– 28.3%61,0053.1%– 30.4%445Nissan Navara3833.2%+ 31.2%137162.2%+ 3.9%8116Mitsubishi ASX3643.1%+ 18.2%79332.9%+ 1.3%757Mitsubishi Outlander3523.0%+ 11.4%49933.1%+ 3.0%568Kia Seltos2952.5%– 9.2%59412.9%+ 24.0%679Toyota Corolla2191.8%n/a204191.3%n/a191210Suzuki Swift1881.6%– 2.1%116141.9%– 10.1%9811MG ZS1851.6%+ 0.0%85441.7%+ 18.8%101812Mazda CX-51761.5%+ 46.7%164311.3%+ 9.4%161613BYD Shark 61691.4%new105391.7%new11 –14Toyota Corolla Cross1671.4%– 7.7%144321.3%– 22.0%152115Ford Everest1651.4%+ 52.8%194941.5%– 22.0%121016Kia Stonic1611.4%– 50.8%184761.5%– 19.5%131717Toyota Hiace1571.3%+ 46.7%174211.3%– 19.5%181518Nissan Qashqai1411.2%+ 28.2%n/an/an/an/an/an/a19Toyota Highlander1381.2%+ 318.2%n/an/an/an/an/a2020Nissan X-Trail1361.1%+ 11.5%124291.3%+ 19.2%17n/an/aGWM Haval H61271.1%n/an/a3611.1%n/a21n/an/aMG 31211.0%n/a153781.2%n/a20n/an/aToyota Prado1100.9%n/a94501.4%n/a14n/an/aFord Transit1090.9%– 14.2%223061.0%– 22.9%n/a19n/aIsuzu D-Max740.6%– 8.6%212700.8%– 37.6%n/an/a
Source: MIA


