
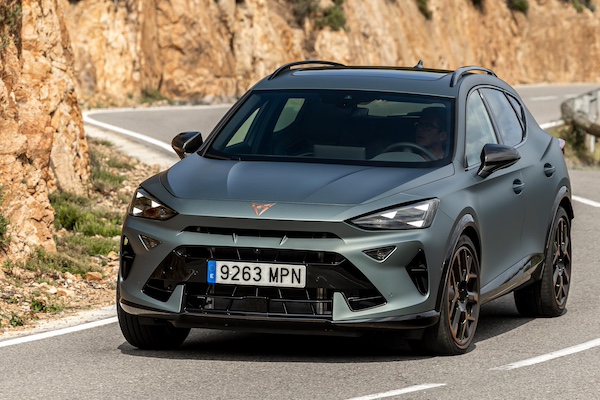
Germany March 2025: Cupra (+128.5%) up to record 6th place
The Cupra Formentor is up to an all-time high 5th place in Germany in March.
253,497 new cars hit German roads in March, a -3.7% year-on-year fall. The Q1 volume is off -4.3% to 664,571. 42,521 BEVs found a buyer this month, up 35.5% over March 2024. Over Q1, it’s 112,968 BEVs that left German dealerships, up 38.9%.
Leaders Volkswagen (+5.7%) and Mercedes (+1.6%) defy the negative market with year-on-year lifts to 20.1% and 8.7% share respectively, yet this is below their YTD levels of 20.8% and 9.1%. BMW (-2.4%) remains in third position with 8.2% share, distancing Skoda (+13.6%) and Audi (+2.4%). The best performer this month is once again Cupra (+128.5%) smashing all its records: ranking at #6 (previous best #10 in January and February 2025), volume at 9,617 (previous best 6,530 in June 2024) and share at 3.8% (previous best 3% last month). And that’s without the Leon as the Cupra/Seat split is unavailable for that model. Tesla is down -42.5% for the month and -62.2% over Q1.
Over in the models charts, the Top 4 is 100% Volkswagen like last month and over Q1. The Golf (-37%) collapses but stays #1 for just 9 units above the T-Roc (+10.7%). The Tiguan (+22.8%) is once again lifted by the new generation, distancing a stable Passat (-0.1%). The surprise of the month is delivered by the Cupra Formentor (+48.9%) up 7 spots on February to a record #5 (previous best #9 in June 2024). The BMW X1 (+45.1%) also excels and repeats at #6, with the Seat Leon (+2.8%) and Fiat Ducato (+9.3%) also in positive in the remainder of the Top 10. Outstanding showing once again for the VW ID.7 (+1150%) albeit down five spots on last month to #13. The VW Tayron (#27) tops recent launches just above the Cupra Terramar (#28).
Previous month: Germany February 2025: Volkswagen’s EVs surge as Tesla sinks -73.3%
One year ago: Germany March 2024: Mitsubishi, Citroen shoot up, VW Golf distant leader
Full March 2025 Top 60 All brands and Top 363 All models below.
Germany March 2025 – brands:
PosBrandMar-25%/24Feb2025%/24PosFY241Volkswagen50,93520.1%+ 5.7%1138,35320.8%+ 6.4%112Mercedes22,0578.7%+ 1.6%260,5769.1%– 4.0%223BMW20,8578.2%– 2.4%354,1648.2%+ 1.1%334Skoda18,5477.3%+ 13.6%550,1147.5%+ 2.6%445Audi17,6086.9%+ 2.4%448,1447.2%+ 2.6%556Cupra9,6173.8%+ 128.5%1021,6193.3%+ 115.2%9187Opel9,5813.8%– 26.1%724,1563.6%– 35.0%768Ford8,7523.5%– 17.5%625,8183.9%+ 0.5%689Hyundai7,7773.1%– 16.3%920,0823.0%– 11.5%101010Seat7,5923.0%– 24.4%822,2253.3%– 14.6%8711Toyota7,3862.9%– 14.6%1218,4482.8%– 16.0%11912Dacia6,9142.7%+ 13.7%1317,4632.6%– 5.9%121113Peugeot6,0082.4%+ 12.6%1415,5612.3%+ 4.2%141314Renault5,9592.4%+ 45.7%1613,9032.1%+ 44.7%151615Mazda5,2922.1%– 5.5%1810,6201.6%– 9.9%181916Volvo5,1912.0%– 11.4%1116,2352.4%+ 5.6%131417Fiat5,0762.0%– 21.6%1910,2861.5%– 36.2%191518Nissan4,8921.9%+ 13.1%219,3771.4%+ 1.8%202319Kia4,6311.8%– 30.8%1513,8872.1%– 19.2%161220Citroen4,4271.7%– 42.7%1711,6521.8%– 26.3%171721Porsche3,2271.3%– 20.8%207,9611.2%– 34.6%212122Suzuki2,6591.0%– 17.3%226,0960.9%– 10.5%232523Mini2,4881.0%– 26.0%236,7031.0%– 18.0%222224Tesla2,2290.9%– 42.5%254,9350.7%– 62.2%262025MG Roewe2,1000.8%+ 34.7%245,4980.8%+ 23.8%242626Mitsubishi1,7880.7%– 66.9%265,1190.8%– 50.3%252427Land Rover1,2420.5%+ 0.9%283,3340.5%+ 1.7%272828Jeep1,2080.5%+ 13.3%273,3190.5%+ 5.4%282929Honda1,0080.4%+ 25.7%301,9870.3%+ 11.1%293030BYD8050.3%+ 403.1%381,2250.2%+ 211.7%313731Alfa Romeo7130.3%+ 30.1%291,9340.3%+ 19.8%303132Subaru4590.2%+ 5.3%331,0810.2%– 8.5%333333Lexus3870.2%+ 13.5%321,0800.2%+ 13.0%343234Polestar3570.1%+ 0.0%358550.1%+ 35.5%363535DS3530.1%+ 36.3%311,1470.2%+ 69.2%323436Leapmotor3320.1%new376730.1%new385537SsangYong2450.1%+ 2.5%368070.1%+ 52.6%373838Smart2400.1%– 84.0%341,0110.2%– 74.0%352739Ferrari1880.1%– 13.0%404590.1%– 17.4%404040Xpeng1760.1%new394320.1%new415041Man1680.1%+ 22.6%433640.1%+ 12.0%434142Lamborghini1630.1%+ 34.7%413700.1%+ 6.9%424243Genesis 1540.1%+ 73.0%462590.0%+ 36.3%444344GWM1340.1%– 56.4%425740.1%+ 2.0%393645Iveco950.0%– 16.7%442340.0%– 10.0%454446Maserati810.0%+ 68.8%531490.0%+ 23.1%494647Jaguar550.0%– 82.6%481670.0%– 78.1%463948Alpine520.0%– 3.7%541490.0%+ 0.0%484849Bentley460.0%– 38.7%451640.0%– 10.9%474550Ineos390.0%– 7.1%50850.0%– 53.6%524751Rolls-Royce320.0%– 5.9%471010.0%+ 13.5%505352Lotus320.0%+ 68.4%52980.0%+ 55.6%515253NIO210.0%– 56.3%51640.0%– 37.3%534954Maxus130.0%+ 333.3%59220.0%+ 57.1%585955Morgan110.0%+ 120.0%58190.0%+ 35.7%596156Vinfast90.0%+ 50.0%55550.0%+ 175.0%545657Lucid 70.0%+ 40.0%56350.0%+ 218.2%565158Cadillac60.0%– 45.5%57280.0%– 34.9%575759Lynk & Co30.0%n/a49360.0%+ 414.3%556060Aston Martin20.0%– 92.0% –40.0%– 94.7%6054 –Others1,0710.4%+ 100.6% –3,2530.5%+ 35.1% – –
Germany March 2025 – models:
PosModelMar-25%/24Feb2025%/24PosFY241VW Golf7,3222.9%– 37.0%122,0003.3%– 30.6%112VW T-Roc7,3132.9%+ 10.7%219,2012.9%+ 21.3%223VW Tiguan6,2412.5%+ 22.8%318,2342.7%+ 9.7%334VW Passat4,6711.8%– 0.1%412,5481.9%+ 1.3%455Cupra Formentor4,4171.7%+ 48.9%129,5611.4%+ 25.2%8216BMW X13,9991.6%+ 45.1%69,7671.5%+ 41.1%787Opel Corsa3,8581.5%– 0.6%79,4871.4%– 5.4%978Skoda Octavia3,7981.5%– 15.9%511,6941.8%– 10.8%549Seat Leon3,7281.5%+ 2.8%910,5461.6%+ 4.2%6910Fiat Ducato3,5761.4%+ 9.3%296,8501.0%+ 9.5%202711Audi A63,4671.4%+ 98.2%137,7101.2%+ 99.1%152912BMW 5er3,4031.3%+ 63.1%118,8191.3%+ 75.7%122813VW ID.73,2251.3%+ 1150.0%89,3361.4%+ 1786.1%106914BMW 3er3,1701.3%– 13.5%217,3501.1%– 18.3%171115Mercedes GLC3,0801.2%+ 19.8%109,1071.4%+ 23.5%111516Dacia Sandero2,9341.2%+ 13.1%227,2801.1%– 11.7%191717Opel Astra2,8331.1%– 28.1%246,6931.0%– 42.2%25618VW Transporter2,8231.1%– 14.4%158,1451.2%– 13.7%131219VW T-Cross2,8181.1%+ 20.2%386,8221.0%+ 14.1%222220Audi A32,7181.1%– 8.1%167,2931.1%– 7.3%181821VW ID.4, ID.52,5931.0%+ 15.3%147,7781.2%+ 84.1%143922Toyota Yaris/Cross2,5391.0%+ 10.8%355,9880.9%+ 4.8%321323Mini All2,4881.0%– 26.0%256,7031.0%– 18.0%231424Skoda Kodiaq2,4281.0%+ 27.5%196,6941.0%+ 32.1%243225Audi A52,3970.9%+ 147.9%275,7660.9%+ 144.6%348026Skoda Enyaq2,3920.9%+ 98.5%287,3931.1%+ 88.5%163027VW Tayron2,3710.9%new1672,6270.4%new8536128Cupra Terramar2,3470.9%new673,9950.6%new5525029VW Polo2,3350.9%– 3.7%336,5831.0%– 22.4%261030Skoda Fabia2,3320.9%– 11.0%325,8960.9%– 20.7%332431Skoda Karoq2,3010.9%+ 4.7%306,0920.9%– 23.8%311632Mercedes C-Klasse 2,2160.9%+ 3.8%186,3701.0%– 13.4%272533Mercedes E-Klasse 2,2150.9%+ 14.4%266,1910.9%+ 8.0%293134Nissan Qashqai2,2060.9%+ 11.4%754,0640.6%– 2.4%518235BMW 4er2,1640.9%– 12.1%315,4840.8%– 6.5%363436VW ID.32,1520.8%+ 81.5%236,1740.9%+ 140.7%304937VW Taigo2,1110.8%– 26.4%485,2070.8%– 19.9%382638Ford Transit Custom2,0410.8%+ 76.9%206,2840.9%+ 186.8%289439Skoda Kamiq1,9870.8%+ 2.3%415,1550.8%– 10.0%393340BMW 1er1,9330.8%+ 31.0%464,8510.7%+ 13.9%415241Dacia Duster1,8980.7%+ 12.0%514,5160.7%– 3.4%454142Mercedes V-Klasse/EQV1,8470.7%+ 53.7%405,7440.9%+ 33.5%354443Volvo XC601,8380.7%– 21.0%176,8281.0%+ 13.6%213744Cupra Born1,7530.7%+ 41.1%395,2410.8%+ 117.3%376245VW Caddy1,7420.7%+ 13.9%435,1470.8%+ 21.1%405346Audi Q31,6490.7%– 6.3%564,0690.6%– 24.0%504347Mercedes A-Klasse 1,6290.6%+ 4.6%533,5310.5%– 17.4%655748Hyundai Tucson1,5790.6%– 39.0%504,1880.6%– 21.2%483849Opel Mokka1,5410.6%– 4.2%624,0160.6%– 24.5%544050Suzuki Swift1,5400.6%+ 83.1%613,3720.5%+ 33.7%6710151Mazda CX-301,5400.6%+ 46.2%793,1800.5%+ 48.5%7010052Ford Kuga1,4990.6%– 24.2%494,0310.6%– 30.9%534253Skoda Superb1,4620.6%+ 46.2%763,6870.6%+ 16.5%606154Dacia Jogger1,4350.6%+ 27.8%603,7910.6%+ 1.6%576655Seat Arona1,4320.6%– 9.8%424,2680.6%+ 12.9%475456Tesla Model Y1,4280.6%– 56.0%663,4420.5%– 68.8%661957Ford Focus1,4220.6%– 24.8%344,5120.7%– 17.3%463658Mercedes CLA-Klasse1,4160.6%– 13.1%703,1470.5%– 20.6%716059BMW 2er1,4060.6%– 34.6%454,0870.6%– 27.7%495060BMW X31,3610.5%– 44.2%474,7300.7%– 26.2%422361Peugeot 2081,3590.5%+ 36.3%544,5470.7%+ 104.5%446362Kia Ceed/Xceed1,3260.5%– 41.2%643,7770.6%– 34.9%584763Volvo XC401,3170.5%+ 2.9%523,2980.5%+ 18.5%688664Hyundai i101,3100.5%+ 24.2%583,6240.5%+ 21.9%616765Audi Q51,3060.5%+ 20.8%444,6460.7%+ 33.3%435866Peugeot 20081,2970.5%+ 31.1%713,1120.5%– 5.8%726867VW Touran1,2900.5%– 17.3%693,5650.5%– 25.8%644868Toyota Aygo X1,2870.5%– 30.1%553,5900.5%– 27.0%625669Renault Clio1,2870.5%+ 68.7%743,2210.5%+ 67.6%698770Mercedes GLA1,2680.5%+ 7.4%733,0020.5%– 9.3%757571Toyota Corolla/Cross1,2430.5%– 29.3%812,6330.4%– 35.4%845972Seat Ibiza1,2380.5%– 32.2%593,5720.5%– 21.5%634573Audi Q41,2200.5%+ 9.4%373,9060.6%+ 13.9%567874Citroen C3/C3 Aircross1,2030.5%– 68.0%782,7770.4%– 56.1%806475Seat Ateca1,1730.5%– 49.9%633,7700.6%– 33.2%593576Nissan Juke1,1620.5%+ 28.0%1351,9570.3%+ 5.8%10712077Porsche 9111,1590.5%– 15.6%862,8260.4%– 22.4%789678Hyundai Kona1,1480.5%– 21.9%822,7440.4%– 22.7%817379Skoda Elroq1,1320.4%new1281,8650.3%new11135280Mazda CX-601,1140.4%+ 27.8%1101,8940.3%– 1.1%10912381Peugeot 30081,1040.4%+ 4.6%1062,3100.3%– 26.2%939182Cupra Tavascan1,1000.4%new772,8220.4%new7921183Renault 51,0700.4%new982,0730.3%new10224484Mercedes Sprinter1,0450.4%+ 13.2%922,3150.3%+ 5.2%9210585Audi A11,0360.4%+ 2.1%723,0770.5%+ 33.9%737486Opel Grandland X1,0280.4%– 54.4%653,0540.5%– 49.4%745187Audi Q21,0130.4%+ 3.3%682,8940.4%– 7.5%777088Citroen Jumper1,0070.4%– 21.5%1002,1410.3%– 9.7%999789Toyota C-HR9990.4%+ 3.1%1132,1470.3%– 17.1%988890Kia Sportage9900.4%– 33.0%962,7110.4%– 34.9%826591Renault Austral9590.4%+ 484.8%1251,9800.3%+ 114.3%10611292BMW X59550.4%– 22.0%952,6360.4%– 15.4%837693Hyundai i209510.4%– 29.0%902,3020.3%– 34.8%968494Audi Q69500.4%+ 691.7%882,4090.4%+ 1154.7%8717095Mercedes CLE9300.4%+ 247.0%932,3080.3%+ 178.7%9411496Ford Puma9200.4%– 59.1%364,0360.6%– 31.4%525597Mitsubishi Space Star9050.4%– 64.8%892,4000.4%– 53.0%887298VW ID.Buzz8800.3%+ 78.1%912,0130.3%+ 101.1%10414199Renault Captur8790.3%+ 136.3%1142,0130.3%+ 121.5%103115100Mercedes EQA8700.3%– 29.9%852,3160.3%– 16.3%9185101Ford Transit, Tourneo8610.3%– 52.0%1021,8850.3%– 38.0%11092102MG 38610.3%+ 28600.0%941,7340.3%+ 57700.0%115185103Citroen C5 X/Aircross8440.3%– 30.1%572,9650.4%– 6.5%7693104Hyundai Inster8380.3%new1311,6800.3%new120365105Mercedes GLE8280.3%– 40.4%972,3410.4%– 52.5%9077106Kia EV38060.3%new1151,7160.3%new117275107Peugeot 3087880.3%– 9.7%832,3510.4%– 5.2%8979108Ford Explorer7760.3%+ 2251.5%1161,5880.2%+ 1317.9%127169109Tesla Model 37680.3%+ 40.9%1431,4080.2%– 21.3%138117110Nissan X-Trail7660.3%+ 0.3%1441,5610.2%– 8.4%129134111Hyundai i307650.3%– 37.4%1041,9960.3%– 35.0%10571112Mazda27630.3%– 41.6%1361,5330.2%– 36.2%132107113Mazda CX-57230.3%– 43.2%1381,4310.2%– 50.5%13790114Porsche Cayenne7200.3%– 31.3%1171,7280.3%– 48.8%11698115Fiat 500 lineup7150.3%– 73.7%2149820.1%– 88.3%15346116Skoda Scala7140.3%– 23.3%1201,6360.2%– 31.6%124102117Audi Q86740.3%– 24.4%872,3020.3%+ 2.8%95133118Porsche Macan6700.3%– 29.2%1241,6480.2%– 35.7%122118119Volvo XC906620.3%– 1.3%842,2510.3%– 4.1%9799120Jeep Avenger6620.3%+ 60.3%1211,6390.2%+ 52.9%123140121BMW X26610.3%+ 17.4%1111,8030.3%+ 125.9%113122122Hyundai Ioniq56600.3%+ 26.7%1071,7060.3%+ 15.7%118113123Kia Picanto6530.3%– 24.5%802,4210.4%+ 41.5%8695124Mercedes EQB6440.3%+ 21.3%1051,8600.3%+ 45.7%112110125Suzuki Vitara6390.3%– 26.9%1011,6680.3%+ 18.6%121121126Mercedes B-Klasse6340.3%– 12.7%1302,0970.3%+ 7.3%101108127VW Touareg6100.2%+ 34.4%1121,5950.2%+ 12.1%126119128Mercedes GLB5970.2%+ 13.1%1092,1340.3%+ 15.4%100111129Mercedes G-Klasse5950.2%+ 26.3%1181,9160.3%+ 1.1%108124130Peugeot 50085720.2%– 18.2%1621,0640.2%– 50.8%149131131Citroen C4/C4 X5560.2%– 59.4%1471,3850.2%– 61.6%13981132Volvo EX305540.2%– 11.5%1221,5580.2%– 7.6%130103133Volvo S/V605470.2%– 1.8%1031,4740.2%– 10.0%136109134Toyota bZ4X5460.2%+ 42.2%991,7710.3%+ 159.7%114214135BMW Z45410.2%+ 13.7%1519820.1%+ 21.2%152165136Mercedes Vito5340.2%– 39.4%1271,4840.2%– 40.8%135106137Fiat 6005290.2%+ 1553.1%1231,5610.2%+ 976.6%128153138Audi Q75020.2%+ 428.4%1341,5360.2%+ 179.3%131150139Mercedes Citan4880.2%+ 28.8%1261,5330.2%+ 14.7%133146140Mercedes EQE4680.2%– 49.5%1191,6960.3%– 31.6%119104141Mazda34560.2%+ 34.1%1391,1200.2%+ 27.4%146156142Citroen Jumpy4500.2%+ 484.4%1321,1450.2%+ 512.3%145189143Dacia Spring4380.2%– 33.9%1501,6250.2%– 14.7%125157144Alfa Romeo Junior4340.2%new1371,1460.2%new144289145Ford Transit Connect4290.2%– 21.9%1331,2610.2%– 11.9%141128146MG ZS4270.2%– 52.3%1541,3460.2%+ 4.7%140158147Ford Transit Courier4150.2%+ 58.4%1461,0850.2%+ 158.3%147154148Mitsubishi Colt3950.2%+ 15.2%1661,4940.2%+ 1.8%134139149MG RX63930.2%+ 85.4%1876630.1%+ 26.0%174186150Toyota RAV43810.2%– 19.3%1529780.1%– 40.2%154127151MG 43760.1%+ 46.9%1081,2360.2%– 38.5%14383152Renault Rafale3720.1%+ 2088.2%1867130.1%+ 4094.1%171206153Citroen Berlingo3660.1%+ 1009.1%1401,2380.2%+ 742.2%142173154Renault Kangoo3640.1%+ 0.8%1569250.1%– 2.5%157136155Land Rover Defender3570.1%+ 11.9%1748550.1%– 17.0%159164156VW Crafter3450.1%– 36.1%1608040.1%– 25.5%162149157Mazda CX-803360.1%new1617660.1%new166247158Nissan Townstar3320.1%+ 8.5%1558360.1%+ 25.9%160183159Peugeot 4083290.1%+ 321.8%1291,0670.2%+ 278.4%148188160Jeep Compass3260.1%+ 29.9%1421,0330.2%– 9.5%150147161Mitsubishi ASX3230.1%– 85.4%1578060.1%– 72.1%161137162Leapmotor T033200.1%new1856140.1%new180311163Toyota Proace3190.1%– 53.3%1599530.1%– 35.9%156126164Suzuki SX43090.1%– 29.1%1637170.1%+ 4.2%169162165Porsche Taycan3000.1%+ 322.5%1587670.1%+ 43.1%165151166BMW iX2980.1%– 11.0%1686750.1%– 36.1%173155167Peugeot Boxer2820.1%– 34.4%2005280.1%– 27.5%184174168DS 72710.1%+ 90.8%1417780.1%+ 93.5%164182169Honda HR-V2650.1%+ 61.6%2075260.1%+ 18.7%185204170BYD Seal U2620.1%new2513660.1%new212273171Honda CR-V2540.1%+ 149.0%1835340.1%+ 39.1%183208172Mercedes S-Klasse2520.1%– 1.2%1647440.1%– 9.0%167168173Range Rover Sport2490.1%+ 31.7%1736460.1%+ 23.3%177193174Renault Espace2470.1%– 23.5%1915250.1%– 1.3%186181175Nissan Primastar2350.1%+ 6.3%2094250.1%+ 2.7%204213176Range Rover Evoque2340.1%+ 9.9%1806240.1%+ 54.5%179190177Fiat Panda2300.1%– 39.8%1537870.1%– 27.1%163142178Audi A42290.1%– 93.4%1491,0300.2%– 88.7%15120179Kia EV62280.1%– 48.8%1488800.1%– 33.3%158132180Kia Stonic2270.1%– 61.7%1459570.1%– 30.5%155130181Honda Jazz2250.1%+ 134.4%2024530.1%+ 72.2%197234182Mazda MX-52210.1%+ 57.9%2183670.1%+ 40.1%211209183BMW X72180.1%– 22.4%2016300.1%– 34.0%178163184Polestar 22140.1%– 40.1%1894380.1%– 30.6%198184185BMW X62120.1%– 27.6%1935960.1%– 20.5%181159186Dacia Bigster2050.1%new2742320.0%new236 –187Peugeot Expert1940.1%+ 977.8%2243310.0%+ 549.0%219294188Audi A71890.1%+ 96.9%1765230.1%+ 83.5%187207189Porsche Panamera1890.1%+ 220.3%1924810.1%+ 0.8%194195190Hyundai Bayon1880.1%– 43.5%1707150.1%– 28.0%170145191Renault Scenic1870.1%+ 648.0%1904820.1%+ 1506.7%193201192Opel Zafira Life1860.1%+ 113.8%2173830.1%+ 91.5%209197193Renault Symbioz1850.1%new1815680.1%new182218194BYD Atto 31820.1%+ 175.8%2722380.0%+ 35.2%233236195Nissan Ariya1790.1%+ 371.1%1795130.1%+ 242.0%188249196Mercedes GLS1740.1%– 52.1%1975120.1%– 58.6%189160197Hyundai Santa Fe1710.1%+ 242.0%1726580.1%+ 230.7%176202198BMW X41700.1%– 59.4%1786620.1%– 35.6%175144199Honda Civic1650.1%+ 48.6%2422690.0%+ 8.9%230243200Man TGE1630.1%+ 22.6%2203510.1%+ 13.2%215229201Ford Capri1560.1%new1694350.1%new199281202Subaru Forester1560.1%+ 73.3%2063910.1%+ 57.0%208215203Smart #11520.1%– 75.8%1717090.1%– 45.9%172116204BMW 7er1500.1%– 44.6%1754990.1%– 33.6%190171205Lexus NX1480.1%+ 16.5%2054250.1%+ 20.1%203205206Kia Sorento1470.1%– 35.8%2084270.1%– 45.5%201161207Kia EV91460.1%+ 55.3%1824860.1%+ 42.9%192223208Range Rover 1460.1%+ 46.0%2044610.1%+ 40.5%195219209Volvo S/V901460.1%– 40.4%1963830.1%– 23.4%210199210Range Rover Velar1450.1%– 28.2%2104270.1%– 24.4%202200211Renault Arkana1420.1%– 77.9%1847240.1%– 24.3%168152212BYD Dolphin1400.1%+ 241.5%2542370.0%+ 189.0%234280213Ford Mustang1310.1%+ 54.1%1654900.1%+ 146.2%191221214Polestar 41300.1%new2153930.1%new207257215Lamborghini Urus1300.1%+ 85.7%2162830.0%+ 23.6%228263216BYD Seal1290.1%+ 514.3%2582180.0%+ 336.0%241265217Alfa Romeo Stelvio1270.1%– 21.6%2113470.1%– 16.8%216187218Subaru Crosstrek1270.1%+ 209.8%2262660.0%+ 131.3%232255219Subaru Outback1250.0%– 22.4%2212960.0%– 17.5%224233220Mercedes EQS1240.0%– 42.9%1984330.1%– 33.6%200179221Jeep Wrangler1220.0%+ 38.6%1774040.1%+ 52.5%206235222Mitsubishi Eclipse Cross1140.0%– 58.4%1883640.1%– 56.0%213138223Suzuki Swace1140.0%+ 83.9%2701650.0%+ 25.0%259260224Renault Trafic1120.0%– 66.0%2033570.1%– 58.8%214166225Hyundai Ioniq61110.0%– 63.2%2133430.1%– 48.7%217180226Mazda61090.0%– 78.0%2432300.0%– 75.3%238172227Genesis GV701040.0%+ 121.3%2631650.0%+ 46.0%258264228Mercedes SL1030.0%– 48.8%2481880.0%– 53.3%251230229Kia Niro980.0%– 82.7%1994590.1%– 66.8%196129230Audi e-Tron GT970.0%– 37.8%2192890.0%– 17.9%227228231Honda ZR-V960.0%+ 33.3%2402010.0%+ 16.9%247248232Audi A8950.0%– 50.5%2323420.1%– 30.8%218212233Alfa Romeo Giulia950.0%– 39.9%2252670.0%– 42.9%231220234Iveco Daily940.0%– 13.0%2222300.0%– 7.3%237242235Lexus LBX900.0%+ 69.8%2123010.0%+ 457.4%223226236Jeep Renegade900.0%– 70.5%2442170.0%– 65.4%243210237Renault Master890.0%– 51.9%2471790.0%– 32.5%253225238Smart #3870.0%– 29.8%2302950.0%– 20.9%225196239Lexus UX870.0%+ 163.6%2491680.0%– 22.9%256254240Mercedes AMG GT860.0%– 48.8%2312270.0%– 39.1%239227241Xpeng G6830.0%new2272080.0%new246318242Land Rover Discovery Sport790.0%– 44.0%2532120.0%– 30.0%244241243Xpeng G9780.0%new2281950.0%new248302244Maserati Grecale730.0%+ 151.7%2961170.0%+ 62.5%266296245Peugeot Rifter700.0%+ 180.0%2331870.0%+ 31.7%252285246Porsche Cayman680.0%– 59.5%2461660.0%– 63.4%257237247Volvo EX90670.0%new2362330.0%new235330248GWM Ora 03660.0%– 71.6%2391940.0%– 46.1%249198249Renault Megane650.0%– 68.6%2621280.0%– 86.1%265175250SsangYong Korando640.0%+ 20.8%2292730.0%+ 187.4%229277251BMW XM630.0%– 38.2%2801610.0%– 50.0%260232252Ferrari 296 GTB620.0%– 4.6%2451580.0%+ 3.9%261266253SsangYong Tivoli600.0%– 41.2%2372190.0%+ 12.3%240259254Volvo C40590.0%– 61.9%2382080.0%– 49.4%245239255BMW 8er590.0%– 73.4%2341710.0%– 63.4%255231256BYD Sealion 7590.0%new306900.0%new279350257Alfa Romeo Tonale570.0%– 75.0%2411740.0%– 76.2%254192258DS 4550.0%– 45.0%1953180.0%+ 29.3%220245259Opel Combo540.0%– 8.5%1943080.0%+ 79.1%221203260Hyundai Staria470.0%– 88.5%2561140.0%– 87.3%268177261VW Arteon450.0%– 91.8%2234160.1%– 78.1%205135262Opel Movano450.0%– 48.3%266960.0%– 38.1%276267263Ssangyong Torres440.0%+ 7.3%2601400.0%+ 48.9%264261264Toyota Land Cruiser430.0%– 60.9%2352950.0%+ 27.2%226216265Jaguar F-Pace430.0%– 59.8%2591530.0%– 56.4%262246266SsangYong Actyon430.0%n/a275690.0%n/a289 –267Ferrari Purosangue410.0%+ 17.1%2651020.0%+ 6.3%274284268Ford Mustang Mach-E400.0%– 84.8%2501160.0%– 74.9%267194269MG Cyberster400.0%new2811100.0%new270376270GWM Wey 05390.0%n/a2793010.0%n/a222256271Ineos Grenadier390.0%– 7.1%277850.0%– 53.6%281271272Ford Ecosport380.0%n/a326460.0%+ 2200.0%299380273Ferrari SF90/Stradale350.0%+ 6.1%292690.0%– 21.6%288298274SsangYong Rexton340.0%– 20.9%2641060.0%– 26.9%272286275Suzuki Ignis330.0%– 96.7%282930.0%– 95.5%277125276Lamborghini Coupe range330.0%– 35.3%283870.0%– 25.6%280269277Land Rover Discovery320.0%– 51.5%2681090.0%– 11.4%271276278Opel Crossland320.0%– 96.9%2691030.0%– 97.2%27389279Subaru BRZ310.0%– 8.8%267770.0%– 14.4%282293280Bentley Continental290.0%– 45.3%2551120.0%– 11.8%269274281Alpine A110280.0%– 48.1%305670.0%– 55.0%290282282Ferrari Roma270.0%– 46.0%271720.0%– 42.4%286290283Lexus LM270.0%+ 125.0%285700.0%+ 483.3%287305284Mazda MX-30260.0%– 77.6%261910.0%– 75.1%278222285Porsche Boxster260.0%– 91.1%307440.0%– 93.3%304224286DS 3250.0%+ 66.7%351410.0%+ 57.7%306299287Fiat Tipo230.0%– 63.5%291970.0%– 53.8%275217288Suzuki Across220.0%+ 144.4%312740.0%+ 428.6%283297289Alpine A290210.0%new319730.0%new284371290Seat Tarraco210.0%– 96.8%278670.0%– 96.5%291143291GWM Wey 03210.0%n/a286620.0%n/a293309292Genesis GV60210.0%+ 133.3%300450.0%+ 246.2%301326293BYD Atto 2200.0%new301430.0%new305 –294Lexus RX190.0%– 72.5%273730.0%– 65.7%285238295Tesla Model X190.0%– 53.7%299450.0%– 61.5%303295296Ferrari 12Cilindri180.0%new297470.0%new296395297Lotus Emira180.0%+ 157.1%302470.0%+ 147.4%297317298Bentley Bentayga160.0%– 27.3%290510.0%– 10.5%295307299Xpeng P7150.0%new315290.0%new313358300Toyota Prius140.0%+ 7.7%310460.0%– 57.0%300303301Tesla Model S140.0%– 70.8%298400.0%– 65.5%307291302Peugeot 508130.0%– 92.5%276640.0%– 85.1%292191303Lotus Eletre130.0%+ 44.4%309450.0%+ 45.2%302306304VW Up!130.0%– 96.5%303330.0%– 97.3%309178305Polestar 3130.0%new323240.0%new318300306Leapmotor C10120.0%new284590.0%new294375307Jaguar F-Type120.0%– 86.5% –120.0%– 90.5%330278308Audi Q8 e-Tron110.0%n/a2521480.0%– 80.5%263148309Subaru Solterra110.0%– 47.6%295290.0%– 39.6%312313310Lexus ES110.0%– 52.2%314260.0%– 57.4%316292311Genesis G80100.0%+ 233.3%344130.0%+ 62.5%327347312Toyota Supra90.0%– 65.4%293320.0%– 54.3%310301313BYD Tang90.0%new324230.0%new319349314Subaru Impreza90.0%+ 12.5%308220.0%+ 83.3%320340315Genesis G7090.0%– 10.0%329140.0%– 17.6%325325316Audi R890.0%– 93.7%341130.0%– 95.1%326262317Vinfast VF880.0%+ 33.3%289470.0%+ 147.4%298310318Rolls-Royce Spectre80.0%– 33.3%294300.0%+ 0.0%311336319Jeep Grand Cherokee80.0%– 11.1%304260.0%– 40.9%315331320NIO ET580.0%– 63.6%318210.0%– 44.7%321324321NIO ET780.0%+ 0.0%316210.0%– 4.5%322320322GWM Ora 0780.0%new325170.0%new323337323Lucid Air70.0%+ 40.0%313350.0%+ 218.2%308287324Genesis G9070.0%+ 600.0%342110.0%+ 83.3%332355325Cadillac Escalade60.0%– 45.5%317260.0%– 27.8%314328326Lexus RZ50.0%– 54.5%327130.0%– 31.6%328314327Ford Fiesta50.0%– 94.8% –50.0%– 98.0%349283328Dacia Logan40.0%n/a322160.0%n/a324272329Man TGM40.0%+ 300.0%35060.0%– 40.0%348362330Hyundai XG 25, 30, 250, 35040.0%new –40.0%new352 –331Maserati Levante30.0%– 40.0%333130.0%– 35.0%329329332Genesis GV8030.0%– 84.2%336110.0%– 66.7%333321333Opel Vivaro30.0%– 84.2%33190.0%– 84.2%340316334Audi TT30.0%– 98.9%33980.0%– 98.5%341240335Toyota Mirai30.0%– 85.0%34370.0%– 77.4%345312336MG Marvel20.0%– 81.8%2881910.0%+ 229.3%250315337Lynk & Co 0220.0%new311120.0%new331 –338Kia Soul20.0%– 98.4%335110.0%– 94.2%334258339NIO EL620.0%– 66.7%320110.0%– 38.9%335339340DS 920.0%+ 0.0%352100.0%+ 400.0%336370341Maserati GranTurismo20.0%– 50.0%328100.0%+ 0.0%337348342NIO ES820.0%new35390.0%new339354343Fiat Doblo20.0%– 75.0%33060.0%– 53.8%346366344Kia Rio20.0%– 90.0%33250.0%– 91.2%350334345Aston Martin DBX20.0%– 88.9%34840.0%– 93.4%351308346Honda E:NY120.0%– 99.2%35830.0%– 98.9%358252347Maxus Mifa 920.0%– 33.3%36030.0%– 78.6%362374348MG 510.0%– 99.5%2572180.0%– 61.1%242251349Lynk & Co 0110.0%n/a287240.0%+ 242.9%317344350Vinfast VF610.0%new33880.0%new342382351Smart #510.0%new32170.0%new344 –352Lotus Emeya10.0%new34060.0%new347359353Iveco Eurocargo10.0%– 83.3%34540.0%– 66.7%353360354Mercedes Actros10.0%+ 0.0% –40.0%– 20.0%355383355Opel Frontera10.0%new –40.0%new356327356Toyota GR8610.0%– 98.6% –40.0%– 98.9%357268357Man TGL10.0%– 50.0%34930.0%+ 50.0%360389358Ferrari F810.0%– 66.7%35720.0%– 75.0%366379359Fiat Ulysse10.0%– 50.0% –20.0%– 86.7%367364360NIO EL710.0%– 90.9%36220.0%– 90.0%371356361Renault Koleos10.0%– 99.1% –20.0%– 98.6%372288362Volvo FH10.0%new –20.0%new373 –363Rolls-Royce Cullinan10.0%– 87.5% –10.0%– 95.7%381345
Source: KBA

More Stories
Manual Transmission Take Rates in 2025 Prove the Stick Shift Still Has a Pulse
Motor1 did something we wish more outlets would do: they went straight to the source and asked automakers how many...
Car AC Compressor Repair Kit: How to Fix Common Air Conditioning Failures
The AC compressor is the critical element of an automobile’s air conditioning system that must carry the entire load. It...
Corvette ZR1X Just Redefined Straight Line Speed as America’s Quickest Production Car
Chevrolet just put a serious exclamation point on the C8 era by releasing validated acceleration numbers for the 2026 Corvette...
New Mercedes S-Class Facelift Brings Starry Lights and Stronger Power
Mercedes-Benz is kicking off 2026 with a big promise for its flagship sedan: the S-Class is about to receive the...
Beyond Speed: A Deep Dive into the 6 Safety Features That Could Save Your Supercar in 2026
Image generated by Gemini The modern supercar presents a fascinating paradox: a machine engineered for breathtaking speed and blistering lap times...
A Commercial Truck Caused a Hit-and-Run: Who Pays for the Damage?
Image generated by Gemini The roar of the engine, the gleam of polished chrome, the pride of owning a machine that’s...