
Australia March 2025: BYD #1 Chinese brand, BEVs down -19.9%
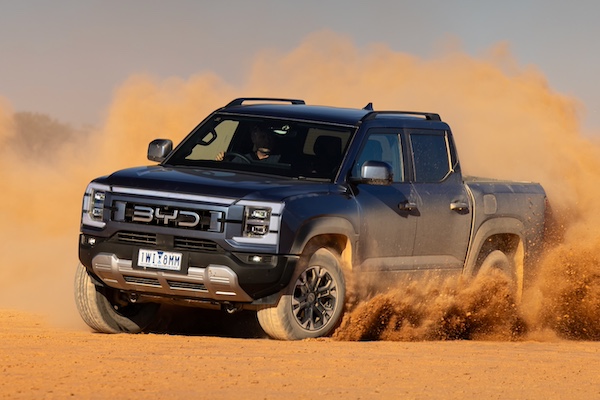
The BYD Shark 6 is the third best-selling pickup in Australia again.
For the first time this year, the Australian new vehicle market is in positive, delivering a new March record at 111,617 units (+1.8%). Q1 sales are off -2.8% to 295,952. The most interesting set of stats this month is sales by alimentation that show petrol off -8.3% to 43,785, diesel down -1.2% to 31,548, HEVs up 22.8% to 16,830 but BEVs sinking -19.9% to just 8,385 and 7.5% share vs. 9.5% a year ago. This is due in large part to Tesla’s struggles. Finally PHEV units surge 380.1% to 6,932 as customers rush to register their vehicle before the end of the Fringe Benefits Tax exemption for PHEVs on March 31. Private sales edge down -2.5% to 54,806 while business fleets are up 4.7% to 41,404. Rental fleets sink -13.5% to 5,434 and government sales skid -13.9% to 2,826.
SUV sales continue to surge at +26.3% to 67,586 and 60.6% share vs. 58.9% last year and 55% two years ago, with Light Commercials up 6.5% to 24,560 and 22% share vs. 21% in March 2024 and 22.6% the year prior. Passenger Cars freefall again at -12.9% to 15,335 and 13.7% share vs. 16.1% last year and 17.7% two years ago. Heavy commercial vehicles are down -20.6% to 3,448 and 3.1% share. All states and territories are in positive this month except from Queensland (-4.8% to 22,417). Western Australia leads the charge at +13.6% to 12,577 sales, followed by Tasmania +12.2% to 1,806, the Australian Capital Territory (+10.7% to 1,753) and South Australia (+4.5% to 7,304) and Northern Territory (+3.8% to 965). Volume leaders New South Wales (+1.7% to 34,367) and Victoria (+1.1% to 30,428) are more discreet. Looking at sales by country of origin, Japan is up 1% to 33,916, Thailand down -10% to 21,803 followed closely by China up 21% to 21,358. South Korea is off -3.4% to 13,288 and Germany up 12.6% to 5,424.
The Ford Ranger is back to the #1 overall ranking for the first time since last June.
In the brands charts, Toyota (+8.3%) is very solid year-on-year but its March share (18.4%) is below its YTD level (19.5%. Ford (-6.2%) reclaims the 2nd spot it held over the Full Year 2024 despite a significant loss. Mazda (-3%) and Kia (+3.4%) are relegated to #3 and #4 respectively ahead of Mitsubishi (-7.6%) in difficulty. Hyundai (+13.8%) rallies back up but is stuck in 6th place. The performer of the month is without a doubt BYD (+196.6%) tripling its sales year-on-year and breaking into the Top 10 for the first time directly at #7. BYD is therefore the best-selling Chinese brand in Australia for the first time. GWM (+21.4%) also impresses at #8, breaking its volume record at 4,393. MG (-0.6%) is down to #10. Chery (+293.2%) continues to gear up spectacularly. In contrast Tesla (-53%) is decimated. We welcome Geely at #35. Not reporting sales are Deepal, Ineos, Mahindra, Smart and Xpeng.
Model-wise, the Ford Ranger (-12.9%) is back to the top spot for the first time since last June and despite a steep year-on-year fall. The Toyota RAV4 (-14.8%) is dethroned but holds onto the YTD top spot for now (and for just 576 sales). The Toyota Hilux (+2.2%) remains in third place ahead of the Mitsubishi Outlander (+8.7%) at a record #4 also hit in June 2024. The Toyota Prado (+543.7%) rounds out the Top 5 with a stellar year-on-year lift due to the new model. The BYD Shark 6 spectacularly repeats at #6 with a record 2.5% share, proving that last month’s result was not a fluke. However sales have definitely been boosted by the upcoming end of the tax exemption on PHEVs.
Previous month: Australia February 2025: BYD Shark 6 lands with a bang
One year ago: Australia March 2024: Ford up to #2 brand, Everest breaks ranking record
Full March 2025 Top 52 All brands and Top 40 models below.
Australia March 2025 – brands:
PosBrandMar-25%/24Feb2025%/24PosFY241Toyota 20,54118.4%+ 8.3%157,79719.5%+ 2.8%112Ford 8,2327.4%– 6.2%421,3997.2%– 5.6%323Mazda 8,0007.2%– 3.0%225,1198.5%+ 5.7%234Kia 7,3076.5%+ 3.4%319,7346.7%+ 4.3%445Mitsubishi7,2656.5%– 7.6%519,0656.4%– 5.6%556Hyundai 6,8136.1%+ 13.8%618,2866.2%+ 2.4%667BYD4,8114.3%+ 196.6%118,7673.0%+ 95.6%12178GWM4,3933.9%+ 21.4%711,5793.9%+ 13.5%7109Nissan 4,0793.7%– 18.0%910,6733.6%– 25.3%9910MG3,9263.5%– 0.6%811,4053.9%– 8.2%8711Isuzu Ute3,5083.1%– 19.4%129,1153.1%– 28.8%11812Subaru 3,2012.9%– 15.0%109,6363.3%– 9.4%101113Tesla2,8292.5%– 53.0%175,1601.7%– 59.7%171214Volkswagen2,7012.4%– 10.7%137,1992.4%– 19.2%131315Mercedes2,5312.3%+ 33.0%156,2572.1%+ 27.4%141516BMW2,4562.2%– 3.0%165,6281.9%– 3.7%161417Chery2,1822.0%+ 293.2%146,0572.0%+ 216.6%152218Honda 1,7641.6%+ 8.4%194,2421.4%– 9.4%192019Suzuki 1,7051.5%– 15.7%184,4641.5%– 15.6%181620Lexus1,2951.2%+ 17.1%223,3181.1%+ 11.0%222121Audi1,2341.1%– 4.3%213,3921.1%– 3.6%211922LDV1,2151.1%– 9.7%203,5611.2%– 21.7%201823Land Rover9310.8%+ 34.3%231,9630.7%+ 13.1%232424Volvo7250.6%+ 13.1%241,9040.6%+ 0.8%242325Mini6110.5%+ 90.9%261,3940.5%+ 69.4%263026Porsche4680.4%– 27.7%251,4460.5%– 22.3%252527Skoda4590.4%– 14.2%301,1000.4%– 29.2%292828Cupra4160.4%+ 95.3%347880.3%+ 36.1%313329Renault3880.3%– 27.2%281,1630.4%– 20.2%272630KGM Ssangyong3780.3%– 20.9%271,1140.4%– 18.6%282731Chevrolet3600.3%+ 12.5%291,0070.3%+ 12.8%302932Ram2660.2%– 29.1%317680.3%– 26.2%323133Fiat1990.2%+ 111.7%355320.2%+ 58.3%343434Jeep 1900.2%– 19.1%325430.2%– 25.6%333235Geely1880.2%new –1880.1%new40 –36Polestar1820.2%+ 116.7%363890.1%+ 11.8%363637Peugeot1670.1%+ 18.4%383730.1%– 24.5%373538Genesis1210.1%– 6.9%373360.1%+ 0.3%383739JAC1170.1%new335250.2%new35 –40Zeekr1120.1%new392110.1%new39 –41Leapmotor870.1%new431380.0%new424842Jaguar650.1%– 28.6%401510.1%– 23.4%413843Maserati450.0%+ 4.7%46880.0%– 12.9%444044Alfa Romeo440.0%– 12.0%411190.0%– 42.8%433945Ferrari330.0%+ 22.2%45580.0%+ 7.4%464246Lamborghini280.0%+ 47.4%42820.0%+ 78.3%454147Aston Martin230.0%– 4.2%44550.0%+ 34.1%474548Bentley120.0%– 25.0%47320.0%– 30.4%484349McLaren90.0%+ 80.0%49200.0%+ 100.0%494750Lotus50.0%– 84.8%50160.0%– 72.9%514451Rolls-Royce40.0%+ 100.0%48190.0%+ 111.1%504952Citroen00.0%– 100.0%5150.0%– 82.8%5246
Australia March 2025 – models:
PosModelMar-25%/23Feb2025%/24PosFY241Ford Ranger4,9324.4%– 12.9%213,2264.5%– 16.1%212Toyota RAV44,3213.9%– 14.8%113,8024.7%+ 36.3%123Toyota Hilux4,0813.7%+ 2.2%310,9993.7%– 11.9%334Mitsubishi Outlander3,0052.7%+ 8.7%57,4802.5%+ 6.1%555Toyota Prado2,8712.6%+ 543.7%48,4412.9%+ 163.0%4376BYD Shark 62,8102.5%new64,8361.6%new12 –7Ford Everest2,1001.9%– 7.2%204,9861.7%+ 10.8%1068Isuzu D-Max2,0881.9%– 15.3%76,1962.1%– 22.0%649MG ZS2,0201.8%– 1.3%114,9521.7%– 21.3%11910Hyundai Kona2,0111.8%+ 25.1%105,2011.8%+ 30.1%91711Mitsubishi Triton1,9541.8%+ 0.0%164,5971.6%– 5.7%151412Nissan X-Trail1,9451.7%– 10.0%144,5611.5%– 18.5%161613Kia Sportage1,8471.7%– 12.6%95,6001.9%+ 9.2%71014Hyundai Tucson1,8311.6%+ 22.7%154,7361.6%+ 1.1%131215Mazda CX-51,7341.6%– 18.7%85,5381.9%+ 0.8%8816Tesla Model Y1,7251.5%– 60.6%313,1141.1%– 54.4%261117GWM Haval Jolion1,5681.4%+ 30.3%184,1601.4%+ 20.2%182418Toyota Corolla1,5271.4%– 24.7%124,6711.6%– 27.1%14719Isuzu MU-X1,4201.3%– 24.7%412,9191.0%– 39.9%311520GWM Haval H61,3801.2%+ 63.7%253,2011.1%+ 45.3%254121Mazda BT-501,2771.1%– 8.1%173,8681.3%– 1.9%192222Chery Tiggo 4 Pro1,2521.1%new283,3381.1%new2111623Mazda CX-31,2201.1%– 16.8%134,3371.5%+ 2.7%171324Toyota Corolla Cross1,2201.1%+ 56.6%273,2111.1%+ 33.0%234225Toyota Yaris Cross1,1911.1%+ 169.5%303,0151.0%+ 61.4%304626Tesla Model 31,1041.0%– 32.6%442,0460.7%– 65.6%n/a1827Subaru Forester1,0831.0%– 17.7%223,2081.1%– 10.5%242528Toyota Hiace1,0520.9%+ 15.2%193,2121.1%+ 8.0%222329Mitsubishi ASX1,0010.9%– 9.2%233,4391.2%+ 10.6%202930Kia Sorento9770.9%+ 2.3%322,4830.8%– 2.7%343831Kia Carnival9160.8%+ 54.7%332,4020.8%+ 40.7%353432Mazda39050.8%– 1.8%213,1041.0%+ 14.3%273233Hyundai i309030.8%– 11.6%352,6240.9%– 36.3%332634Mazda CX-308930.8%– 5.7%263,0611.0%+ 4.4%292735Subaru Outback8850.8%– 4.7%382,3000.8%– 10.0%383336Subaru Crosstrek8740.8%– 16.7%242,9051.0%– 6.7%323137MG 38640.8%– 11.7%293,0811.0%+ 6.6%282838Toyota Land Cruiser PU/CC8430.8%– 10.3%402,3040.8%– 26.5%373039Nissan Navara8400.8%– 23.7%372,3640.8%– 23.2%363540Kia Picanto8150.7%+ 56.4%541,9150.6%+ 99.7%n/a61
Source: VFACTS, EVC
More Stories
Europe Full Year 2025: BEV sales up 29.7% to 19.5% share, Dacia Sandero and Renault Clio dominate
This content is for members only. Visit the site and log in/register to read.
New Zealand Full Year 2025: Toyota RAV4 ends 10 years of Ford Ranger dominance
This content is for members only. Visit the site and log in/register to read.
Lexus LC Production Reportedly Ends in August 2026 and It Feels Like the End of an Era
It was expected, but that does not make it any easier to swallow. A dealer communication shared through the Lexus...
New Car Preview: 2027 Mercedes-Benz S-Class Refresh Turns Up the Lights Adds AI and a Stronger V8
Mercedes-Benz is giving the current S-Class a serious mid-cycle refresh for 2027, and the wild part is you might not...
Hyundai To Pull the Plug on Santa Cruz and Line Up a Bigger Truck for 2029
Hyundai’s Santa Cruz has always been the oddball pickup for people who wanted a truck bed without living with full-size...
Jimny Drive: Suzuki’s 4×4 Training Programme
Discover how Jimny Drive provides expert 4x4 training tailored exclusively for Suzuki Jimny owners, helping you drive with confidence and...