
Spain March 2025: Renault (+101.3%) signs first win in almost 7 years, market up 23.2%
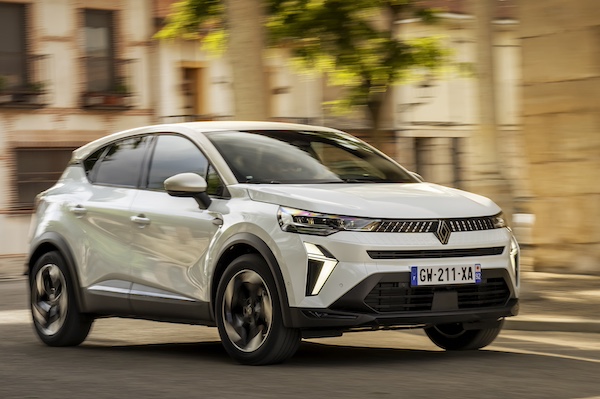
Renault Captur sales are up 102.4% year-on-year in March.
It’s another excellent month for new car sales in Spain, up 23.2% year-on-year in March to 116,725 units, getting closer to the 126,984 units of pre-pandemic March 2019. As a result, the Q1 volume is up 14.1% to 279,368. Sales have been helped by two more opening days and the traditionally slow selling “Semana Santa” falling in April this year instead of March. Volumes were also boosted by replacement vehicles registered in the Comunidad Valenciana (+26.3%). Cantabria (+39.9%), La rioja (+30.7%), Madrid (+30.4%) and Asturias (+29.3%) are also strong. Private sales climb 26.6% to 44,069 and are up 18.3% to 122,608 YTD, company sales are up 18.4% to 33,174 and up 8.1% to 90,796 YTD and rentals are up 23.8% to 39,482 and up 15.4% to 65,964 YTD. The big news this month is the strength of rechargeable vehicle sales (BEV+PHEV), shooting up 68.7% year-on-year to 16,474 and 14.1% share. Year-to-date sales are up 46.7% to 39,741 and 14.2% share.
The brands ranking is completely reshuffled this month, with Renault (+101.3%) more than doubling its sales year-on-year to reach #1 with 8.1% share. This is the carmaker’s first #1 finish since August 2018. Seat (+48.6%) is also up one spot to #2 while Volkswagen (+36.7%) and Peugeot (+31.2%) also both outpace the market. Leader last month, Toyota (-23.8%) is in freefall at #5 but holds onto the YTD top spot while Kia (-13.6%) also struggles at #6. Nissan (+24.8%) shoots back up 8 ranks on February to #7, distancing Dacia (+44.2%) and MG (+112%) both in outstanding shape. Chinese Newcomer Jaecoo is up to #26 with 0.8% share.
Over in the models charts, the Dacia Sandero (+53%) reclaims its traditional pole position with 3.4% share, with the MG ZS (+88.1%) falling to #2. The Nissan Qashqai (+16.4%) is up 8 ranks on February to #3, a ranking it now also holds year-to-date. Strikingly, the next 7 models, or the remainder of the Top 10, all beat the already galloping market. The Renault Captur (+102.4%) is the most dynamic at #5, followed by the Seat Leon (+88.2%) and Arona (+84.9%). The Peugeot 208 (+47.8%), 2008 (+46.7%) and Renault Clio (+42%) also impress with the Seat Ibiza (+28.6%) a notch below. The MG 3 (#17) is the most popular recent launch ahead of the Renault Symbioz (#34), Jaecoo 7 (#40), BYD Seal U (#43) and Renault 5 (#58).
Previous month: Spain February 2025: MG breaks records, pushes ZS to #1
One year ago: Spain March 2024: Nissan Qashqai takes the lead in first negative market in 14 months
Full March 2025 Top 65 All brands and Top 335 All models below.
Spain March 2025 – brands:
PosBrandMar-25%/24Feb2025%/24PosFY241Renault9,4738.1%+ 101.3%221,7807.8%+ 69.6%252Seat8,5497.3%+ 48.6%318,0336.5%+ 12.6%333Volkswagen7,9576.8%+ 36.7%517,1946.2%+ 18.5%424Peugeot7,5166.4%+ 31.2%615,4825.5%– 1.3%685Toyota7,1236.1%– 23.8%122,8538.2%– 0.8%116Kia6,2845.4%– 13.6%416,8666.0%+ 5.7%567Nissan6,1825.3%+ 24.8%1512,0234.3%+ 15.6%10148Dacia5,8795.0%+ 44.2%815,0795.4%+ 26.8%779MG5,5264.7%+ 112.0%712,9264.6%+ 91.0%91510Mercedes4,5013.9%+ 14.9%1011,8254.2%+ 10.4%11911BMW4,4453.8%+ 13.0%1310,0703.6%– 7.1%121012Hyundai4,1893.6%– 22.1%913,0304.7%– 8.6%8413Skoda4,0273.4%+ 24.8%119,8843.5%+ 10.6%131314Audi3,6853.2%+ 14.8%149,4433.4%+ 4.4%141115Citroen3,3742.9%– 24.0%168,6023.1%– 23.7%161216Ford3,2752.8%+ 74.9%129,0153.2%+ 64.0%151717Cupra2,8532.4%+ 66.8%185,6762.0%+ 37.1%181818Opel2,5082.1%– 1.4%176,0862.2%– 13.0%171619Mazda2,0211.7%+ 8.3%194,9251.8%+ 19.8%192020Tesla1,9831.7%+ 33.4%223,1691.1%– 12.0%212121Fiat1,7421.5%+ 37.7%252,9681.1%– 41.2%232222Mitsubishi1,6801.4%+ 39.0%342,2010.8%+ 4.3%283023BYD1,6261.4%+ 1448.6%213,8091.4%+ 777.6%202824Volvo1,5021.3%– 14.5%233,0491.1%– 29.4%221925Jeep1,1271.0%– 6.6%262,6811.0%– 9.9%242326Jaecoo9910.8%new281,9450.7%new293827Suzuki9170.8%+ 7.4%291,8580.7%+ 2.7%302728KGM/SsangYong8380.7%+ 272.4%371,2020.4%+ 68.6%312929Lexus7870.7%+ 17.3%272,3860.9%+ 28.5%272430Omoda7200.6%+ 256.4%242,5390.9%+ 660.2%262631Mini5850.5%– 38.2%202,6551.0%+ 23.1%252532Ebro5570.5%new331,1540.4%new325833Porsche3790.3%– 6.7%321,0870.4%– 10.9%343234Land Rover3670.3%+ 33.0%369210.3%+ 11.6%363435Honda3530.3%+ 0.3%301,1160.4%+ 17.6%333336Alfa Romeo2330.2%– 60.0%319410.3%– 6.5%353537DS1690.1%– 63.7%355610.2%– 51.7%373138Evo1230.1%+ 296.8%383500.1%+ 337.5%384139Subaru1070.1%+ 91.1%393020.1%+ 31.3%393640Lynk & Co800.1%+ 0.0%431860.1%– 21.5%423741Leapmotor710.1%new412460.1%new404642SWM630.1%+ 950.0%421960.1%+ 931.6%414543Lancia600.1%new401710.1%new435444Polestar520.0%+ 2.0%471250.0%+ 83.8%444045DFSK420.0%+ 82.6%461170.0%+ 125.0%454346Xpeng420.0%new441080.0%new465047Alpine300.0%+ 1400.0%52540.0%+ 217.6%515148Smart290.0%– 71.6%49930.0%– 72.8%473949Maserati180.0%– 41.9%48780.0%– 8.2%484450Dongfeng180.0%new51440.0%new525651Livan130.0%new50710.0%new495952Ineos110.0%+ 266.7%54240.0%– 11.1%534953Jaguar100.0%– 58.3%45690.0%– 29.6%504254Ferrari80.0%+ 14.3%56200.0%– 16.7%554855Lamborghini50.0%+ 0.0%53170.0%+ 30.8%575756Aston Martin40.0%+ 0.0%55210.0%+ 75.0%545357Bentley40.0%– 20.0%58180.0%+ 12.5%565258Yudo20.0%– 81.8%5760.0%– 76.0%585559Abarth20.0%– 93.1%6230.0%– 95.5%604760Hongqi20.0%n/a –20.0%+ 100.0%657761Moke Interational20.0%n/a –20.0%– 50.0%666662McLaren10.0%+ 0.0% –20.0%+ 100.0%626763Donkervoort10.0%n/a –10.0%n/a67 –64Morgan10.0%n/a –10.0%n/a707465Rolls Royce10.0%n/a –10.0%+ 0.0%7171
Spain March 2025 – models:
PosModelMar-25%/24Feb2025%/24PosFY241Dacia Sandero3,9373.4%+ 53.0%29,1103.3%+ 27.2%112MG ZS3,4613.0%+ 88.1%18,1832.9%+ 63.5%253Nissan Qashqai3,2312.8%+ 16.4%116,3092.3%+ 2.2%3114Seat Arona3,1252.7%+ 84.9%95,8632.1%+ 14.3%565Renault Captur3,0632.6%+ 102.4%66,2712.2%+ 67.8%4136Peugeot 2082,8052.4%+ 47.8%85,6352.0%+ 48.4%8197Seat Leon2,4562.1%+ 88.2%214,4171.6%+ 21.8%13228Peugeot 20082,2231.9%+ 46.7%154,5511.6%– 7.3%12129Renault Clio2,2051.9%+ 42.0%35,7932.1%+ 34.6%6710Seat Ibiza2,1731.9%+ 28.6%45,7052.0%+ 18.3%7311Nissan Juke2,0721.8%+ 15.0%373,7961.4%+ 22.7%203812VW Taigo1,9871.7%+ 149.3%233,8321.4%+ 109.4%193613VW T-Cross1,8161.6%+ 31.6%353,1681.1%+ 8.7%252014Opel Corsa1,7601.5%+ 24.1%104,3461.6%+ 10.4%141615Toyota Corolla1,7361.5%– 23.4%55,4031.9%– 12.7%9216Kia Stonic1,7011.5%– 13.4%184,1281.5%+ 16.5%173117MG 31,6311.4%new282,9181.0%new289118Citroen C41,5881.4%+ 60.2%203,9531.4%+ 21.2%182619VW T-Roc1,5591.3%+ 36.5%223,7211.3%+ 20.7%211520Toyota C-HR1,5011.3%+ 2.7%74,9381.8%+ 33.7%10821Fiat 6001,4241.2%+ 12845.5%861,8630.7%+ 3226.8%5314022Mitsubishi Colt1,4161.2%+ 352.4%1701,5370.6%+ 182.5%6412623Tesla Model 31,3911.2%+ 52.7%562,0470.7%+ 0.0%452924Hyundai Tucson1,3891.2%– 34.5%164,8731.7%– 7.3%11425Kia Sportage1,3441.2%– 16.5%144,1301.5%+ 1.4%161026Cupra Leon1,3361.1%+ 274.2%622,1780.8%+ 70.4%434227Ford Kuga1,2671.1%+ 98.6%273,0341.1%+ 82.8%275328Toyota Yaris Cross1,2481.1%– 24.5%134,2081.5%– 3.3%15929Skoda Kamiq1,2371.1%+ 59.2%342,6631.0%+ 12.4%333430Dacia Duster1,2151.0%+ 44.5%193,6501.3%+ 33.7%221831BMW X11,1951.0%+ 27.7%452,5470.9%+ 5.6%362432Peugeot 30081,1751.0%+ 14.1%482,4040.9%– 19.8%404133Toyota Yaris1,1351.0%– 51.0%253,3311.2%– 12.8%241434Renault Symbioz1,0850.9%new412,0410.7%new4613535Citroen C3 1,0650.9%– 29.0%363,0571.1%– 18.9%261736Renault Austral1,0600.9%+ 19.4%322,6270.9%+ 31.7%352737Kia Niro1,0550.9%+ 5.9%242,9001.0%– 0.4%293538Ford Puma9940.9%+ 20.0%262,8261.0%+ 19.7%313739Toyota RAV49930.9%– 0.4%173,3821.2%+ 4.4%232340Jaecoo 79910.8%new461,9450.7%new5014341VW Tiguan9540.8%+ 12.1%402,3910.9%+ 12.0%413342Hyundai Kona9510.8%+ 37.8%392,4320.9%– 2.3%392143BYD Seal U9420.8%new641,8270.7%new5410944Mercedes GLC9390.8%+ 16.9%382,8671.0%+ 33.1%303245VW Golf9250.8%+ 38.9%442,1490.8%+ 9.5%444846Skoda Fabia8730.7%+ 27.4%422,4650.9%+ 62.8%374547Cupra Formentor8520.7%– 32.8%431,9780.7%– 24.9%493048Skoda Karoq8150.7%+ 31.7%661,5870.6%– 17.1%625149Ford Focus8110.7%+ 181.6%292,7671.0%+ 132.1%325650Mazda CX-308040.7%+ 32.0%541,7960.6%+ 36.9%556451Seat Ateca7930.7%+ 0.8%492,0230.7%+ 12.9%484352Kia Ceed7780.7%+ 4.3%681,6810.6%+ 6.9%606253Jeep Avenger7480.6%+ 49.0%521,9160.7%+ 17.6%526154Nissan X-Trail7460.6%+ 129.5%611,7230.6%+ 70.4%578155Hyundai i207310.6%– 27.6%302,2220.8%– 11.9%422556BMW X27240.6%+ 76.6%601,4440.5%+ 99.4%657357Audi A37100.6%– 9.9%571,5680.6%– 24.8%635458Renault 56960.6%new851,1770.4%new7420659Mercedes GLA6900.6%– 18.1%551,7650.6%– 20.6%564060Omoda 56750.6%+ 234.2%332,4560.9%+ 635.3%385061Audi A16590.6%+ 87.7%631,6810.6%+ 70.3%597062Volvo XC406490.6%– 29.0%651,3510.5%– 29.8%693963Renault Arkana6480.6%+ 105.1%472,0350.7%+ 23.8%474664Dacia Jogger6300.5%+ 11.1%501,7040.6%– 1.8%585265Audi Q36240.5%– 35.3%511,9160.7%– 20.5%512866Mercedes A Class6120.5%– 3.8%721,4060.5%– 6.0%685567BMW 1-Series5900.5%+ 14.3%781,1850.4%– 30.5%736368Tesla Model Y5890.5%+ 6.1%731,1010.4%– 27.1%776569Mini Lineup5850.5%– 38.0%122,6551.0%+ 23.4%344970Peugeot 50085620.5%+ 91.8%1079370.3%– 25.6%818071KGM Tivoli/Grand5480.5%+ 277.9%1467500.3%+ 73.6%999072Audi Q25370.5%– 4.3%531,4100.5%– 13.0%676773Opel Mokka5360.5%+ 39.2%949280.3%– 7.8%827774Kia Xceed5290.5%– 59.9%691,3500.5%– 43.0%704775Skoda Octavia5220.4%– 10.0%591,3400.5%– 11.0%716976Peugeot 3085070.4%– 27.3%581,4440.5%– 29.3%665877Volvo XC604890.4%+ 15.9%1028700.3%– 23.1%877878Ebro S7004540.4%new969020.3%new8530679Kia EV34430.4%new671,2920.5%new7215980Mazda CX-54410.4%– 3.7%771,1180.4%+ 6.6%767481Renault Rafale4400.4%+ 3042.9%849280.3%+ 5700.0%8312082Citroen C4 X4360.4%+ 164.2%1018350.3%+ 78.0%9211183Audi Q54140.4%+ 127.5%741,0740.4%+ 26.4%787184Mercedes CLA3990.3%+ 49.4%1117330.3%+ 3.8%1008985Suzuki Vitara3950.3%+ 67.4%879080.3%+ 64.5%849986Mercedes C Class3890.3%– 5.6%977950.3%– 22.0%968887MG HS/eHS3850.3%– 21.6%311,5970.6%+ 52.8%617288Hyundai Bayon3300.3%– 42.6%888360.3%– 41.9%916889Hyundai i103230.3%+ 14.9%831,1570.4%+ 33.8%756690Lexus NX3140.3%– 0.6%829730.3%+ 9.3%808291Mercedes V Class2940.3%+ 226.7%937090.3%+ 86.6%10210592Cupra Terramar2930.3%+ 2563.6%907700.3%+ 5400.0%9816193BMW X32890.2%+ 4.0%791,0170.4%+ 7.5%797694Kia Picanto2890.2%– 35.5%808590.3%+ 7.0%898595Lexus LBX2830.2%+ 97.9%928260.3%+ 325.8%938796Mazda32780.2%– 21.0%818150.3%+ 4.5%948697Citroen C5 Aircross2690.2%– 23.1%897260.3%– 13.6%1017998Skoda Kodiaq2670.2%+ 24.8%718890.3%+ 76.0%869399KGM Korando/C3002640.2%+ 398.1%1773860.1%+ 93.0%129132100Cupra Tavascan2600.2%+ 6400.0%1244530.2%+ 1194.3%118169101Suzuki Swift2570.2%+ 164.9%1254780.2%+ 101.7%116133102BMW 3-Series2480.2%– 37.1%1145510.2%– 44.9%11183103Fiat Panda2440.2%– 3.6%1125500.2%– 46.1%11284104VW Polo2300.2%– 68.2%758120.3%– 53.2%9557105BYD Atto 32260.2%+ 380.9%1046580.2%+ 276.0%103136106Toyota Aygo X2240.2%– 30.2%957850.3%+ 6.1%9775107Jeep Compass2220.2%– 5.5%1314160.1%– 24.9%124116108Peugeot 4082200.2%+ 3.3%1494510.2%– 7.6%119123109Hyundai i302190.2%– 65.1%708590.3%– 39.7%8859110BMW 2-Series2180.2%– 26.6%1086390.2%– 34.0%10497111BMW 4-Series2170.2%– 7.7%1104930.2%– 25.8%115104112BYD Dolphin2110.2%+ 559.4%988390.3%+ 530.8%90141113Mazda22050.2%– 21.2%1135110.2%+ 1.4%114106114Skoda Scala1980.2%– 29.5%915980.2%– 29.5%10894115Audi A51960.2%+ 237.9%1055990.2%+ 343.7%107166116BMW ix11880.2%+ 18.2%1264180.1%+ 3.0%122112117Mazda CX-601830.2%+ 46.4%1164030.1%+ 31.3%126131118Audi Q81820.2%+ 451.5%1453990.1%+ 110.0%127146119Mercedes GLE1690.1%+ 39.7%1036120.2%+ 17.5%105103120Renault Espace1640.1%+ 17.1%1005480.2%+ 5.4%113107121Mercedes B Class1620.1%+ 60.4%1473790.1%+ 48.6%131142122Volvo XC901620.1%+ 39.7%1503580.1%– 13.1%133124123Toyota bZ4X1580.1%+ 364.7%1322840.1%+ 123.6%147211124Mercedes EQA1530.1%+ 125.0%1154730.2%+ 59.8%117118125Mercedes E Class1470.1%+ 129.7%1194150.1%+ 80.4%125129126Alfa Romeo Junior1450.1%new996060.2%new106212127BMW X51450.1%+ 0.0%1443120.1%– 20.0%141122128BMW ix21430.1%+ 146.6%1403110.1%+ 190.7%142145129Mitsubishi ASX1390.1%– 78.9%1353720.1%– 63.6%132102130VW Touran1390.1%+ 321.2%1203440.1%+ 101.2%136147131Land Rover Defender1360.1%+ 231.7%1393350.1%+ 91.4%138164132Mercedes CLE1350.1%+ 4.7%1333510.1%+ 20.6%135130133Mercedes GLB1340.1%– 38.5%1095740.2%+ 6.1%110101134Lexus UX1340.1%– 10.7%1373930.1%– 30.4%128114135Suzuki SX4 S-Cross1340.1%– 57.3%1383200.1%– 35.1%140128136BMW 5-Series1260.1%+ 186.4%1343000.1%+ 65.7%144150137Porsche Cayenne1240.1%– 5.3%1283300.1%– 21.2%139138138Suzuki Swace1240.1%+ 100.0%2611340.0%+ 17.5%184172139Mitsubishi Eclipse Cross1220.1%+ 408.3%1292710.1%+ 165.7%150193140Hyundai Inster1210.1%new1232940.1%new146275141Audi Q71140.1%+ 1166.7%1981920.1%+ 182.4%164194142Porsche Macan1120.1%– 21.7%1273410.1%– 21.4%137127143DS 7 Crossback1110.1%– 61.3%1064180.1%– 46.3%12396144Jeep Renegade1100.1%– 75.8%1552410.1%– 68.0%154110145Opel Astra1040.1%– 61.5%1184440.2%– 40.7%120108146Volvo EX301040.1%– 18.1%1612300.1%– 39.6%15698147Nissan Ariya1040.1%+ 593.3%1941590.1%+ 238.3%176226148Ebro S8001030.1%new1412520.1%new153 –149Kia Sorento1020.1%– 3.8%1223810.1%– 14.0%130137150VW Passat1000.1%+ 138.1%1711890.1%+ 6.8%168165151BYD Sealion 7980.1%new2121280.0%new185301152BMW X4960.1%– 50.5%1432720.1%– 41.8%149100153Audi A6960.1%+ 100.0%1751950.1%+ 61.2%163175154Ford Explorer960.1%+ 2300.0%1841570.1%+ 1644.4%177181155Mercedes EQE950.1%+ 120.9%1542620.1%+ 67.9%151151156Toyota Land Cruiser940.1%+ 30.6%1303550.1%+ 57.1%134113157Renault Scenic890.1%+ 493.3%1642950.1%+ 1866.7%145216158Honda Civic890.1%– 33.6%1532590.1%– 2.3%152148159Audi Q4880.1%+ 49.2%1662160.1%+ 8.0%159157160BYD Seal830.1%+ 315.0%1602170.1%+ 97.3%158144161Cupra Born810.1%+ 62.0%1482400.1%+ 93.5%155149162Porsche 911780.1%– 12.4%1741980.1%– 5.3%162171163Honda HR-V720.1%– 39.0%1173070.1%+ 4.4%143139164Honda Jazz710.1%+ 222.7%1562130.1%+ 208.7%160191165BMW X6710.1%+ 4.4%1581850.1%– 8.4%170153166Lynk & Co 01690.1%– 13.8%1851620.1%– 31.6%174134167Dacia Spring680.1%– 29.2%1215850.2%+ 121.6%109168168Opel Grandland680.1%– 67.5%1422730.1%– 41.5%148119169Range Rover Sport (est)680.1%+ 3.0%1691910.1%– 7.7%167167170VW Tayron670.1%new222880.0%new205 –171VW ID.4660.1%+ 17.9%1881860.1%+ 84.2%169186172Alfa Romeo Tonale650.1%– 84.6%1362280.1%– 69.4%157121173Mercedes EQB650.1%+ 160.0%1781600.1%+ 35.6%175177174BMW i4640.1%+ 3.2%2001170.0%– 11.4%190173175Honda ZR-V620.1%+ 67.6%1821910.1%+ 15.1%166174176Range Rover Evoque620.1%+ 19.2%1861380.0%– 12.7%182176177EVO5610.1%+ 577.8%1511920.1%+ 638.5%165222178Lancia Ypsilon600.1%new1521710.1%new171282179BYD Atto 2590.1%new2231220.0%new187 –180Hyundai Santa Fe560.0%+ 55.6%1671680.1%+ 31.3%173162181Honda CR-V530.0%+ 130.4%1651380.0%+ 16.0%181187182DS 4520.0%– 52.7%1721210.0%– 51.6%188158183VW ID.3500.0%– 9.1%1811390.0%+ 5.3%180188184Skoda Elroq500.0%new1571140.0%new193 –185Hyundai Ioniq5500.0%+ 194.1%210980.0%+ 63.3%198204186Ford Capri490.0%new250660.0%new223245187Mazda CX-80480.0%new1591490.1%new179234188Volvo V60470.0%+ 113.6%1761020.0%+ 10.9%196218189Fiat Tipo450.0%+ 4400.0%2051060.0%+ 1414.3%195185190Omoda E5450.0%+ 1400.0%229830.0%+ 2666.7%208231191MG 4420.0%– 83.5%1632080.1%– 69.1%16195192Subaru Crosstrek420.0%+ 281.8%1971080.0%+ 58.8%194180193Skoda Superb410.0%– 19.6%1791380.0%+ 39.4%183196194Range Rover (est)410.0%+ 5.1%1991150.0%– 5.7%192202195Leapmotor T03390.0%new1731710.1%new172232196Lexus ES390.0%+ 25.8%1921170.0%+ 23.2%191205197Subaru Forester380.0%+ 52.0%1901280.0%+ 80.3%186198198VW ID.7370.0%+ 362.5%209880.0%+ 31.3%204256199BMW X7370.0%+ 68.2%236690.0%– 15.9%216215200Porsche Panamera360.0%+ 350.0%1681210.0%+ 348.1%189230201Audi Q6340.0%new1831000.0%new197248202Jeep Wrangler340.0%+ 466.7%203880.0%+ 486.7%203225203Toyota Corolla Cross320.0%– 81.1%1621500.1%– 64.2%178152204Xpeng G6320.0%new191810.0%new209286205Mazda MX-5320.0%+ 357.1%213760.0%+ 85.4%210197206Leapmotor C10320.0%new214750.0%new212283207Land Rover Discovery Sport320.0%+ 39.1%231660.0%+ 0.0%224224208EVO3310.0%+ 181.8%245690.0%+ 122.6%217244209Cupra Ateca310.0%+ 47.6%237560.0%+ 1.8%234189210SWM G01300.0%+ 400.0%201910.0%+ 405.6%201247211Mercedes T Class300.0%– 16.7%206860.0%– 13.1%206182212Volvo EX40300.0%+ 50.0%196700.0%– 6.7%215n/a213Mazda MX-30300.0%– 36.2%251570.0%– 43.6%232199214BMW Z4300.0%+ 36.4%244460.0%– 28.1%242243215Nissan Leaf290.0%– 21.6%280360.0%– 52.0%247233216Dacia Bigster290.0%new325300.0%new255 –217Range Rover Velar280.0%– 49.1%216760.0%– 21.6%211210218Ford Mustang Mach-E280.0%– 70.8%234460.0%– 74.3%243178219Opel Frontera270.0%new –270.0%new259 –220Kia EV6260.0%– 57.4%207830.0%– 33.6%207160221Alpine A290250.0%new256450.0%new244367222Fiat 500240.0%– 97.4%764340.2%– 88.5%12144223Ford Mustang240.0%+ 380.0%187940.0%+ 161.1%199220224Skoda Enyaq240.0%+ 26.3%204900.0%– 50.0%202170225BMW 7-Series240.0%– 29.4%217610.0%– 43.5%228219226Peugeot 508240.0%– 71.1%218600.0%– 69.1%229155227Mercedes S Class240.0%+ 71.4%246510.0%– 30.1%237228228KGM Torres240.0%+ 33.3%254420.0%– 19.2%246201229Renault Megane230.0%– 90.3%232630.0%– 87.7%225115230Mercedes EQS230.0%+ 283.3%233590.0%+ 195.0%231254231Subaru Legacy230.0%+ 64.3%220560.0%– 13.8%235217232Polestar 2230.0%– 54.9%242480.0%– 29.4%240179233Mercedes G Class220.0%+ 4.8%224680.0%+ 9.7%219221234Porsche Taycan220.0%+ 450.0%219670.0%+ 109.4%221238235VW Touareg210.0%– 52.3%225670.0%– 23.0%222203236Polestar 4210.0%new208620.0%new227259237Smart #1200.0%– 64.9%227570.0%– 65.5%233183238Alfa Romeo Stelvio190.0%– 87.5%193920.0%– 61.0%200156239DFSK E5190.0%new211620.0%new226292240SWM G03F190.0%new235560.0%new236278241Dongfeng Box180.0%new221440.0%new245284242EVO7170.0%+ 240.0%262320.0%+ 300.0%253257243Audi A8170.0%+ 325.0%282220.0%+ 83.3%268288244Citroen C5 X160.0%– 66.0%285300.0%– 67.4%254200245Maserati Grecale150.0%– 37.5%189680.0%+ 1.5%218229246Hyundai Staria140.0%– 17.6%180710.0%+ 42.0%213235247SWM G05140.0%new230470.0%new241302248BMW XM140.0%+ 55.6%253350.0%+ 6.1%248240249Livan X3 Pro130.0%new202710.0%new214311250Opel Crossland130.0%– 95.0%215680.0%– 91.9%22092251Jeep Grand Cherokee130.0%+ 44.4%289200.0%– 13.0%270274252BMW i5120.0%– 29.4%257320.0%+ 45.5%252242253Mercedes GLS110.0%+ 10.0%249330.0%– 8.3%251255254Ineos Grenadier110.0%+ 266.7%264240.0%– 11.1%265277255Lynk & Co 02110.0%new274240.0%new266 –256Jaguar F-Pace100.0%– 44.4%195590.0%+ 25.5%230237257Audi A4100.0%– 92.9%226500.0%– 84.8%238125258Lexus RX100.0%– 44.4%248480.0%– 40.0%239214259Kia EV990.0%– 10.0%238330.0%– 15.4%250236260EVO690.0%new228270.0%new258315261Volvo EX9090.0%new243260.0%new261300262Smart #380.0%– 80.0%241350.0%– 67.3%249207263Kia Proceed80.0%+ 166.7%240290.0%+ 0.0%257253264DFSK 60080.0%new267210.0%new269334265Polestar 380.0%new299150.0%new284290266Xpeng G970.0%new268200.0%new271337267BYD Tang70.0%+ 600.0%276180.0%+ 350.0%274348268Ford Bronco60.0%– 33.3%258250.0%– 26.5%262260269Lexus RZ60.0%– 45.5%307250.0%+ 78.6%263295270Volvo C4060.0%– 91.3%265180.0%– 87.9%277208271DFSK 50060.0%+ 50.0%269170.0%– 15.0%279262272Honda E:NY160.0%– 33.3%31980.0%– 61.9%301298273Suzuki Across60.0%+ 200.0%30680.0%+ 300.0%303291274EVO450.0%– 16.7%252300.0%+ 100.0%256271275DS 350.0%– 92.5%255180.0%– 85.7%275190276VW ID.550.0%– 75.0%275180.0%– 43.8%278263277Mercedes AMG GT50.0%– 16.7%286170.0%+ 30.8%280285278BMW ix350.0%– 58.3%260160.0%– 51.5%281261279Fiat 500X50.0%– 92.1%277150.0%– 91.6%283184280BMW IX 50.0%– 16.7%279120.0%– 79.7%288239281Alpine A11050.0%+ 150.0%31290.0%– 47.1%296279282Hyundai Ioniq640.0%+ 33.3%259190.0%+ 0.0%272241283Porsche Cayman40.0%– 71.4%263190.0%– 47.2%273264284Alfa Romeo Giulia40.0%– 60.0%272150.0%– 40.0%282272285Volvo V9040.0%+ 33.3%281100.0%– 16.7%295265286BMW 8-Series40.0%– 71.4%30180.0%– 68.0%300269287DFSK Seres 340.0%n/a32650.0%+ 25.0%316339288Audi A730.0%+ 0.0%278120.0%– 14.3%286276289Bentley Continental30.0%+ 50.0%296120.0%+ 71.4%287304290Lamborghini Urus30.0%+ 0.0%270120.0%+ 33.3%289309291Porsche Boxster30.0%– 82.4%297110.0%– 82.5%290250292Mercedes SL30.0%+ 0.0%309100.0%+ 25.0%292297293MG Marvel30.0%– 81.3%29090.0%– 75.0%297252294DFSK 58030.0%– 78.6%30270.0%– 58.8%305270295Subaru Solterra30.0%– 25.0%28370.0%– 58.8%307289296Xpeng P730.0%new28470.0%new309350297Ferrari Roma30.0%+ 0.0%31850.0%– 28.6%317325298Mitsubishi Outlander30.0%n/a –30.0%n/a328 –299MG 530.0%– 40.0% –30.0%– 70.0%330296300Seat Tarraco20.0%– 99.3%239250.0%– 96.2%264117301KGM Rexton20.0%– 77.8%247230.0%– 20.7%267209302Volvo EC4020.0%– 92.6%295130.0%– 84.7%285195303Tesla Model X20.0%– 77.8%298100.0%– 54.5%294267304Toyota Supra20.0%n/a31170.0%+ 250.0%308327305Aston Martin DB1220.0%+ 0.0%31360.0%+ 20.0%310310306Yudo K320.0%– 81.8%29160.0%– 76.0%313281307Aston Martin Vantage20.0%+ 100.0%31650.0%+ 150.0%314347308DFSK ix520.0%– 60.0%31750.0%– 54.5%315294309Abarth 50020.0%– 93.1%32330.0%– 95.5%322223310Ferrari Purosangue20.0%+ 100.0% –20.0%– 50.0%339333311Hongqi H920.0%new –20.0%new340 –312Moke International20.0%n/a –20.0%– 50.0%341342313Tesla Model S10.0%– 91.7%266110.0%– 47.6%291280314Suzuki Ignis10.0%– 98.8%287100.0%– 95.9%293163315Audi e-Tron GT10.0%– 50.0% –80.0%+ 100.0%299316316MG Cyberster10.0%new27380.0%new302329317Ferrari 296 GTS10.0%+ 0.0%31060.0%+ 50.0%311319318Ferrari SF9010.0%n/a30060.0%n/a312354319DS 910.0%– 50.0%30340.0%– 42.9%318313320Lexus LM10.0%– 50.0%30440.0%– 73.3%319246321Bentley Flying Spur10.0%n/a –30.0%+ 50.0%325343322Lamborghini Huracan10.0%– 50.0%30530.0%– 25.0%327321323Subaru BRZ10.0%+ 0.0%32130.0%– 50.0%329307324Lamborghini Revuelto10.0%new32720.0%new331355325Maserati Ghibli10.0%– 66.7% –20.0%– 50.0%332336326Maserati MC2010.0%+ 0.0%32820.0%– 33.3%333346327Maserati Quattroporte10.0%n/a –20.0%+ 0.0%334366328McLaren Coupe10.0%+ 0.0% –20.0%+ 100.0%335371329VW Arteon10.0%– 75.0% –20.0%– 97.4%338251330Ferrari 296 GTB10.0%n/a –10.0%– 80.0%354323331Morgan Plus10.0%n/a –10.0%n/a355385332Rolls-Royce Spectre10.0%new –10.0%new356 –333Smart Fortwo10.0%– 80.0% –10.0%– 98.6%357268334Hyundai Ioniq10.0%n/a –10.0%n/a358 –
Source: ANFAC

More Stories
The ‘Always Ready’ Angel BS200 Super Starter
Today I’m bringing you an exclusive review for My Car Heaven. If you’ve ever faced the frustration of a car...
BSCB needs your help!
BSCB needs your help today. In particular for two markets whose data source has gone silent in recent months: the...
Explore: The cars of Morocco
Dacia Logan taxi in Chefchaouen, Morocco In December and January I was lucky enough to visit Fès and Chefchaouen in...
Europe Full Year 2025: BEV sales up 29.7% to 19.5% share, Dacia Sandero and Renault Clio dominate
This content is for members only. Visit the site and log in/register to read.
New Zealand Full Year 2025: Toyota RAV4 ends 10 years of Ford Ranger dominance
This content is for members only. Visit the site and log in/register to read.
Lexus LC Production Reportedly Ends in August 2026 and It Feels Like the End of an Era
It was expected, but that does not make it any easier to swallow. A dealer communication shared through the Lexus...