Italy March 2025: MG breaks into Top 10, sales up 6.2%
MG is among the 10 most popular carmakers in Italy for the first time.
New car sales in Italy are back up 6.2% year-on-year in March to 172,223 units, yet a slow start of the year means the year-to-date volume remains down at -1.6% to 443,906. Private sales edge down -0.7% to 81,028 and 46.7% share vs. 49.7% a year ago and are off -5.3% YTD to 241,459 and 54% vs. 55.7% over the same period in 2024. Self registrations fall -25.6% to 14,088 for the month and -14.4% YTD to 37,696. Long term leases jump 33.3% to 46,061 and 26.6% share vs. 21.1% last year and are up 11.5% YTD to 106,300 and 23.8% share vs. 20.8%. Short term rentals gain 13.9% to 23,143 and 13.3% share vs. 12.4% and are down -2.7% YTD to 37,113 and 8.3% share vs. 8.3% a year ago.
As for sales by alimentation, petrol drops -9.5% for the month to 46,220 and sinks -15.7% YTD to 118,535. Diesel falls -28.7% to 17,751 and -37.1% YTD to 43,820 and LPG gains 3.9% to 13,431 and is off -4.4% YTD to 41,315. HEVs soar 23.3% to 78,796 for the month, including 22,308 full hybrids (+23.9%) and 56,488 mild hybrids (+23.1%). YTD, HEVs are up 15.1% to 201,453 including 55,193 full hybrids (+14.7%) and 146,260 mild hybrids (+15.2%). PHEVs surge 37.4% to 7,841 for the month and +30.1% to 18,916 YTD. Finally, BEVs surge 75.1% off a low year-ago base to 9,393 and 5.4% share vs. 3.3% a year ago and up 72.2% YTD to 23,073 and 5.2% share vs. 2.9% over the same period in 2024. These are still very low BEV shares compared with the rest of Europe.
Fiat (-2.2%) is in the lead at home for the third straight month at a wobbly 9.7% share vs. 10.7% so far this year. Toyota (-1.9%) repeats at #2 and reclaims that spot in the YTD charts off Dacia (+9.5%). Volkswagen (-9.9%) is up one rank on February to #3, as is Peugeot (+27.8%) in excellent shape. Renault (+12.5%) and Jeep (+7.1%) also beat the market while BMW (+6%) matches it. But the best performance near the top of the charts is delivered by MG, up 65.8% year-on-year to #10. This is the brand’s very first incursion into the Italian Top 10, also beating its volume (6,582) and share (3.8%) records. BYD (+2452.9%), Cupra (+61.2%), Tesla (+51.3%), Alfa Romeo (+45%) and Nissan (+22.9%) also shine below.
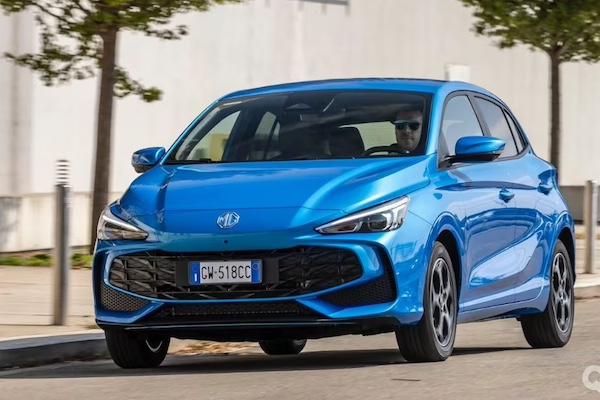
Model-wise, the Top 4 remains unchanged on last month. The Fiat Panda (+6.6%) manages a year-on-year lift despite its age to easily stay in pole position with 7.3% share vs. 8.5% so far this year. The Dacia Sandero (-6.5%) is in difficulty but stays in 2nd place ahead of the Citroen C3 (+13.9%). The Jeep Avenger (+51.8%) and Peugeot 208 (+51.2%) round out the Top 5 in formidable fashion. The Opel Corsa (+73.6%), MG ZS (+37.2%) and Nissan Qashqai (+30.2%) also shine in the remainder of the Top 10. The Fiat 600 (+5105.8%) celebrates one year in market with a record 15th place, inside the Top 20 for the 2nd month in a row and ever. The new MG 3 soars to an all-time high #21 while the BYD Seal U is up to a record #34 for its 2nd month into the Top 50 just as the Renault Symbioz breaks into it for the first time at #48.
Previous month: Italy February 2025: Fiat (-16.1%) embattled but in the lead
One year ago: Italy March 2024: Market down -3.7%, BEVs off -34.5%
Full March 2025 Top 51 All brands and Top 50 models below.
Italy March 2025 – brands:
PosBrandMar-25%/24Feb2025%/24PosFY241Fiat16,6379.7%– 2.2%147,29410.7%– 6.4%112Toyota12,6937.4%– 1.9%233,8797.6%– 0.2%223Volkswagen12,0277.0%– 9.9%430,7156.9%– 5.8%434Peugeot10,6846.2%+ 27.8%525,5915.8%+ 5.1%565Dacia9,3325.4%+ 9.5%331,0877.0%+ 11.8%346Renault8,6475.0%+ 12.5%920,6264.6%– 1.5%657Jeep7,5614.4%+ 7.1%819,7494.4%– 5.2%798Ford7,4554.3%+ 0.3%1118,0474.1%– 10.2%1189BMW6,8574.0%+ 6.0%619,5984.4%+ 4.4%8710MG6,5823.8%+ 65.8%1215,3563.5%+ 54.7%121611Mercedes6,4573.7%+ 7.1%1315,0453.4%+ 20.9%131212Nissan6,4383.7%+ 22.9%1413,6493.1%+ 5.7%141913Audi6,3273.7%+ 1.2%1018,7574.2%– 2.2%91014Citroen6,2103.6%– 9.4%718,1274.1%– 8.7%101115Opel5,1743.0%+ 10.3%1811,5362.6%– 15.5%171516Kia4,9792.9%+ 10.6%1712,3612.8%+ 1.4%161417Hyundai4,8532.8%+ 4.2%1512,6722.9%– 7.8%151318Alfa Romeo3,9162.3%+ 45.0%208,5011.9%+ 30.3%202119Suzuki3,6792.1%+ 8.6%199,3522.1%– 14.4%191820Skoda3,5382.1%– 3.8%1610,0342.3%+ 3.0%181721Cupra2,6481.5%+ 61.2%225,1971.2%+ 15.7%212422Tesla2,2171.3%+ 51.3%283,4690.8%– 6.7%262523BYD1,7871.0%+ 2452.9%233,9630.9%+ 2408.2%233724Seat1,5010.9%+ 45.2%322,7740.6%– 28.9%292825DR Motor1,4450.8%+ 122.7%214,2721.0%+ 5.1%222326Mini1,4090.8%+ 5.6%253,5620.8%– 4.3%252727Volvo1,3610.8%– 44.4%243,6970.8%– 36.4%242228Mazda1,1940.7%– 16.3%273,0160.7%– 29.9%272629Lancia1,1100.6%– 77.1%262,9260.7%– 77.4%282030Omoda+Jaecoo9870.6%+ 4600.0%342,0560.5%+ 3163.5%323831Land Rover9840.6%+ 26.0%302,2790.5%– 11.0%302932Honda7890.5%+ 3.7%292,2320.5%+ 7.3%313133Porsche7010.4%– 33.2%351,7810.4%– 31.7%343034DS6830.4%– 6.8%361,3810.3%– 17.9%363435EVO6800.4%+ 42.9%311,9800.4%+ 25.2%333236Lexus6530.4%+ 47.4%331,7530.4%+ 40.5%353337Subaru2740.2%+ 82.7%395820.1%+ 44.4%384038EMC2140.1%+ 151.8%386150.1%+ 97.1%374139Mitsubishi1700.1%– 60.7%415260.1%– 30.7%393540Sportequipe1590.1%+ 178.9%423750.1%– 25.7%424341Maserati1530.1%– 56.2%404740.1%– 40.9%403942Mahindra1150.1%+ 342.3%374010.1%+ 383.1%415043Jaguar890.1%– 35.0%471460.0%– 62.8%464444Ferrari870.1%+ 14.5%442290.1%+ 1.8%444545Smart580.0%– 86.0%432500.1%– 71.6%433646Lamborghini530.0%– 10.2%451550.0%+ 18.3%454647Polestar360.0%+ 38.5%46900.0%+ 143.2%484948Lynk & Co320.0%– 76.1%491100.0%– 60.6%474249Lotus310.0%– 3.1%48770.0%– 6.1%494850SsangYong130.0%– 68.3%51540.0%– 58.5%504751Aston Martin80.0%– 11.1%50370.0%+ 23.3%5151 –Others5360.3%+ 382.9% –1,4650.3%+ 268.1% – –
Italy March 2025 – models:
PosModelMar-25%/24Feb2025%/24PosFY241Fiat Panda12,5877.3%+ 6.6%137,8088.5%+ 10.1%112Dacia Sandero5,1763.0%– 6.5%216,6503.8%– 6.9%223Citroen C35,1163.0%+ 13.9%315,4573.5%+ 12.7%344Jeep Avenger4,9572.9%+ 51.8%414,3073.2%+ 35.0%435Peugeot 2084,8562.8%+ 51.2%811,6742.6%+ 27.8%576Toyota Yaris3,7932.2%+ 0.9%510,2952.3%+ 22.8%787MG ZS3,7752.2%+ 37.2%79,3902.1%+ 25.7%8148Toyota Yaris Cross3,7352.2%– 3.0%99,2972.1%– 12.4%959Nissan Qashqai3,5812.1%+ 30.2%117,1771.6%+ 3.9%122210Opel Corsa3,5592.1%+ 73.6%147,9631.8%+ 30.4%101511Renault Clio2,9741.7%– 2.7%186,9941.6%– 14.6%14612Renault Captur2,9691.7%+ 1.3%127,7951.8%– 6.4%111013Ford Puma2,9271.7%– 2.6%197,0741.6%– 14.7%131314Dacia Duster2,8631.7%+ 10.8%610,7392.4%+ 27.9%61215Fiat 6002,7071.6%+ 5105.8%176,3411.4%+ 2948.6%17n/a16Kia Sportage2,5551.5%+ 5.1%255,6101.3%– 8.2%211817VW T-Roc2,5101.5%– 26.2%106,9811.6%– 17.0%151118VW T-Cross2,3441.4%– 15.5%216,4451.5%+ 5.6%161619Peugeot 20082,2941.3%– 15.8%136,1961.4%– 26.9%181720BMW X12,2171.3%+ 26.0%205,7561.3%+ 13.5%202021MG 32,1451.2%new324,3901.0%new26n/a22Nissan Juke2,1431.2%+ 13.7%265,0081.1%+ 15.2%243523VW Tiguan2,1371.2%+ 70.4%165,9681.3%+ 84.0%192124Toyota Aygo X2,0321.2%– 7.1%225,4031.2%– 4.0%231925Alfa Romeo Tonale1,8481.1%+ 13.2%n/a3,0960.7%– 34.3%382826Peugeot 30081,7971.0%+ 53.6%234,4421.0%+ 40.4%253927Toyota C-HR1,7961.0%+ 19.7%155,6051.3%+ 37.2%222528VW Taigo1,7241.0%+ 9.7%n/a2,8900.7%– 20.7%434729Tesla Model 31,5650.9%+ 157.0%n/a2,2070.5%+ 72.6%n/an/a30Alfa Romeo Junior1,5630.9%new274,3271.0%new27n/a31VW Golf1,5300.9%– 5.0%244,2381.0%+ 23.6%283132Mercedes GLA1,5110.9%– 10.1%393,6020.8%– 2.6%322933Ford Focus1,4740.9%– 12.5%313,3870.8%– 7.8%353834BYD Seal U1,4600.8%new452,8300.6%new45n/a35Skoda Fabia1,3320.8%+ 31.0%383,0550.7%+ 25.2%394536Audi A31,3280.8%+ 9.8%283,9470.9%+ 0.2%293737Jeep Compass1,3260.8%– 15.8%472,7540.6%– 43.8%462738Hyundai Tucson1,3080.8%+ 4.3%353,5790.8%+ 19.4%333639Hyundai i101,2760.7%+ 15.1%293,6040.8%– 14.6%312640Suzuki Swift1,2720.7%+ 89.0%442,8420.6%+ 21.1%444341Ford Kuga1,2710.7%+ 8.1%333,2680.7%– 22.6%363342Ford Tourneo Courier1,2320.7%+ 44.9%432,9280.7%+ 98.4%41n/a43Jeep Renegade1,2210.7%– 47.5%502,5920.6%– 54.3%503044Audi Q31,1340.7%– 16.2%363,7520.8%– 3.6%302345Cupra Leon1,1290.7%+ 128.5%n/a1,6550.4%+ 13.0%n/an/a46Suzuki Vitara1,1130.6%+ 7.1%343,1310.7%– 2.6%374147Lancia Ypsilon1,1100.6%– 77.1%412,9260.7%– 77.4%42948Renault Symbioz1,1090.6%newn/an/an/anewn/an/a49Kia Picanto1,0990.6%+ 20.5%403,4990.8%+ 38.0%343450DR 5.09200.5%n/a422,6740.6%n/a4748n/aBMW Serie 18910.5%+ 36.2%372,6290.6%+ 11.5%49n/an/aAudi A18690.5%+ 9.2%462,6700.6%+ 46.6%48n/an/aSkoda Kamiq8400.5%– 21.1%302,9590.7%n/a4049
Source: UNRAE


