Iceland August 2024: Sales off -60.2%, Honda, BMW excel, Tesla down -84.9%
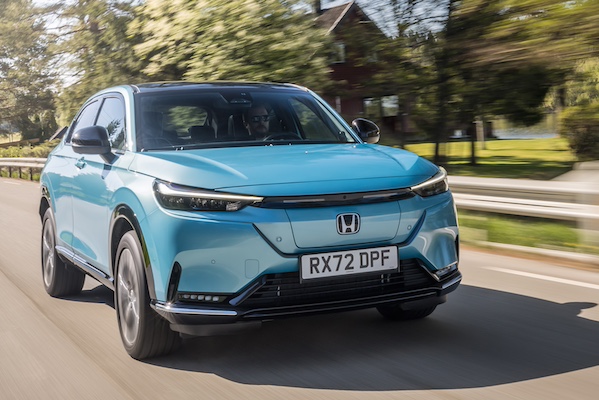
The Honda e:Ny1 ranks #4 in Iceland in August.
The Icelandic new car market craters -60.2% year-on-year in August to just 464 sales, leading to a year-to-date tally off -39.8% to 7,651. Toyota (-33.6%) improves its share to 18.8% vs. 13.2% so far this year and now ranks #2 year-to-date. Kia (-51.7%) sells less than half that of Toyota for the month but retains the year-to-date crown at 14.8% share. Tesla (-84.9%) is equal #2 with 9.3% of the market vs. 24.4% a year ago in August 2023. Volvo (+3%), Honda (+450%) and BMW (+53.8%) defy the stumbling market with year-on-year lifts.
Over in the models aisle, the Tesla Model Y reclaims the lead albeit at a much more reasonable share: 7.5% vs. 23.5% a year ago. The Model Y now stands at a disappointing 6th place year-to-date. The Toyota RAV4 is pushed down to #2 ahead of the new Volvo EX30. The Honda e:Ny1 claims its first ever appearance inside the Icelandic Top 20, landing directly at #4. It distances the Toyota Yaris, Land Cruiser Prado and Hyundai Tucson. Notice also the BMW iX3 at #11 and the Tesla Model 3 at #13 vs. #45 year-to-date.
Previous month: Iceland July 2024: Sales down -34%, BYD Seal U up to #7
One year ago: Iceland August 2023: Tesla Model Y up to record 23.5% share, Subaru Forester #3
Full August 2024 Top 34 All brands and Top 20 models below.
Iceland August 2024 – brands:
PosBrandAug-24%/23Jul2024%/23PosFY231Toyota8718.8%– 33.6%11,00913.2%– 56.6%222Kia439.3%– 51.7%21,13414.8%– 29.1%133Tesla439.3%– 84.9%92963.9%– 84.2%714Volvo347.3%+ 3.0%62543.3%– 28.5%1075Skoda275.8%– 6.9%34045.3%+ 15.4%596Honda224.7%+ 450.0%19911.2%+ 75.0%18267Hyundai224.7%– 60.0%596912.7%+ 50.2%368BMW204.3%+ 53.8%101141.5%– 26.9%14189Volkswagen194.1%– 75.9%201742.3%– 75.3%13510Mercedes173.7%– 63.0%82092.7%– 35.7%111011Land Rover163.4%– 36.0%132893.8%– 1.4%81112BYD122.6%+ 0.0%7731.0%+ 97.3%212813Jeep102.2%– 16.7%12911.2%– 2.2%172214Lexus102.2%+ 0.0%17500.7%– 50.5%252315Mazda102.2%– 72.2%142613.4%– 39.3%9816Peugeot 91.9%– 25.0%16620.8%– 66.5%232017Audi81.7%– 60.0%24520.7%– 71.7%241718Nissan81.7%– 52.9%42082.7%+ 31.6%121619Ford71.5%– 66.7%26861.1%– 62.6%191220Capron51.1%n/a –360.5%+ 350.0%284121Renault51.1%– 16.7%15991.3%– 58.8%161422Citroen40.9%– 81.8%34180.2%– 78.6%342523Dacia40.9%– 92.7%117469.7%– 29.6%4424Polestar40.9%– 87.1%18440.6%– 75.0%261525Opel30.6%– 80.0%31240.3%– 77.6%332426Porsche30.6%+ 50.0%30260.3%– 29.7%313027Benimar20.4%n/a25320.4%+ 357.1%304428Ssangyong/KG Mobility20.4%n/a291061.4%+ 488.9%153629Subaru20.4%– 95.8%21821.1%– 41.4%201930Alfa Romeo10.2%+ 0.0% –30.0%+ 200.0%495031Great Wall Motors10.2%n/a3840.1%+ 100.0%473932MG10.2%– 94.4%27240.3%– 82.5%322133Randger10.2% n/a3250.1%+ 66.7%444534Suzuki10.2%– 90.0%333204.2%+ 4.6%613
Iceland August 2024 – models:
PosModelAug-24%Jul2024%/23PosFY231Tesla Model Y357.5%62503.3%– 85.2%612Toyota RAV4316.7%12963.9%– 45.4%343Volvo EX30173.7%n/a580.8%new32 –4Honda e:NY1153.2%n/a270.4%new65n/a5Toyota Yaris 143.0%181772.3%– 59.5%1076Toyota Land Cruiser Prado122.6%141552.0%– 64.8%1357Hyundai Tucson112.4%52142.8%+ 59.7%7208Kia Sorento91.9%121772.3%+ 16.4%9189Skoda Kodiaq91.9%131181.5%+ 31.1%173410Toyota Yaris Cross81.7%n/a901.2%n/a202611BMW iX371.5%n/a200.3%n/a78n/a12Kia EV671.5%n/a460.6%– 61.3%401613Tesla Model 371.5%n/a440.6%– 65.4%451414Ford Puma61.3%n/a390.5%– 4.9%526115Honda CR-V 61.3%n/a450.6%n/a44n/a16Kia Ceed61.3%171842.4%– 23.3%81317Kia Niro61.3%8640.8%– 65.8%311018Kia Sportage61.3%43524.6%– 20.9%2619Land Rover Defender61.3%n/a1191.6%– 17.9%162120Skoda Octavia61.3%21632.1%+ 246.8%116421Toyota Corolla61.3%n/a841.1%– 63.0%221222Volvo XC6061.3%16731.0%+ 1.4%233123Hyundai i2010.2%n/a2553.3%+ 64.5%519
Source: Manufacturers

