
Germany August 2024: Market off -27.8%, BEVs down -68.8%, Opel Astra outsells VW Golf
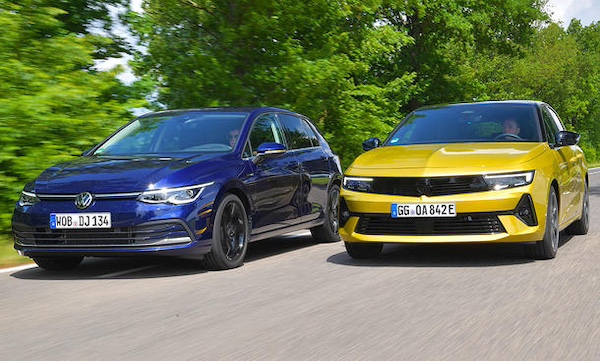
The Opel Astra outsells the VW Golf for the first time in over 32 years.
It’s a bloodbath this month for German new car sales, down -27.8% year-on-year in August to just 197,322. This mediocre result tilts the year-to-date tally into negative at -0.3% to 1,907,226. We are now -37% below the pre-pandemic August 2019 volume (313,748) and -24% below the 8 months 2019 result (2,495,536). Of note is the implosion of BEV sales off -68.8% year-on-year to 27,024 and 13.7% share vs. 86,649 and 31.7% share, admittedly helped by the year-ago rush to register EV before subsidies dry out. YTD BEV sales are down -32% to 241,911 and 12.7% share vs. 18.6% over the first 8 months of 2023.
Third consecutive month at #1 for the VW T-Roc.
Looking at the brands ranking, Volkswagen (-23.3%) holds 17.9% of the market vs. 19.2% so far this year, with Mercedes (-15.5%) and BMW (-23%) also containing their losses somewhat. Skoda (+0.03%) manages the impressive feat of staying stable year-on-year and overtakes Audi (-36.6%) – hit particularly hard – both for the month and year-to-date to #4. Seat (-10.1%), Toyota (-12.3%) and Opel (-17.1%) also resist but Ford (-28%) and Hyundai (-31.2%) fall fast. Volvo (+18.8%), Lexus (+17%), Peugeot (+16.9%) and Mitsubishi (+7.1%) are among the rare year-on-year gainers further down the charts. Tesla is off -65.7% and the Chinese carmakers freefall: MG is down -75.8%, GWM down -88.7% and BYD down -89.3%.
The Alfa Romeo Junior has landed in the German charts.
Model-wise, the VW T-Roc (-11.4%) threepeats at #1 with 2.9% share, still not enough to grab the YTD lead. Below the VW Tiguan (-1.3%) is up two spots on July to #2, the event of the month is the Opel Astra (+102.3%) more than doubling its sales year-on-year to overtake its (former) archenemy the VW Golf (-35.6%). According to our records, the last time the Astra outsold the Golf was in 1992 when the first generation Astra topped the charts from January to March. The Astra now ranks #5 year-to-date vs. #29 over the Full Year 2023. The Skoda Octavia (+19.7%) posts a stellar year-on-year increase to remain inside the Top 5. Excellent month as well for the VW Polo (+41.2%) up 11 ranks on last month to #6. We welcome the Alfa Romeo Junior at #234 and the Renault 5 at #269.
Previous month: Germany July 2024: VW T-Roc repeats at #1, Skoda Karoq signs first Top 10 finish, BEVs off -36.8%
One year ago: Germany August 2023: Market up 37.3%, Fiat 500 up to #3, GWM Funky Cat and BYD Atto 3 surge
Full August 2024 Top 62 All brands and Top 348 All models below.
Germany August 2024 – brands:
PosBrandAug-24%/23Jul2024%/23PosFY231Volkswagen35,35917.9%– 23.3%1365,96519.2%+ 4.6%112Mercedes19,4379.9%– 15.5%2169,2998.9%– 10.8%223BMW16,1408.2%– 23.0%3152,0098.0%+ 0.3%344Skoda14,4517.3%+ 0.0%5137,5977.2%+ 23.2%455Audi13,5506.9%– 36.6%4137,1507.2%– 17.8%536Opel12,1426.2%– 17.1%6101,7585.3%+ 8.1%667Ford8,4184.3%– 28.0%868,5483.6%– 16.7%878Hyundai7,8854.0%– 31.2%766,0103.5%– 7.7%989Seat7,3633.7%– 10.1%975,1433.9%+ 31.7%7910Toyota6,8003.4%– 12.3%1060,0583.1%+ 13.7%101111Kia5,4502.8%– 38.5%1147,8152.5%– 7.2%121212Peugeot4,8752.5%+ 16.9%1542,8632.2%+ 36.0%141713Dacia4,5022.3%– 38.1%1248,7682.6%+ 2.4%111314Fiat4,0572.1%– 52.3%1345,1632.4%– 13.3%131015Volvo3,9342.0%+ 18.8%1441,2752.2%+ 55.3%152016Renault3,6721.9%– 45.2%1833,6011.8%– 23.0%171417Cupra3,2341.6%– 47.7%1731,3571.6%+ 1.0%181618Citroen2,9811.5%– 21.3%1638,5952.0%+ 47.1%162119Mazda2,6841.4%– 30.6%1929,7441.6%– 0.6%191820Mini2,6191.3%– 44.6%2020,1261.1%– 34.9%241921Tesla2,3701.2%– 65.7%2126,0891.4%– 44.7%201522Suzuki2,2321.1%– 18.4%2316,9190.9%+ 2.8%252423Nissan1,9891.0%– 27.5%2220,6741.1%– 1.1%222324Porsche1,8951.0%– 18.0%2425,8511.4%+ 9.4%212225Mitsubishi1,8670.9%+ 7.1%2620,2581.1%+ 91.1%232626Land Rover7710.4%– 35.9%278,5460.4%– 9.8%282927Jeep7080.4%– 66.2%287,8980.4%– 11.6%292828Smart6500.3%– 77.9%309,6700.5%– 23.3%272729Honda5950.3%– 25.5%294,9200.3%+ 20.5%303030MG Roewe5940.3%– 75.8%2516,0270.8%+ 13.7%262531Lexus5100.3%+ 17.0%323,1470.2%+ 43.8%323632Alfa Romeo3650.2%– 24.7%314,5260.2%+ 7.6%313233Subaru3640.2%– 33.0%342,9810.2%– 2.0%333434GWM2490.1%– 88.7%361,8940.1%– 38.1%363335BYD2180.1%– 89.3%371,6500.1%– 38.1%373536DS1920.1%– 11.1%352,0820.1%+ 35.1%353837Polestar1880.1%– 75.1%332,1950.1%– 55.8%343138Ferrari1400.1%+ 4.5%381,4600.1%+ 13.2%394239Man1050.1%– 7.1%391,0040.1%– 36.1%414140Jaguar990.1%– 59.1%421,6070.1%– 25.2%383741Lamborghini860.0%+ 1.2%409060.0%+ 27.6%424742SsangYong740.0%– 82.7%411,3200.1%– 19.5%404043Iveco710.0%+ 22.4%447710.0%+ 26.0%434844Genesis 690.0%– 51.1%436130.0%– 30.1%444345Ineos420.0%– 60.4%463690.0%– 24.8%474646Lotus370.0%+ 37.0%482310.0%+ 11.1%505347NIO350.0%– 91.5%513010.0%– 62.6%494448Xpeng330.0%new54800.0%new56 –49Maserati310.0%– 50.0%453780.0%– 54.7%464550Vinfast230.0%new59590.0%new57 –51Alpine180.0%– 14.3%533410.0%+ 20.1%485152Rolls-Royce170.0%– 43.3%522260.0%+ 0.4%525253Lucid 130.0%+ 44.4%55860.0%+ 53.6%555754Aston Martin120.0%– 67.6%492290.0%– 32.4%515055Morgan120.0%+ 140.0%56510.0%+ 24.4%585956Bentley90.0%– 82.7%475150.0%– 15.6%454957Lada70.0%– 46.2%58320.0%– 75.4%615658Cadillac60.0%– 80.0%501370.0%– 42.9%535459Maxus30.0%– 70.0%61500.0%+ 47.1%595860Fisker20.0%new621320.0%new545561Lynk & Co20.0%– 98.9%57480.0%– 97.7%603962Aiways00.0%– 100.0%60270.0%– 41.3%6260 –Others1,0660.5%– 33.3% –8,0820.4%– 20.7% – –
Germany August 2024 – models:
PosModelAug-24%/23Jul2024%/23PosFY231VW T-Roc5,7072.9%– 11.4%154,1072.8%+ 10.4%222VW Tiguan4,5182.3%– 1.3%442,3722.2%– 1.0%333Opel Astra4,3152.2%+ 102.3%733,3951.8%+ 134.3%5294VW Golf4,2582.2%– 35.6%270,0703.7%+ 37.1%115Skoda Octavia3,8341.9%+ 19.7%336,2021.9%+ 21.9%4106VW Polo3,5991.8%+ 41.2%1726,0621.4%+ 38.0%9167Opel Corsa3,5891.8%– 35.1%527,8261.5%– 21.4%748VW Passat3,2091.6%– 14.6%633,1081.7%+ 5.0%659Mercedes GLC2,7241.4%– 1.8%1519,9531.0%– 3.7%221710BMW X12,6611.3%– 42.5%922,1721.2%– 6.5%131111Mini All2,6191.3%– 44.6%2220,1261.1%– 34.9%21712VW Taigo2,6041.3%+ 72.2%3319,6341.0%+ 32.4%243913VW T-Cross2,5641.3%+ 23.7%1421,0501.1%+ 5.4%192214Toyota Yaris/Cross2,4861.3%+ 2.8%1319,8281.0%– 0.7%232315Audi A62,4341.2%+ 6.2%2615,0400.8%– 28.8%391816Mercedes C-Klasse 2,3981.2%– 25.6%2818,5811.0%– 42.9%27917BMW 3er2,3831.2%– 26.6%1024,5221.3%+ 5.4%121518BMW 5er2,1871.1%+ 31.0%1215,3340.8%– 5.5%353519Skoda Karoq2,1821.1%+ 66.8%821,1791.1%+ 52.9%164420Fiat Ducato2,1391.1%+ 34.1%1621,0991.1%+ 32.2%184521Opel Mokka2,0941.1%– 50.4%3914,3080.8%– 27.0%462122Dacia Sandero2,0581.0%+ 34.7%2921,1241.1%+ 37.3%173223BMW X31,9841.0%– 22.0%3018,1841.0%+ 15.8%282624Ford Focus1,9581.0%– 10.6%1815,5310.8%– 17.3%312825Tesla Model Y1,9571.0%– 59.2%4120,5451.1%– 40.8%20826VW Transporter1,9561.0%+ 0.4%1124,9881.3%+ 18.8%102027Seat Leon1,9391.0%– 30.6%2026,5071.4%+ 62.8%82528Seat Arona1,9351.0%+ 49.1%4013,9190.7%+ 34.3%477029Skoda Fabia1,8871.0%+ 6.8%2719,4731.0%+ 47.5%254930Skoda Enyaq1,8490.9%– 44.7%5013,1970.7%+ 1.4%523131Seat Ibiza1,8020.9%+ 85.6%3415,4940.8%+ 59.8%327332Ford Kuga1,7900.9%– 26.5%4315,3320.8%+ 11.9%363733BMW 2er1,7200.9%+ 9.8%5613,4040.7%– 4.3%504734Mercedes E-Klasse 1,7120.9%+ 35.4%3215,8870.8%+ 14.0%294135Audi A41,6940.9%– 43.1%2524,7211.3%+ 2.8%111336Seat Ateca1,6870.9%– 28.8%4915,1040.8%– 2.7%383837BMW 4er1,6480.8%– 28.0%4215,4020.8%– 8.6%332438Hyundai Tucson1,6150.8%+ 41.9%5214,5890.8%+ 24.0%445039Skoda Kodiaq1,6070.8%– 14.0%3114,8860.8%– 3.7%413440Fiat 500 lineup1,5650.8%– 74.8%2318,9721.0%– 34.8%26641Audi Q31,5210.8%– 37.4%2115,7210.8%– 12.8%302742Cupra Born1,5130.8%– 56.5%519,4400.5%– 15.2%735643Skoda Kamiq1,5010.8%+ 21.9%3815,3400.8%+ 36.8%345844Cupra Formentor1,4920.8%– 44.9%3721,6861.1%+ 9.0%141945Kia Ceed/Xceed1,4870.8%+ 8.5%4414,6170.8%+ 3.2%434346Audi Q51,4400.7%– 41.4%4710,8300.6%– 39.3%623047VW ID.71,4380.7%+ 5035.7%744,6250.2%+ 16417.9%11623448VW Touran1,4240.7%+ 15.8%3512,7710.7%+ 13.5%545949Ford Puma1,4200.7%– 43.7%8312,8840.7%– 12.1%534050Peugeot 20081,4150.7%+ 23.7%6110,4710.5%+ 62.2%659651Hyundai i101,4130.7%+ 42.4%4810,2240.5%– 11.1%666952Audi A31,4120.7%– 54.2%1921,2161.1%– 5.9%151453Dacia Duster1,3520.7%– 12.4%3614,9330.8%+ 9.0%405454Mercedes A-Klasse 1,3440.7%+ 39.4%5911,4940.6%– 17.3%584255Mercedes CLA-Klasse1,3440.7%– 29.1%5411,4780.6%– 12.2%595356Mercedes V-Klasse/EQV1,2980.7%– 34.5%2414,4830.8%+ 0.7%454857Audi A11,2630.6%+ 25.3%668,3480.4%– 27.7%796458Peugeot 2081,2120.6%+ 21.3%707,9070.4%+ 7.9%829259Toyota Aygo X1,1740.6%– 14.6%6511,6790.6%+ 37.5%578660Toyota Corolla/Cross1,1740.6%– 22.4%4511,2550.6%+ 24.2%607561Kia Sportage1,1680.6%+ 19.7%5810,7020.6%+ 4.7%646762VW Caddy1,1600.6%+ 8.3%5512,3460.6%+ 11.1%566163Hyundai Kona1,1330.6%– 66.4%718,8710.5%– 49.0%753364Dacia Jogger1,0520.5%– 10.1%639,9190.5%– 4.4%696865Opel Grandland X1,0510.5%– 1.2%6812,7510.7%+ 38.8%556566Volvo XC601,0490.5%+ 23.1%6013,5390.7%+ 51.0%486067Skoda Superb1,0480.5%+ 1.0%5710,8900.6%+ 3.9%616668Hyundai i201,0380.5%+ 24.3%898,8510.5%+ 39.5%769069Peugeot 3081,0220.5%+ 160.7%728,2750.4%+ 123.8%8013670Hyundai i301,0100.5%+ 42.1%789,5790.5%+ 27.3%718371Toyota C-HR9960.5%+ 120.4%887,0020.4%+ 37.1%9211272Mercedes GLA9820.5%+ 48.6%907,7000.4%+ 2.5%848073Mitsubishi Space Star9730.5%– 14.9%8510,2090.5%+ 33.4%677974Citroen C4/C4 X/Spacetourer9340.5%– 13.0%807,1970.4%+ 83.3%9111175BMW X59080.5%– 10.7%768,4950.4%+ 3.4%787676Opel Crossland8940.5%+ 15.2%7910,1210.5%+ 20.7%687777Audi Q28940.5%– 20.5%469,4810.5%– 17.6%725778Audi Q48930.5%– 60.6%679,2530.5%– 22.9%745579Kia Picanto8930.5%– 15.2%926,4240.3%– 1.6%9710180Mercedes EQA8790.4%– 59.7%1026,9900.4%– 30.1%937181VW ID.38690.4%– 76.1%8615,1140.8%– 12.5%373682Nissan Qashqai8610.4%– 17.4%818,7890.5%– 17.1%776383Volvo XC408330.4%– 35.2%777,7270.4%– 5.2%838284Mercedes GLE8310.4%– 16.2%919,8940.5%+ 50.1%709185Audi A58220.4%– 17.3%877,6380.4%+ 7.9%858886Mercedes Vito8200.4%– 1.8%986,1580.3%– 6.7%1019587Mercedes B-Klasse8110.4%+ 12.6%1065,0900.3%– 22.0%11110088VW ID.4, ID.58080.4%– 85.8%6413,2140.7%– 53.0%511289Mazda CX-58060.4%– 10.6%1157,2710.4%– 4.9%878490Ford Transit Custom7820.4%n/a955,7950.3%n/a10226291Mercedes CLE7820.4%+ 1067.2%824,6600.2%+ 4560.0%11523592Hyundai Ioniq57780.4%– 64.5%695,7870.3%– 26.1%1038793Renault Clio7750.4%– 3.1%996,9320.4%– 2.9%948594Porsche Cayenne7620.4%+ 117.7%1047,2580.4%+ 77.2%8813595Citroen Jumper7580.4%+ 12.6%947,2250.4%– 0.9%909996Volvo EX307430.4%new736,8750.4%new9531697Suzuki Swift7090.4%+ 2.3%975,4410.3%+ 34.5%10713098Ford Transit, Tourneo7060.4%– 62.4%848,0590.4%– 45.8%815299Mazda26960.4%+ 68.5%1126,3060.3%+ 24.1%99106100BMW 1er6710.3%– 42.6%5313,5180.7%+ 2.9%4946101Suzuki Vitara6420.3%– 3.3%1204,0090.2%– 23.8%125114102Renault Captur6310.3%+ 14.9%1144,2360.2%– 31.9%12193103Renault Austral6190.3%– 20.8%1084,4330.2%– 19.7%119105104Mercedes Sprinter6170.3%– 3.4%966,2710.3%+ 3.4%100104105Mercedes EQB6090.3%– 40.4%1164,3430.2%– 20.4%120115106Volvo S/V605960.3%+ 141.3%935,3330.3%+ 93.2%108138107Kia Niro5800.3%– 69.4%1004,5030.2%– 10.2%118118108Citroen C5 X/Aircross5790.3%+ 29.2%1176,6180.3%+ 84.8%96132109Ford Explorer5560.3%+ 6077.8%1919830.1%+ 275.2%215281110Skoda Scala5430.3%– 20.3%1076,3970.3%+ 35.5%98116111Volvo XC905380.3%+ 39.7%1055,4570.3%+ 41.1%106129112Mercedes EQE5240.3%– 37.1%1035,4580.3%+ 33.0%105108113Smart #15170.3%– 71.2%1555,2280.3%+ 21.4%109124114Mazda CX-305100.3%– 30.3%1015,7430.3%+ 42.8%104120115Nissan Juke4990.3%+ 10.4%1214,6700.2%+ 45.3%114141116Kia EV64980.3%– 76.9%1253,5460.2%– 34.2%138110117Mercedes GLB4750.2%– 41.9%1095,1720.3%– 15.5%110103118Peugeot 30084730.2%– 30.5%1117,2480.4%+ 70.0%89109119Suzuki SX44710.2%+ 45.8%1732,2000.1%– 27.3%164155120Citroen C3/C3 Aircross4670.2%– 52.8%7514,8800.8%+ 211.8%4297121Ford Transit Connect4560.2%+ 57.8%1273,9030.2%+ 113.7%128182122Kia Stonic4220.2%+ 5.5%1323,7880.2%+ 4.7%131144123Toyota Proace4050.2%– 17.2%1103,6910.2%+ 1.9%134145124Mercedes G-Klasse3920.2%+ 14.3%1243,9930.2%– 4.7%126133125Tesla Model 33890.2%– 80.7%1265,0330.3%– 54.5%11262126Toyota RAV43870.2%– 0.3%1283,8970.2%+ 76.1%129159127Porsche Taycan3840.2%– 19.2%1432,0800.1%– 42.6%171139128BMW X23820.2%– 25.0%1193,2220.2%– 1.3%139153129VW Touareg3810.2%+ 46.0%1134,5660.2%+ 0.8%117121130Mitsubishi Eclipse Cross3760.2%+ 88.0%1651,9880.1%+ 116.6%173189131VW Crafter3700.2%+ 15.6%1393,0670.2%– 14.3%143148132Hyundai Bayon3650.2%+ 11.6%1303,1600.2%+ 140.7%140176133Ford Transit Courier3560.2%n/a1312,2620.1%+ 17300.0%161356134Mitsubishi Colt3540.2%new1423,9930.2%new127246135Suzuki Ignis3330.2%– 66.0%1184,7070.2%+ 32.0%113131136Jeep Compass3280.2%+ 55.5%1382,9560.2%+ 21.5%144161137Renault Arkana3170.2%– 24.0%1772,2340.1%– 43.1%162123138Nissan X-Trail2920.1%+ 0.0%1233,6640.2%+ 78.6%135165139BMW X42880.1%– 43.1%1483,0990.2%+ 1.0%142149140Jeep Avenger2570.1%– 84.7%1412,7010.1%– 14.4%150127141Fiat 6002570.1%new1758600.0%new224283142BMW iX2550.1%– 55.7%1532,6630.1%– 8.1%151140143Renault Kangoo2530.1%– 38.3%1513,6060.2%+ 13.1%137143144Peugeot Boxer2450.1%+ 15.6%1662,1630.1%– 5.8%165179145Mercedes S-Klasse2440.1%– 36.6%1452,3940.1%– 34.4%157146146Audi Q82410.1%– 51.0%1402,7740.1%– 36.8%148122147Hyundai Santa Fe2390.1%+ 22.6%1468600.0%– 45.3%225188148Porsche 9112380.1%– 64.9%1297,5850.4%+ 4.6%8698149Kia Sorento2370.1%– 47.7%1362,7060.1%+ 27.2%149154150Renault Symbioz2300.1%new2382970.0%new275 –151Audi Q8 e-Tron2270.1%– 74.9%1473,7810.2%– 42.6%13294152BMW X62250.1%– 4.7%1352,3980.1%+ 30.7%156181153Mercedes GLS2130.1%+ 27.5%1632,6310.1%+ 76.6%152201154VW Arteon2100.1%– 69.9%1333,8540.2%– 51.9%13078155Mazda32080.1%– 46.4%1542,3360.1%– 6.3%159162156BMW Z42040.1%+ 10.3%1502,5500.1%– 6.2%153168157VW ID.Buzz2030.1%– 80.2%1792,1560.1%– 34.7%166142158Peugeot 50082010.1%– 36.4%1813,6260.2%+ 33.1%136150159Audi Q72000.1%– 54.6%1371,8580.1%– 42.2%176152160MG 41880.1%– 89.8%6210,7700.6%+ 32.6%6374161BMW X71870.1%– 22.1%1522,2250.1%+ 34.2%163175162Ford Mustang Mach-E1870.1%– 59.9%1561,6270.1%– 45.2%179164163Audi Q61830.1%new1221,0340.1%new211 –164DS 71760.1%+ 95.6%1711,3530.1%+ 98.7%193231165Honda CR-V1750.1%+ 14.4%1901,0260.1%+ 47.0%212232166Peugeot 4081740.1%+ 241.2%1621,3520.1%+ 64.7%194233167Renault Espace1730.1%+ 40.7%1971,5090.1%+ 403.0%183251168Lexus LBX1680.1%new1937320.0%new236 –169Porsche Macan1660.1%– 64.1%2134,0920.2%– 20.1%123117170MG ZS1650.1%– 40.2%1922,8140.1%+ 4.8%145163171BMW 7er1650.1%– 41.7%1572,0220.1%+ 5.0%172172172Nissan Townstar1640.1%– 15.0%2081,5740.1%– 4.2%181185173Citroen Berlingo1630.1%– 61.8%1491,4780.1%– 73.9%185134174Mitsubishi ASX1610.1%– 59.5%2064,0370.2%+ 100.0%124173175Mercedes EQS1600.1%– 30.4%1641,7080.1%– 20.7%178174176GWM Funky Cat1570.1%– 92.9%1871,1760.1%– 61.3%200147177Range Rover Velar1560.1%+ 35.7%1851,3850.1%+ 16.1%190204178Porsche Panamera1550.1%+ 47.6%1611,4010.1%+ 43.4%188217179Alfa Romeo Stelvio1510.1%+ 23.8%1741,7080.1%+ 39.8%177206180Range Rover Evoque1510.1%– 23.0%1821,4020.1%– 29.3%187184181Hyundai Ioniq61500.1%– 89.4%1761,8990.1%– 55.9%175137182Range Rover 1450.1%– 2.7%1801,0790.1%+ 24.2%208218183MG 31440.1%new2163830.0%new262 –184Mazda CX-601430.1%– 78.4%1603,7510.2%– 7.0%133125185Mazda MX-51430.1%+ 34.9%1701,2180.1%– 26.6%198202186Ford Mustang1390.1%– 24.9%1951,1060.1%– 15.9%204216187Honda HR-V1390.1%– 29.8%1841,0990.1%+ 17.2%205208188Hyundai Staria1360.1%– 52.8%1862,1320.1%+ 19.4%167178189Land Rover Defender1360.1%– 60.6%1672,1300.1%– 29.8%168151190Smart #31330.1%new1781,3090.1%new197333191Cupra Tavascan1330.1%new –1400.0%new293 –192Lexus NX1300.1%+ 6.6%2209590.1%+ 37.0%217238193Renault Rafale1270.1%new2155930.0%new242 –194Subaru Forester1250.1%+ 47.1%1998320.0%– 8.8%229220195Mercedes Citan1230.1%– 74.7%2042,7900.1%– 38.3%146126196Range Rover Sport1200.1%– 44.7%1721,5100.1%+ 53.6%182213197Lexus RX1180.1%– 22.9%2346290.0%– 4.3%241236198Volvo S/V901160.1%– 14.7%1581,5010.1%+ 30.9%184205199Polestar 21140.1%– 84.9%1591,9600.1%– 60.5%174128200Renault Scenic1130.1%+ 151.1%2077940.0%– 18.9%231222201Nissan Primastar1120.1%– 0.9%2311,0890.1%+ 113.9%206256202Audi A71120.1%– 23.3%2148870.0%– 35.2%223193203Peugeot 5081090.1%+ 5.8%2021,3840.1%+ 37.3%191212204Kia EV91090.1%new1889080.0%new221272205Renault Trafic1040.1%– 55.4%1832,1210.1%+ 28.5%169180206Toyota bZ4X1020.1%– 88.8%2171,1420.1%– 57.7%203170207Man TGE1010.1%– 9.8%1949550.1%– 38.0%219207208Honda Civic990.1%+ 54.7%2107120.0%– 4.6%238228209Seat Tarraco960.0%– 87.1%2034,1980.2%– 12.4%122113210Renault Master960.0%+ 1100.0%2011,0840.1%+ 1517.9%207315211Subaru Outback950.0%– 41.4%2188460.0%+ 16.5%227225212Honda ZR-V940.0%+ 10.6%1895780.0%+ 121.5%244267213Alfa Romeo Tonale920.0%– 50.0%2001,6070.1%+ 6.0%180195214Mazda MX-30900.0%– 80.4%2129990.1%– 64.5%214158215Opel Zafira Life890.0%– 84.2%1341,4350.1%– 41.9%186171216BMW XM890.0%+ 3.5%2218190.0%+ 80.4%230243217Mazda6870.0%– 57.4%1682,1140.1%– 2.5%170166218Renault Megane800.0%– 95.0%2452,3000.1%– 62.4%160102219Citroen Jumpy800.0%– 55.6%1441,1930.1%+ 18.5%199221220Audi A8800.0%– 44.1%1981,0640.1%– 30.1%209187221Mercedes AMG GT800.0%– 5.9%2059590.1%– 4.8%218226222BYD Seal800.0%new2264030.0%new260349223Honda Jazz790.0%– 41.0%2227210.0%– 38.7%237210224Porsche Cayman770.0%– 38.4%2419170.0%– 5.8%220229225Subaru XV760.0%– 58.7%2274210.0%– 59.0%256215226Fiat Panda700.0%– 87.9%2442,7810.1%– 54.0%147119227Renault Twingo690.0%– 94.0%2582,3660.1%– 50.5%158107228Jeep Wrangler690.0%+ 115.6%2338480.0%+ 20.6%226247229Iveco Daily670.0%+ 19.6%2197400.0%+ 26.3%234248230MG RX6660.0%+ 633.3%2111,1560.1%– 6.3%201214231Alfa Romeo Giulia610.0%– 65.9%2091,1500.1%– 21.6%202194232BMW 8er610.0%– 39.6%2571,0550.1%– 19.1%210209233GWM Coffee 01610.0%+ 6000.0%2305600.0%+ 3900.0%245340234Alfa Romeo Junior610.0%new –610.0%new326 –235Jaguar F-Pace600.0%– 36.8%2566830.0%– 2.6%240227236Volvo C40590.0%– 85.5%2428430.0%– 49.3%228190237Opel Combo580.0%– 82.6%2241,3690.1%– 49.1%192169238Renault Koleos580.0%– 24.7%2863320.0%– 72.9%269211239Mercedes SL570.0%– 76.7%2298970.0%– 62.0%222183240Porsche Boxster530.0%– 8.6%2371,3220.1%+ 34.1%195224241Land Rover Discovery Sport520.0%– 56.7%2256890.0%– 32.8%239219242Kia Soul510.0%– 71.7%2744250.0%– 1.2%255266243Lamborghini Huracan510.0%+ 50.0%2354050.0%+ 42.6%259278244Jeep Renegade490.0%– 69.8%2391,3160.1%– 47.3%196156245Opel Movano480.0%n/a2494320.0%n/a254320246BYD Atto 3450.0%– 97.7%2544750.0%– 81.4%250160247BYD Seal U450.0%new2692560.0%new282 –248BYD Dolphin440.0%new2522880.0%new277330249Ineos Grenadier420.0%– 60.4%2593690.0%– 24.8%264239250Polestar 4420.0%new2231300.0%new296 –251Suzuki Swace400.0%– 20.0%2464150.0%– 9.4%257259252Dacia Logan390.0% n/a2622940.0%n/a276 –253Lexus UX380.0%– 17.4%2704010.0%+ 0.3%261254254Genesis GV70380.0%– 45.7%2433490.0%– 7.4%266260255Nissan Ariya370.0%– 80.3%2663110.0%– 46.7%272240256Audi e-Tron GT360.0%– 78.8%1691,0010.1%– 19.3%213199257Ferrari Purosangue360.0%new2502670.0%new279337258Lamborghini Urus350.0%– 31.4%2325010.0%+ 17.6%249263259Ferrari 296 GTB330.0%– 19.5%2404490.0%+ 67.5%251279260Polestar 3320.0%new2361040.0%new303 –261VW Up!310.0%– 98.8%2282,4100.1%– 80.3%15551262Subaru Solterra300.0%– 45.5%3411050.0%– 4.5%301312263Xpeng G9290.0%new295580.0%new331 –264MG 5280.0%– 89.1%2717760.0%– 49.4%233200265SsangYong Tivoli280.0%– 69.2%2484370.0%– 19.8%253249266Ferrari SF90/Stradale280.0%+ 0.0%2672310.0%– 1.3%285286267Fiat Tipo250.0%– 67.1%1961,3950.1%+ 87.0%189237268Lexus ES250.0%– 41.9%2682060.0%– 10.8%286284269Renault 5250.0%new –250.0%new351 –270Toyota Land Cruiser240.0%– 22.6%2735150.0%– 43.3%248230271Jaguar E-Pace240.0%– 71.1%2653570.0%– 8.0%265261272Subaru BRZ240.0%– 27.3%2552570.0%+ 52.1%281293273Ferrari Roma230.0%+ 155.6%2833040.0%+ 117.1%273305274Vinfast VF8230.0%new334580.0%new330 –275Audi TT220.0%– 92.6%2779610.1%– 45.2%216177276Lotus Emira200.0%+ 5.3%287970.0%– 48.9%306300277Nissan Leaf190.0%– 95.7%2794460.0%– 66.4%252203278Suzuki Jimny190.0%+ 850.0%338340.0%+ 142.9%343351279NIO ET5180.0%– 86.0%325910.0%– 67.1%307273280GWM Ora 07180.0%new310720.0%new319 –281Ssangyong Torres160.0%– 83.8%2613190.0%+ 222.2%270302282Suzuki Across160.0%– 23.8%2931180.0%+ 53.2%299280283Alpine A110150.0%– 28.6%2853380.0%+ 19.0%267274284SsangYong Rexton150.0%– 73.2%2823030.0%– 23.9%274268285SsangYong Korando150.0%– 91.7%2782590.0%– 56.7%280253286Peugeot Expert150.0%– 70.0%2961940.0%– 65.7%288258287Toyota Prius150.0%– 51.6%3391460.0%+ 114.7%291282288DS 4140.0%– 83.9%2645890.0%+ 1.2%243241289Maserati Grecale140.0%– 66.7%2902020.0%– 63.2%287255290Lotus Eletre140.0%+ 75.0%3071040.0%+ 511.8%302321291NIO ET7140.0%– 94.6%2941010.0%– 75.1%305265292Subaru Impreza140.0%– 30.0%305500.0%– 43.8%335313293Toyota Supra130.0%– 35.0%2971540.0%– 31.6%289291294Lucid Air130.0%+ 44.4%317860.0%+ 53.6%311318295GWM Coffee 02130.0%new292840.0%new313341296Toyota Mirai130.0%– 74.5%308810.0%– 46.7%315309297Tesla Model S120.0%– 72.1%2602680.0%– 70.2%278223298Tesla Model X120.0%– 76.0%2472430.0%– 55.3%284250299Aston Martin DBX120.0%– 45.5%2891520.0%– 12.6%290296300Land Rover Discovery110.0%– 82.0%2633330.0%– 11.2%268264301Lexus RZ110.0%– 83.6%303720.0%– 39.0%320311302Honda E:NY190.0%– 94.0%2537770.0%+ 388.7%232295303Peugeot Rifter90.0%– 96.0%3202430.0%– 89.7%283186304Genesis GV8090.0%– 60.9%315900.0%– 19.6%308307305Lexus LC90.0%+ 350.0%312790.0%+ 23.4%317327306Genesis GV6090.0%– 69.0%304690.0%– 67.9%322294307Lexus LM90.0%new288590.0%new329 –308Toyota GR8680.0%– 89.9%2845300.0%+ 112.0%247252309Jaguar F-Type80.0%– 69.2%2803180.0%– 17.2%271270310Bentley Bentayga80.0%– 61.9%3021430.0%– 38.4%292285311Audi R860.0%– 80.6%3015560.0%+ 178.0%246290312Maserati GranTurismo60.0%+ 500.0%323380.0%+ 26.7%341339313Lada Niva60.0%– 25.0%330270.0%– 62.5%347324314Cadillac Escalade50.0%+ 0.0%311790.0%+ 19.7%316323315Jeep Grand Cherokee50.0%– 68.8%321760.0%– 48.3%318288316Maserati Levante50.0%+ 0.0%309710.0%– 33.0%321314317Rolls-Royce Spectre50.0%new332630.0%new325353318Genesis G8050.0%– 16.7%324360.0%– 34.5%342325319Genesis G9050.0%new354200.0%new355360320Opel Vivaro40.0%– 66.7%2911130.0%+ 289.7%300322321Iveco Eurocargo40.0%+ 100.0%343300.0%+ 20.0%345342322Xpeng P740.0%new355150.0%new361 –323MG Marvel30.0%– 95.9%3131280.0%– 75.2%297257324Jaguar XE30.0%– 78.6%329660.0%– 76.4%324275325Genesis G7030.0%– 76.9%281590.0%– 50.0%328308326NIO EL630.0%new322480.0%new337332327Maxus Mifa 930.0%+ 50.0% –470.0%+ 176.5%339347328Maserati Ghibli30.0%– 50.0%347260.0%– 57.4%349326329Mercedes Atego30.0%– 40.0%331190.0%+ 11.8%358346330Lotus Emeya30.0%new316150.0%new360 –331Renault Zoe20.0%– 99.6%3197360.0%– 70.6%235167332Ford Fiesta20.0%– 99.9%2724110.0%– 95.5%25872333Fisker Ocean20.0%new3491300.0%new295298334Mercedes CLS20.0%– 97.7%3141230.0%– 82.3%298244335Jaguar XF20.0%– 83.3%3061010.0%– 59.6%304289336Toyota Highlander20.0%+ 100.0%340860.0%+ 681.8%312328337Jaguar i-Pace20.0%– 83.3%299820.0%– 43.4%314303338Rolls-Royce Cullinan20.0%– 75.0%326510.0%– 27.1%334319339Lynk & Co 0120.0%– 98.9%327480.0%– 97.7%336191340Mercedes Arocs20.0%+ 100.0%345200.0%+ 53.8%357354341Dacia Spring10.0%– 100.0%3002,4950.1%– 69.4%15481342Bentley Continental10.0%– 96.7%2753800.0%+ 1.1%263271343DS 310.0%– 97.2%2511310.0%– 48.0%294287344Cadillac XT410.0%– 96.0%276560.0%– 67.4%332301345Fiat Ulysse10.0%– 95.8%353230.0%– 43.9%352334346Man TGM10.0%n/a337200.0%n/a356n/a347Ferrari F810.0%– 88.9%348140.0%– 93.1%362299348BMW 6er10.0%– 95.8% –100.0%– 96.5%363277
Source: KBA

More Stories
Italy Full Year 2025: Fiat Panda #1 for 14th straight year, Grande Panda disappoints
This content is for members only. Visit the site and log in/register to read.
Spain Full Year 2025: Dacia Sandero and Renault Clio in the lead in strongest market in 6 years
This content is for members only. Visit the site and log in/register to read.
OEM vs Replica Wheels: What Drivers Really Need to Know
If you spend any time shopping for wheels online, you’ll notice something quickly: the same “look” can cost $200 from...
2027 Ram Power Wagon Finally Gets the Diesel It Deserves
Ram has been on a bit of a listening tour lately, and the 2027 Power Wagon feels like the loudest...
2027 Ram 1500 SRT TRX Roars Back with 777 HP and a Price Punch
Ram didn’t just bring the TRX back, it brought it back with a point to prove. After the supertruck bowed...
Saudi Arabia November 2025: Hyundai places Accent at #1 and i10 at #4
This content is for members only. Visit the site and log in/register to read.