UK August 2024: Volkswagen and Ford Puma dominate, Omoda launches
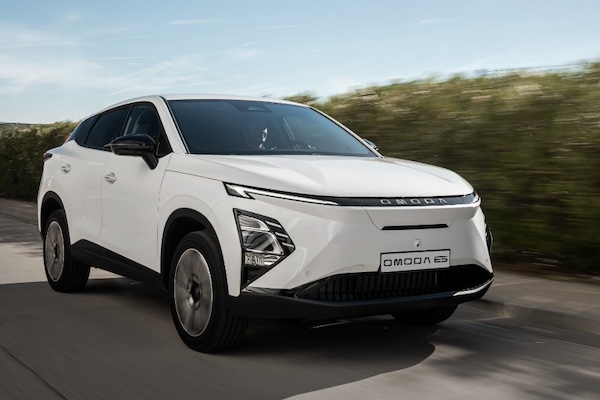
Omoda has landed in the UK market.
It’s a slight drop for new car sales in the UK in August at -1.3% year-on-year to 84,575, leading to a year-to-date tally up 5.1% to 1,238,855. Private sales are stable at +0.2% to 32,110 and 38% share vs. 37.4% a year ago, fleets edge down -1.2% to 51,329 and an unchanged 60.7% share and business sales sink -30.3% to 1,136. Year-to-date, the trend is different with private sales off -11.2% to 468,345 and 37.8% share vs. 44.7% over the first 8 months of 2023, while fleet sales grow 19.2% to 743,259 and 60% share vs. 52.9% over the same period last year. Business sales are off -3.3% to 27,251.
Looking at sales by propulsion, in August diesel is down -7.3% to 5,165 and 6.1% share vs. 6.5% last year, petrol actually falls faster at -10.1% to 42,872 and 50.7% share vs. 55.7%, BEVs step up 10.8% to 19,113 and 22.6% share vs. 20.1% in August 2023, this is their highest share since December 2022 (32.9%). PHEVs drop -12.3% to 5,786 and 6.8% share vs. 7.7% and HEVs shoot up 36.1% to 11,639 and 13.8% share vs. 10% a year ago. Year-to-date, diesel is off -13% to 80,093 and 6.5% share vs. 7.8% last year, petrol is stable at +0.8% to 674,312 and 54.4% share vs. 56.7%, BEVs are up 10.5% to 213,544 and 17.2% share vs. 16.4%, PHEVs grow 24.9% to 100,457 and 8.1% share vs. 6.8% and HEVs are up 17.9% to 170,440 and 13.8% share vs. 12.3% over the first 8 months of 2023.
Source: SMMT
As for the brands ranking, Volkswagen (-4.2%) holds onto the top spot with 9.4% share vs. 8.5% so far this year. Audi (+2.1%) is up two spots on July to #2 while Ford (-28.8%) rallies back up three ranks on last month to #3 but endures the largest year-on-year fall in the Top 10 bar Vauxhall (-41.3%). Kia (+2%) drops one spot to #3, distancing BMW (-3.9%) and a resurgent Mercedes (+21%). Skoda (+4%) and Toyota (+1.7%) post small gains in the remainder of the Top 10. At #8, this is Skoda’s highest ranking since February 2023 (#6). There are a slew of high performing carmakers further down the charts, including Honda (+95.6%), Land Rover (+83.4%), Volvo (+72%), Renault (+39%) and Seat (+37.4%). BYD advances 1227.3% and Omoda makes its landing in the UK market at #40.
Model-wise the Ford Puma (+5.8%) reclaims the top spot it holds year-to-date for the first time since last April, ending three consecutive months of Kia Sportage reign. The latter is up 51.3% year-on-year at #2. The Tesla Model 3 (-9.2%) and Model Y (-36.5%) reappear inside the Top 10 at #3 and #5 respectively. The Model Y is outside the YTD Top 10 whereas it ranked #5 over the Full Year 2023. Outstanding year-on-year progressions for the VW Polo (+40.7%), Volvo XC40 (+38.6%), Nissan Qashqai and VW Golf (+16.7%).
Previous month: UK July 2024: Kia Sportage threepeats at #1, Volvo XC40 up to record #4
One year ago: UK August 2023: Ford Puma and Tesla Model Y top market up 24.4%
Full August 2024 Top 48 brands and Top 10 models below.
UK August 2024 – brands:
PosBrandAug-24%/23Jul2024%/23PosFY231Volkswagen7,9889.4%– 4.2%1105,5868.5%+ 4.5%112Audi 6,2137.3%+ 2.1%480,9586.5%– 5.1%333Ford 5,3036.3%– 28.8%669,8525.6%– 23.3%524Kia4,7555.6%+ 2.0%374,8856.0%+ 2.5%465BMW 4,5665.4%– 3.9%284,2786.8%+ 28.3%246Mercedes 4,4135.2%+ 21.0%763,7765.1%+ 21.7%797Toyota4,1704.9%+ 1.7%962,6715.1%– 8.8%858Skoda3,8874.6%+ 4.0%1346,7293.8%+ 4.9%12129Hyundai3,8284.5%– 6.2%857,7924.7%+ 1.5%91010Vauxhall 3,2653.9%– 41.3%1254,0554.4%– 13.5%10711Peugeot 3,2033.8%+ 2.9%1542,4893.4%+ 14.7%131312Tesla3,0133.6%– 25.1%2028,5042.3%– 14.4%171613MG2,9533.5%– 11.9%1153,2304.3%+ 8.5%111114Nissan 2,9223.5%+ 23.5%565,7775.3%+ 22.3%6815Renault2,8393.4%+ 39.0%1635,0582.8%+ 59.1%161816Volvo2,8343.4%+ 72.0%1039,7933.2%+ 30.3%151517Seat2,2552.7%+ 37.2%1726,7972.2%+ 32.2%181918Land Rover2,0742.5%+ 83.4%1439,9833.2%+ 19.5%141419Honda1,6842.0%+ 95.6%2121,8991.8%+ 27.5%202520Citroen1,5511.8%– 8.7%2319,3151.6%+ 2.1%222021Suzuki1,4961.8%– 16.6%2416,9681.4%+ 4.7%242322Cupra1,4601.7%+ 13.7%1918,1751.5%+ 24.4%232423Dacia1,4031.7%+ 29.8%2219,6651.6%+ 8.9%212224Mazda1,0621.3%– 4.3%2516,9011.4%– 12.7%252125Mini9521.1%– 30.7%1825,2322.0%– 8.3%191726Fiat6630.8%– 30.9%319,4840.8%– 14.7%292727Porsche6180.7%– 41.9%2610,8750.9%– 28.9%272628Jaguar6070.7%+ 74.4%2712,2911.0%+ 50.4%262929Lexus5290.6%– 23.4%289,5100.8%+ 10.3%282830BYD4380.5%+ 1227.3%304,1100.3%+ 1829.6%313831Polestar3740.4%– 54.3%293,9320.3%– 56.2%323032Jeep3550.4%+ 361.0%324,8210.4%+ 156.4%303133Abarth1020.1%+ 240.0%336990.1%+ 75.2%394134KGM/SsangYong880.1%+ 151.4%381,1720.1%+ 18.4%353435Subaru820.1%+ 9.3%351,6280.1%+ 28.3%333236Smart810.1%+ 92.9%361,2630.1%+ 409.3%344337Alfa Romeo790.1%+ 12.9%371,0610.1%+ 12.9%363538DS760.1%+ 18.8%347800.1%– 55.1%383339Genesis460.1%– 33.3%396950.1%– 24.5%403640Omoda460.1%new –460.0%new46 –41Ineos230.0%– 62.9%441870.0%– 67.9%454242Bentley200.0%– 54.5%415430.0%– 40.7%413743Maserati180.0%– 30.8%423260.0%– 48.9%424044Alpine110.0%+ 22.2%432530.0%+ 20.5%444445Ora100.0%– 88.4%409600.1%+ 109.2%373946Fisker00.0%new –2590.0%new434547Maxus00.0%n/a –30.0%– 62.5%474748Chevrolet00.0%n/a –10.0%n/a4846 –Other British1220.1%+ 56.4% –1,9760.2%– 1.3% – – –Other Imports980.1%+ 81.5% –1,6120.1%+ 41.3% – –
UK August 2024 – models:
PosModelAug-24%/23Jul2024%/23PosFY231Ford Puma2,4712.9%+ 5.8%332,2632.6%+ 10.4%112Kia Sportage1,9622.3%+ 51.3%130,1002.4%+ 34.3%243Tesla Model 31,5421.8%– 9.2%n/an/an/an/an/a394VW Polo1,5241.8%+ 40.7%9n/an/an/an/a165Tesla Model Y1,4691.7%– 36.5%n/an/an/an/an/a56VW Golf1,4371.7%+ 16.7%523,4821.9%+ 34.8%4127VW T-Roc1,2971.5%– 17.5%719,5421.6%+ 12.5%9208Volvo XC401,2021.4%+ 38.6%4n/an/an/an/a149Hyundai Tucson1,1981.4%– 25.0%620,2971.6%– 11.3%7610Nissan Qashqai1,1701.4%+ 16.8%227,6842.2%+ 15.3%32n/aAudi A31,1311.3%– 17.0%n/a21,6801.8%+ 17.4%69n/aMG HS9151.1%– 6.9%1020,0901.6%+ 397.0%813n/aNissan Juke7200.9%+ 12.9%822,7021.8%+ 7.4%58n/aBMW 1 Series5010.6%– 40.6%n/a19,5381.6%+ 56.1%1022
Source: SMMT


