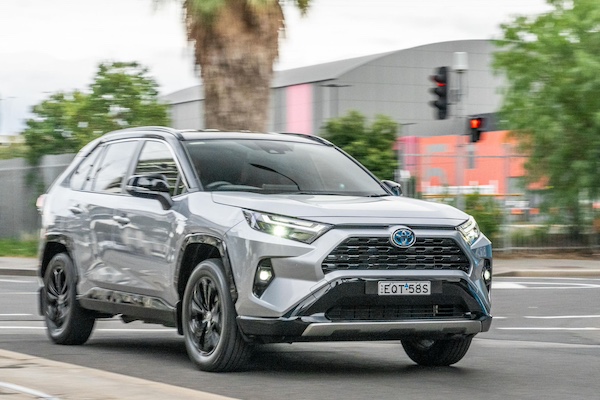
Australia August 2024: Declining sales, Toyota RAV4 breaks records again
The Toyota RAV4 is now #2 year-to-date above the Hilux.
Although the Australian new vehicle market is down for the second time in the past three months in August (at -8.3% to 100,786 units), this still represents the 2nd highest August volume below only last year. Moreover, the year-to-date result remains at record levels at +6% year-on-year to 836,065. All states and territories are in negative this month (this excludes Tesla and Polestar sales), with the Australian Capital Territory the hardest hit at -21.9%. Following are New South Wales at -13.9% to 29,831, Tasmania at -13% to 1,604, Victoria at -10.6% to 26,039, Western Australia at 9.9% to 10,482, Northern Territory at -8.1% to 911, Queensland at -7.5% to 21,310 and South Australia at -2% to 6,813. Including Tesla and Polestar sales, SUV sales drop -7.1% to 57,874 and 57.4% share vs. 56.7% a year ago and 51% in 2022, Light commercials fall -6.4% to 22,496 and 22.3% share vs. 21.9% in August 2023 and 23.6% in 2022 and Passenger cars sink -15.7% to 16,291 and 16.2% share vs. 17.6% last year and 21% in 2022. The rest of the market is held by Heavy commercials at -3.8% to 4,125 and 4.1% share vs. 3.9% a year ago.
Excluding Tesla, Polestar and heavy commercial vehicles, private sales are off -15.9% in August to 48,482 while business fleets resist much better at -3% to 36,875, rental sales drop -15.1% to 5,713 and government sales edge down -4.2% to 3,133. This time including Tesla and Polestar sales, petrol registrations freefall -19.5% to 42,169, diesel is off -12.8% to 29,291, thanks to record Toyota sales hybrids shoot up 44.9% to 16,664, partly due to Tesla imploding EV sales drop -18.5% to 5,892 and PHEVs surge 119.8% to a still low 2,644 units. Looking at country of origin, Japan is off -11.6% to 31,768, Thailand is down -2.7% to 22,474, China falls -19% to 14,433, South Korea skids -5% to 13,070 and Germany is at -10.4% to 4,648. This includes Tesla and Polestar sales.
The Sealion 6 accounts for 52% of BYD sales in August.
Over in the brands ranking, Toyota (-3.7%) falls slower than the market to reach 21.3% share vs. 19.8% so far this year. Ford (+12.6%) shows stunning shape and reclaims the #2 spot it holds year-to-date off Mazda (-2.3%). Kia (+6%) remains above sister brand Hyundai (-4.6%) with Mitsubishi (+11.2%) in tow and strong. GWM (+9.4%) is the only remaining Top 10 manufacturer in positive, with Isuzu Ute (-16.7%), MG (-33.7%) and Nissan (-20.2%) all freefalling on particularly high year-ago volumes. Subaru (-36.2%) and Volkswagen (-25%) are also in great difficulty as is Tesla (-27.7%) at #14. BYD (+151.7%) delivers three firsts: first Top 15 finish, first time at 2% share and first time above the 2,000 monthly sales mark. Chery (+43.2%), Porsche (+40.9%), Suzuki (+38.1%) and Chevrolet (+24.2%) also shine below.
In the models charts, the Toyota RAV4 (+102.4%) continues to catch up on back orders and lodges its fifth ever monthly pole position after July 2020, August 2020, April 2024 and last month. It also breaks its volume record at 6,712 (previous best 5,933 just last month) and its share record at 6.7% (previous best 6% last April). This is the largest share reached by any model this year, and since the Ford Ranger hit 7.9% last December. The Ranger (-5.7%) is relegated to 2nd place and the Toyota Hilux (-22.1%) stays at #3, a ranking it now also holds YTD, being overtaken by the RAV4. The Isuzu D-Max (-22.3%) returns to the 4th place despite a ghastly year-on-year fall. The Ford Everest (+51.3%) reaches its 2nd best ranking at #5, below the #4 it hit last April. It distances the Mitsubishi Outlander (+7.8%) and Kia Sportage (+62.9%) up to a record #7, also hit in June 2022 and October 2022. The Hyundai Kona also equals its ranking record at #11, also reached in December 2020 and May 2024. Notice also the new BYD Sealion 6 up 24 spots on July to #27.
Previous month: Australia July 2024: Toyota RAV4 #1, hits all-time high volume in record market
One year ago: Australia August 2023: Nissan, MG, Isuzu Ute shine in record market
Full August 2024 Top 49 All brands and Top 40 models below.
Australia August 2024 – brands:
PosBrandAug-24%/23Jul2024%/23PosFY231Toyota 21,49021.3%– 3.7%1165,49619.8%+ 23.7%112Ford 8,8908.8%+ 12.6%366,2617.9%+ 24.6%233Mazda 8,2638.2%– 2.3%265,2867.8%– 2.8%324Kia 6,9036.8%+ 6.0%454,8236.6%+ 5.8%445Hyundai 6,2116.2%– 4.6%548,3145.8%– 4.8%656Mitsubishi5,5165.5%+ 11.2%650,8686.1%+ 27.3%567Isuzu Ute3,9243.9%– 16.7%833,6484.0%+ 18.4%7108MG3,5613.5%– 33.7%732,2553.9%– 13.8%879Nissan 3,3763.3%– 20.2%1131,5933.8%+ 32.1%91210GWM3,1483.1%+ 9.4%1027,9913.3%+ 21.8%121311Subaru 3,0043.0%– 36.2%928,3483.4%– 7.8%10912Volkswagen2,7902.8%– 25.0%1324,1972.9%– 12.5%131113Mercedes2,5182.5%+ 0.4%1516,4242.0%– 17.5%151414Tesla2,3932.4%– 27.7%1228,1013.4%– 14.4%11815BYD2,0212.0%+ 151.7%1613,3551.6%+ 66.9%172116Suzuki 1,9752.0%+ 38.1%1714,1951.7%+ 20.7%161817BMW1,5331.5%– 32.5%1417,3042.1%+ 3.7%141518LDV1,2091.2%– 33.8%1811,3951.4%– 21.1%181619Lexus1,1101.1%– 34.1%198,6621.0%– 13.2%211920Chery1,0881.1%+ 43.2%226,2400.7%+ 106.4%232921Audi9751.0%– 27.5%2110,2281.2%– 14.7%201722Honda 8460.8%– 28.5%2010,7031.3%+ 20.6%192023Volvo8200.8%– 20.9%246,3460.8%– 20.7%222224Land Rover6830.7%– 34.3%235,4900.7%+ 3.3%242325Porsche5890.6%+ 40.9%254,4550.5%+ 6.0%252726Renault4110.4%– 38.5%283,7830.5%– 34.4%272427Chevrolet3590.4%+ 24.2%302,7200.3%+ 21.3%293328Skoda3280.3%– 53.0%263,7360.4%– 29.0%282529Ssangyong3120.3%– 35.9%293,8750.5%– 9.5%262830Ram2860.3%– 47.1%312,6330.3%– 48.1%302631Jeep 2230.2%– 40.4%331,6620.2%– 49.8%323032Fiat2170.2%+ 17.9%321,2100.1%– 12.3%353633Peugeot1560.2%– 43.3%341,4970.2%– 9.2%333434Mini1510.1%– 37.6%272,1610.3%– 23.3%313135Cupra1320.1%– 56.3%351,4050.2%– 33.4%343236Genesis1210.1%– 36.3%369510.1%– 24.0%373737Jaguar830.1%+ 76.6%385390.1%+ 65.3%384038Polestar650.1%– 71.1%371,1180.1%– 33.4%363539Alfa Romeo420.0%– 47.5%404480.1%+ 5.9%393840Maserati350.0%– 45.3%392770.0%– 37.0%403941Lamborghini230.0%– 17.9%411840.0%+ 35.3%414142Ferrari200.0%+ 0.0%421580.0%+ 6.0%424443Citroen160.0%– 44.8%451030.0%– 37.2%454344McLaren110.0%+ 22.2%48550.0%– 16.7%474745Lotus100.0%– 52.4%441290.0%+ 33.0%444546Bentley80.0%– 38.5%431310.0%– 8.4%434247Aston Martin10.0%– 83.3%47970.0%– 1.0%464648Rolls-Royce10.0%– 83.3%46380.0%+ 18.8%484849Dodge00.0%n/a –60.0%n/a49 –
Australia August 2024 – models:
PosModelAug-24%/23Jul2024%/23Pos1Toyota RAV46,7126.7%+ 102.4%138,0504.6%+ 94.2%22Ford Ranger5,4315.4%– 5.7%243,8775.2%+ 16.6%13Toyota Hilux4,4864.5%– 22.1%337,7484.5%– 2.0%34Isuzu D-Max2,5482.5%– 22.3%520,7372.5%+ 11.5%45Ford Everest2,2732.3%+ 51.3%615,7111.9%+ 87.1%86Mitsubishi Outlander2,1882.2%+ 7.8%718,7412.2%+ 23.7%57Kia Sportage2,0512.0%+ 62.9%1514,0401.7%+ 54.6%118Mazda CX-51,9271.9%+ 8.0%815,8781.9%+ 5.8%79Toyota Corolla1,8551.8%– 33.9%417,7222.1%+ 45.8%610Mazda CX-31,6751.7%+ 50.2%1211,8201.4%+ 10.4%2011Hyundai Kona1,6741.7%+ 68.6%1912,0921.4%+ 93.2%1712MG ZS1,5761.6%– 50.6%915,2001.8%– 26.3%913Hyundai Tucson1,5481.5%– 25.7%1112,6321.5%– 12.9%1514Toyota Land Cruiser Wagon1,4421.4%– 12.1%1412,1211.4%+ 28.8%1615Kia Cerato1,4061.4%+ 162.8%1311,2171.3%+ 208.2%2116Isuzu MU-X1,3761.4%– 3.8%2012,9111.5%+ 31.5%1317Tesla Model Y1,3301.3%– 42.5%2115,1991.8%– 22.6%1018Mazda BT-501,2601.3%– 10.4%2810,3491.2%– 15.2%2219Mitsubishi Triton1,2371.2%+ 13.7%2211,8931.4%+ 8.4%1820Nissan X-Trail1,2011.2%– 21.7%2611,8781.4%+ 57.0%1921Subaru Forester1,1661.2%– 18.3%249,2731.1%– 13.3%2422Mazda CX-301,1481.1%+ 1.4%238,5851.0%+ 2.5%2623Toyota Kluger1,1031.1%+ 31.0%106,9640.8%+ 2.2%3524Hyundai i301,0981.1%– 37.8%408,2761.0%– 44.2%2825Tesla Model 31,0631.1%+ 6.8%2512,9021.5%– 2.1%1426Toyota Land Cruiser PU/CC1,0621.1%– 3.6%338,1851.0%+ 16.2%3027BYD Sealion 61,0581.0%new512,0960.3%new7728Toyota Hiace1,0421.0%+ 67.8%179,2751.1%+ 53.2%2329Mitsubishi ASX1,0251.0%– 2.7%278,2761.0%+ 45.3%2930Toyota Yaris Cross1,0061.0%+ 83.9%705,0360.6%+ 40.7%4631Kia Carnival9901.0%+ 8.4%316,5950.8%– 13.5%3732Mazda39731.0%– 6.5%327,4720.9%+ 11.3%3233Toyota Camry9330.9%– 30.2%1613,2191.6%+ 118.8%1234GWM Haval Jolion9310.9%– 6.5%299,1811.1%+ 24.9%2535MG 39230.9%– 19.9%188,5431.0%– 19.7%2736Suzuki Jimny9230.9%+ 141.6%386,3240.8%+ 62.4%3837Nissan Navara7730.8%– 7.9%377,1520.9%+ 43.3%3338Subaru Crosstrek7660.8%– 31.4%307,8420.9%+ 58.3%3139Kia Sorento7140.7%+ 24.2%367,0530.8%+ 12.2%3440Nissan Patrol7050.7%– 31.7%395,3120.6%+ 21.4%44
Source: VFACTS


