Italy August 2024: Toyota, Volkswagen and Dacia all outsell Fiat
Toyota is the best-selling carmaker in Italy in August.
The Italian new car market is off -13.4% year-on-year in August to 69,121 units, the lowest August result since 2021 (65,185). Year-to-date volumes are now up 3.8% to 1,080,447, still down -18.8% on the same period in pre-pandemic 2019 (1,330,749). Looking at sales by channel, private sales drop -9.1% to 43,620 and 62.7% share vs. 59.2% in August 2023 and are up 7.2% year-to-date to 614,612 and 56.2% share vs. 54.3% over the first 8 months of 2023. Self registrations are down -23.2% for the month to 8,220 and up 25.9% YTD to 125,114. Long term leases sink -25.1% to 12,714 and 18.3% share vs. 20.9% last year and are off -16.9% YTD to 221,277 and 20.2% share vs. 25.2% in 2023. Short term rentals surge 169.8% to a still minimal 1,106 units and 1.6% share for the month and soar 29.5% YTD to 72,037 and 6.6% share vs. 5.3% last year. Finally company sales fall -20.9% to 3,943 in August and edge down -0.6% YTD to 60,110.
As for sales by propulsion, petrol is off -18.8% to 19,561 in August but up 10.4% to 326,440 year-to-date, diesel freefalls -32.1% to 9,357 for the month and -22.4% to 156,222 YTD, LPG drops -6.8% to 7,382 but is up 8.1% YTD to 103,214. HEVs edge up 2% in August to 28,270 and up 15% YTD to 427,503. This includes 8,631 full hybrids (+17.9%) and 19,639 mild hybrids (-3.7%) for August and 119,922 full hybrids (+22.4%) and 307,581 mild hybrids (+12.4%) year-to-date. PHEVs sink -28.2% to 2,425 for the month and -24.7% to 36,550 YTD. Finally BEVs skid -36.1% in August to 2,605 and 3.7% share vs. 5% a year ago but gain 2.4% YTD to 41,992 and 3.8% share vs. 3.9%.
Being by far the slowest month of the year, August is always very volatile with brands and models rankings reshuffled. But this year it’s going one step too far with history-making results. After falling to its worst ever market share at home in May (9.3%) and then July (8.2%), Fiat implodes further this month, hitting a dismal 6.9% overall. This means not only does it lose the brands top spot but it actually falls to #4, a never-seen before event in Italy. Note Fiat was already toppled from the brands pole position by Volkswagen last December. In August Toyota (+21.6%) takes the lead of the Italian brands charts for the first time with 8.6% share, a new record eclipsing its previous best of 8% hit last March and May. Volkswagen (-7.5%) and Dacia (+16.1%) complete the podium above Fiat. BMW (+28.6%) and Renault (+22.5%) post the biggest gains in the Top 10 while further down Lexus (+104.3%), MG (+35.2%), Skoda (+15.6%) and Volvo (+10.2%) stand out. Tesla is down -79.6%.
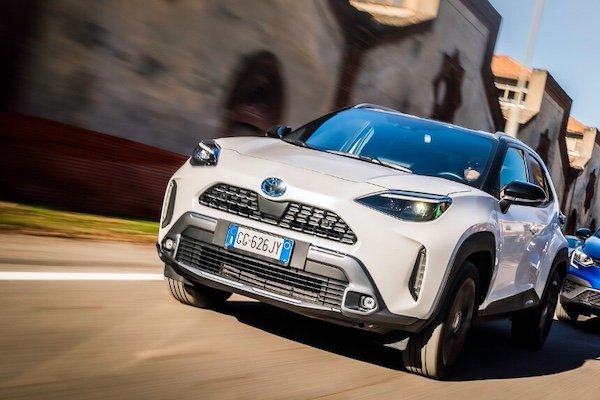
The models charts isn’t as wild, with the Fiat Panda (-22.9%) holding onto the top spot albeit with an extra low 4.8% share, the nameplate’s weakest in three years: since the 4.7% of August 2021. The next six models all defy the negative market with year-on-year gains. The Dacia Sandero (+25%) holds onto the 2nd spot above the Jeep Avenger (+92.9%) scoring its first ever podium finish at #3. The Toyota Yaris Cross (+42.4%) repeats at #4 ahead of the Dacia Duster (+3.7%) up two spots on July to #5, the Renault Captur (+22%) up three to #6 and the Renault Clio (+51.2%) down four to #7. Below a receding Peugeot 208 (-3.2%), the Ford Puma (+8%) and Toyota Yaris (+6.4%) round out the Top 10 in strong fashion.
Previous month: Italy July 2024: Fiat (-28.7%) sees its lowest ever share cut from 9.3% to 8.2%
One year ago: Italy August 2023: Dacia (+42.1%), Jeep (+106.4%) impress in market up 12%
Full August 2024 Top 50 brands and Top 50 models below.
Italy August 2024 – brands:
PosBrandAug-24%/23Jul2024%/23PosFY231Toyota5,9418.6%+ 21.6%282,1487.6%+ 34.2%232Volkswagen5,1487.4%– 7.5%479,6257.4%– 4.1%323Dacia4,9417.1%+ 16.1%366,6676.2%+ 14.9%444Fiat4,7566.9%– 44.3%1110,59510.2%– 5.1%115Renault4,1266.0%+ 22.5%558,6245.4%+ 15.4%566BMW3,8095.5%+ 28.6%847,0084.4%+ 21.3%10107Peugeot3,6485.3%– 5.5%653,7955.0%– 6.5%678Audi3,6395.3%+ 3.1%748,4614.5%+ 5.6%799Ford3,6095.2%– 8.6%1047,4544.4%– 16.1%9510Jeep3,1394.5%– 7.2%947,7614.4%– 2.1%8811Kia2,6383.8%– 3.6%1132,7583.0%+ 2.8%131412Skoda2,2483.3%+ 15.6%1824,5632.3%+ 10.2%201913Hyundai2,2413.2%– 12.8%1433,7303.1%+ 6.0%121314Mercedes2,1333.1%– 15.4%1332,5123.0%+ 0.5%141215Opel2,0122.9%– 18.5%1231,8112.9%– 0.6%151616MG2,0022.9%+ 35.2%1626,6072.5%+ 46.4%172017Suzuki1,4682.1%– 1.9%1725,1702.3%+ 11.3%191818Lancia1,3622.0%– 45.3%1928,8672.7%– 3.4%161519Citroen1,2811.9%– 60.0%1544,1024.1%+ 27.0%111120Nissan1,1541.7%– 51.4%2025,4572.4%+ 10.6%181721DR Motor1,0461.5%– 49.1%2212,0431.1%– 34.7%232222Volvo7921.1%+ 10.2%2313,0491.2%+ 11.6%222523Alfa Romeo7851.1%– 25.0%2114,6821.4%– 18.1%212124Cupra6741.0%– 36.7%2511,2931.0%+ 5.5%242425Land Rover4400.6%– 12.5%266,8750.6%+ 6.6%292926Tesla4350.6%– 79.6%3311,0471.0%– 0.7%252627Mazda4100.6%– 25.5%249,3490.9%– 6.3%262728Seat4010.6%– 29.2%288,8520.8%+ 4.1%272829Mini3540.5%– 63.4%278,2520.8%– 38.0%282330EVO3440.5%– 32.8%294,2540.4%+ 4.8%323131Honda3010.4%– 21.8%305,0380.5%+ 35.4%313332Lexus2860.4%+ 104.3%313,7250.3%+ 61.0%343633Porsche2380.3%– 39.3%325,5370.5%+ 13.8%303034BYD2230.3%+ 1492.9%368300.1%+ 1382.1%40n/a35DS1760.3%– 45.7%343,7310.3%– 29.2%333236Mitsubishi750.1%+ 23.0%372,5590.2%+ 192.8%354037EMC710.1%+ 36.5%408350.1%+ 64.7%39n/a38Maserati690.1%– 51.4%381,6740.2%– 38.0%373539Smart530.1%– 67.1%392,3600.2%– 21.4%363440Subaru470.1%– 61.8%429240.1%– 49.4%383841Ferrari420.1%+ 110.0%415670.1%+ 19.4%444342Polestar350.1%+ 337.5%491520.0%– 76.0%494143Jaguar280.0%– 71.7%437270.1%– 41.1%433944Lotus170.0%+ 142.9%452470.0%+ 190.6%474645Lamborghini150.0%– 21.1%443410.0%+ 18.8%464446Mahindra120.0%– 45.5%481670.0%– 69.1%484247Sportequipe110.0%– 71.1%477350.1%+ 350.9%42n/a48SsangYong110.0%– 15.4%463830.0%+ 93.4%454549Lynk & Co80.0%– 27.3%358190.1%– 74.2%413750Aston Martin30.0%– 25.0%50650.0%– 1.5%5047 –Others4240.6%+ 457.9% –1,6200.1%+ 186.7% – –
Italy August 2024 – models:
PosModelAug-24%/23Jul2024%/23PosFY231Fiat Panda3,3264.8%– 22.9%174,7086.9%+ 16.9%112Dacia Sandero2,8794.2%+ 25.0%242,6243.9%+ 33.5%223Jeep Avenger2,1393.1%+ 92.9%626,1712.4%+ 143.6%5184Toyota Yaris Cross1,9052.8%+ 42.4%424,8722.3%+ 12.5%645Dacia Duster1,8062.6%+ 3.7%719,6301.8%– 8.0%12106Renault Captur1,7942.6%+ 22.0%921,3452.0%+ 6.6%877Renault Clio1,7212.5%+ 51.2%324,2292.2%+ 63.3%7138Peugeot 2081,6902.4%– 3.2%1220,3081.9%+ 30.3%11149Ford Puma1,6482.4%+ 8.0%1519,1701.8%– 4.4%13910Toyota Yaris1,5542.2%+ 6.4%1421,3022.0%+ 31.1%91611Opel Corsa1,4632.1%+ 25.1%517,9251.7%+ 10.3%151712VW Tiguan1,3822.0%+ 100.0%2211,7841.1%+ 2.7%242813Lancia Ypsilon1,3622.0%– 45.3%828,8622.7%– 3.4%4314BMW X11,3221.9%+ 82.1%2113,0851.2%+ 50.3%223215VW T-Roc1,2461.8%+ 0.3%1020,6951.9%– 5.4%10616MG ZS1,2351.8%– 5.3%1718,9581.8%+ 72.8%142217Peugeot 20081,0911.6%– 11.6%1317,1901.6%+ 15.0%161518Kia Sportage1,0231.5%– 18.6%2015,1541.4%+ 15.0%192319Audi Q39311.3%– 3.1%1612,9061.2%+ 15.2%233120Toyota Aygo X9291.3%– 23.3%1914,8791.4%+ 88.3%203021Kia Picanto9241.3%+ 34.7%248,3180.8%+ 5.4%363922Hyundai i109131.3%+ 2.2%2510,8651.0%+ 19.0%283323Toyota C-HR8541.2%n/a309,9380.9%n/a30n/a24Audi A37721.1%+ 61.2%368,8280.8%+ 19.9%344125VW T-Cross6691.0%– 44.1%1815,6411.4%+ 10.2%182026BMW X26290.9%+ 163.2%n/an/an/an/an/an/a27DR 5.05820.8%+ 103.5%39n/an/an/an/an/a28VW Polo5790.8%– 42.6%419,6450.9%– 18.7%312629Citroen C35730.8%– 71.2%1129,3332.7%+ 57.8%3830Skoda Kamiq5690.8%+ 15.7%436,4400.6%n/a47n/a31Ford Focus5650.8%– 1.7%508,1550.8%– 29.2%392932Nissan Juke5620.8%– 1.7%n/a8,1800.8%n/a384033Jeep Compass5540.8%– 50.8%2311,0471.0%– 33.1%271934Ford Tourneo Courier5480.8%new455,2650.5%newn/an/a35Skoda Fabia5460.8%+ 43.7%n/a6,2920.6%+ 40.2%49n/a36Hyundai i205340.8%– 20.8%n/a7,3570.7%+ 14.6%44n/a37Mercedes GLA5320.8%– 9.8%318,5960.8%+ 22.8%353738Fiat 6005150.7%new35n/an/anewn/an/a39Alfa Romeo Tonale4920.7%– 27.1%2710,2560.9%– 19.9%292540Jeep Renegade4850.7%– 60.7%2911,2681.0%– 50.7%251141Cupra Formentor4820.7%– 37.6%327,4300.7%– 12.3%413642Audi A14780.7%– 19.4%47n/an/an/an/a4743Suzuki Vitara4730.7%+ 15.6%377,3860.7%+ 11.9%435044Ford Kuga4560.7%– 55.7%339,1890.9%– 26.9%322745MG 34410.6%newn/an/an/anewn/a –46Suzuki Swift4390.6%n/a49n/an/an/an/an/a47Hyundai Tucson4290.6%– 20.8%287,6380.7%– 23.3%403448Nissan Qashqai4170.6%– 65.9%4814,0861.3%+ 6.6%212149Skoda Octavia4110.6%n/an/an/an/an/an/an/a50Kia Stonic3970.6%n/a38n/an/an/an/an/an/aVW Taigo3900.6%+ 8.6%467,3900.7%+ 7.0%4249n/aVW Golf3900.6%– 22.0%n/a7,2670.7%– 9.4%4545n/aTesla Model Y3760.5%– 59.6%n/a5,3200.5%– 13.7%n/an/an/aFiat 5003600.5%– 84.2%2616,3041.5%– 33.0%175n/aPeugeot 30083520.5%– 23.1%408,2130.8%– 49.6%3724n/aSuzuki Ignis3310.5%– 14.0%347,2420.7%+ 15.4%4643n/aOpel Mokka3100.4%– 44.8%n/a6,3890.6%– 19.8%4842n/aVolvo XC403090.4%– 2.2%426,0410.6%– 8.1%50n/an/aCitroen C3 Aircross2960.4%– 63.2%n/a8,9200.8%– 3.4%3335n/aFiat 500X2000.3%– 83.4%n/a11,1331.0%– 45.3%2612n/aTesla Model 3500.1%– 95.8%n/a5,5700.5%+ 23.8%n/an/a
Source: UNRAE


