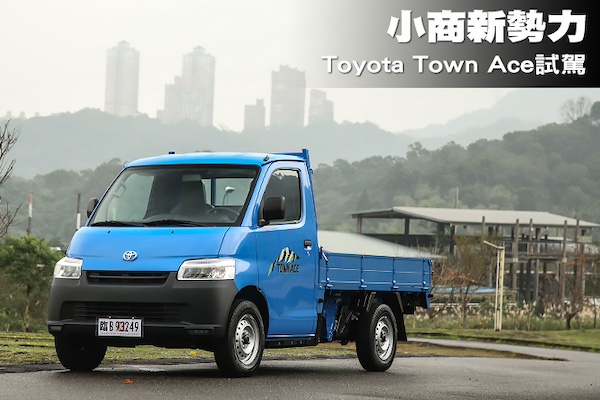
Taiwan August 2024: Toyota Town Ace signs first pole position in devastated market
The Toyota Town Ace is the most popular vehicle in Taiwan in August.
The Taiwanese new car market sinks -17% year-on-year in August to 29,403 units, sending the year-to-date tally into negative at -1.6% to 307,584. There are a few explanations for this brutal fall. August 4 marked the start of the traditional folk month, a weak period for new car registrations. Also, on July 30 the Industrial Development Administration of the Ministry of Economic Affairs announced the implementation of a new control system for Chinese components assembled in Taiwan from August 1. This means a letter of commitment on the “localised supply chain cooperation value ratio” must be submitted. This has sent shockwaves to Taiwan’s automobile industry and impacted sales negatively.
Toyota (-16.1%) follows the market and remains ultra dominant at 28.2% share. Not impacted by localised components as it is a pure importer, Mercedes soars 63.9% year-on-year but only achieves 6.1% share vs. 6% so far this year. Lexus (-13.5%) is pushed down to #3 but resists relatively well. Honda (-31.2%) is hit hard at #4 ahead of Hyundai (-17.6%) and a solid – in context – BMW (-7%). Volkswagen (-21.1%) struggles year-on-year but jumps up to #7 and 4.1% share vs. #13 and 2.7% year-to-date. CMC (+19%) and Mazda (+0.2%) are the only additional Top 10 members in positive with Mitsubishi (-27.2%), in dire straits, closing out the Top 10. Notice also MG off -54.6%.
Model-wise, the Toyota Town Ace (+41.4%) delivers a first ever pole position thanks to soaring sales. The traditional leader, the Toyota Corolla Cross (-38.2%), ends the month just 11 units below. The Toyota RAV4 (-30.4%) is also in a difficult situation but manages to hold onto the third place, a ranking is also has year-to-date. The new Yaris Cross is up two spots on July to #4, making it four Toyotas in the Top 4 like one year ago in August 2023. The CMC Veryca (-22.4%) is up three ranks on last month to conclude the Top 5 ahead of the Tesla Model Y (+36.3%) up 22 spots to #6.
Previous month: Taiwan July 2024: Toyota Corolla Cross ultra dominant, YTD figures tilt into positive
One year ago: Taiwan August 2023: 4 Toyotas in Top 4, MG HS breaks ranking record again
Full August 2024 Top 10 brands and Top 60 models below.
Taiwan August 2024 – brands:
PosBrandAug-24%/23Jul2024%/23PosFY231Toyota8,28428.2%– 16.1%181,41226.5%– 1.6%112Mercedes1,7806.1%+ 63.9%318,5906.0%+ 13.6%343Lexus1,5865.4%– 13.5%220,0646.5%– 10.0%234Honda1,4925.1%– 31.2%417,7185.8%– 1.9%425Hyundai1,3314.5%– 17.6%615,7055.1%+ 4.5%566BMW1,2034.1%– 7.0%513,2944.3%+ 5.3%897Volkswagen1,1914.1%– 21.1%n/a8,2872.7%– 25.9%13108CMC1,1704.0%+ 19.0%813,3754.3%+ 9.0%789Mazda1,1233.8%+ 0.2%109,5083.1%n/a11n/a10Mitsubishi1,0773.7%– 27.2%910,7453.5%– 9.0%10n/a11Nissan1,0393.5%– 20.1%713,0094.2%– 6.6%95n/aTesla9063.1%– 3.5%n/a9,4393.1%+ 9.6%12n/an/aMG5341.8%– 54.6%n/a13,6684.4%+ 88.5%6n/a
Taiwan August 2024 – models:
PosModelAug-24%/23Jul2024%/23PosFY231Toyota Town Ace1,9146.5%+ 41.4%214,8184.8%+ 29.3%242Toyota Corolla Cross1,9036.5%– 38.2%120,3596.6%– 16.1%113Toyota RAV41,2714.3%– 30.4%313,2984.3%+ 17.5%334Toyota Yaris Cross1,1153.8%new610,9763.6%new4285CMC Veryca7632.6%– 22.4%88,0492.6%– 11.5%866Tesla Model Y7552.6%+ 36.3%285,7101.9%– 12.6%12107Honda CR-V7332.5%– 30.3%410,0023.3%– 12.1%528Toyota Corolla Altis6562.2%– 45.2%77,6892.5%– 26.2%959Lexus NX6462.2%– 13.9%58,8332.9%– 11.7%7710Mitsubishi Delica5151.8%– 22.3%115,3411.7%– 4.9%131311Mercedes GLC Class5081.7%+ 200.6%105,7221.9%+ 58.2%111612Ford Focus4441.5%– 55.5%124,9071.6%– 45.5%16813Hyundai Tucson4201.4%+ 16.7%175,8251.9%+ 66.0%102014Luxgen n74131.4%new95,1151.7%new15n/a15CMC Zinger4071.4%n/a145,3261.7%+ 67.8%142116Volvo XC404061.4%– 29.8%323,0251.0%+ 128.8%273617Honda HR-V3671.2%– 39.3%n/a3,6571.2%– 18.3%221418Suzuki Swift3611.2%+ 2.3%n/a1,5770.5%– 32.2%403319Toyota Vios3471.2%– 58.4%213,5001.1%– 8.9%231720Honda Fit3441.2%– 27.9%203,3701.1%– 2.5%242321MG HS3091.1%– 71.3%139,3013.0%+ 28.3%6922VW Tiguan3081.0%– 29.7%332,0040.7%– 44.9%332423Mazda CX-53041.0%– 25.1%193,0691.0%– 4.9%262624Ford Kuga3011.0%– 53.3%23n/an/an/an/a1525VW Golf2961.0%– 17.1%311,9730.6%+ 12.0%344126Mazda32851.0%– 17.9%362,0560.7%– 26.3%323027Toyota Camry2841.0%n/a241,8520.6%n/a353728Lexus UX2821.0%– 24.0%302,8030.9%– 27.3%292529Mercedes E Class2770.9%+ 211.2%341,6910.5%+ 43.9%375730Nissan Kicks2750.9%– 57.0%183,9771.3%– 38.8%181131Nissan X-Trail2730.9%n/a164,3741.4%n/a172732Hyundai Custin2480.8%– 55.0%223,7331.2%– 15.8%211933Volvo XC602350.8%– 35.6%42n/an/an/an/a4434Lexus RX2290.8%– 48.2%153,8821.3%– 15.9%201835Mazda CX-302230.8%+ 10.4%411,5770.5%– 28.1%413936Toyota Sienta2110.7%– 61.6%35n/an/an/an/a2237Suzuki Jimny2080.7%n/a56n/an/an/an/an/a38Mercedes GLE Class1950.7%+ 1.0%541,3930.5%+ 5.2%454839Nissan Sentra1920.7%– 20.0%262,8870.9%– 12.5%282940Mitsubishi Colt Plus1900.6%– 42.8%371,5400.5%– 39.8%433241Hyundai Venue1850.6%– 26.3%292,2130.7%– 23.3%313442Lexus LBX1780.6%new44n/an/anewn/a –43Kia Sportage1780.6%– 51.8%253,1311.0%+ 66.9%253844MG ZS1690.6%n/a273,9321.3%n/a194745Skoda Octavia1630.6%+ 5.2%471,7050.6%+ 64.6%364546Mercedes EQE SUV1620.6%n/a556130.2%n/a56n/a47Lexus LM1410.5%n/an/a8750.3%n/a49n/a48Skoda Kamiq1380.5%+ 34.0%60n/an/an/an/a5449Mercedes GLA Class1360.5%n/a381,6880.5%+ 31.8%385250VW T-Roc1320.4%– 55.1%n/an/an/an/an/a4051Toyota Granvia1310.4%+ 3.1%587320.2%– 14.6%53n/a52VW T-Cross1260.4%n/an/an/an/an/an/an/a53Mazda CX-601240.4%n/a591,5890.5%n/a39n/a54BMW iX1220.4%n/an/an/an/an/a59n/a55BMW iX11120.4%n/a40n/an/an/an/an/a56Skoda Kodiaq1060.4%– 38.0%n/an/an/an/a534957VW Caravelle1050.4%n/an/an/an/an/an/an/a58BMW X31050.4%n/an/an/an/an/an/an/a59BMW 3 Series1040.4%+ 10.6%571,1000.4%– 3.8%475560Volvo XC901020.3%n/an/an/an/an/an/an/a
Source: u-car.com.tw

