
Pakistan July 2024: Market up 68.7%, Sazgar Haval H6 up to #2
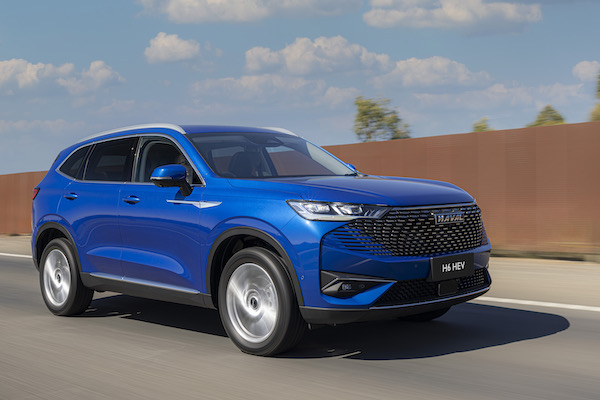
The Sazgar Haval H6 is the 2nd best-selling vehicle in Pakistan in July.
Local manufacturers association PAMA has the Pakistani market up 68.7% year-on-year to 8,589 on poor year-ago volumes. The year-to-date tally is up 52.5% to 72,961. Note Changan and Kia do not report sales figures to PAMA but are reported to be quite successful here. Suzuki (+82.9%) beats the overall growth rate and lifts to 52% share vs. 50.6% so far this year. Toyota (+21.6%) is a lot more muted but easily keeps the 2nd spot with 19.4% share. Honda (+88.5%) is back to the third spot it holds year-to-date with Sazgar Haval (+575.4%) and Hyundai (+3.2%) in tow. The Suzuki Alto (+99.2%) leads the way in the models ranking, distancing the Sazgar Haval H6 (+575.4%) up to a record 2nd place also hit last May. The Suzuki Ravi (+208%) is up 11 spots on June to #3, with the Toyota Corolla (-12.7%) and Suzuki Swift (+101.6%) rounding out the Top 5.
Previous month: Pakistan June 2024: Sales back up 120.2% on week year-ago result
One year ago: Pakistan July 2023: Hyundai defies devastated market (-57%)
Full July 2024 Top 8 brands and Top 23 models below.
Pakistan July 2024 – brands:
PosBrandJul-24%/23Jun2024%/23PosFY231Suzuki4,47052.0%+ 82.9%136,90150.6%+ 89.8%112Toyota1,66419.4%+ 21.6%215,23620.9%+ 7.6%223Honda93110.8%+ 88.5%49,26012.7%+ 47.7%334Sazgar Haval8249.6%+ 575.4%54,8836.7%+ 265.2%555Hyundai5876.8%+ 3.2%36,0178.2%+ 7.4%446JAC1021.2%+ 52.2%65460.7%+ 96.4%677Isuzu100.1%– 33.3%7880.1%+ 14.3%798BAIC10.0%– 92.3%8300.0%– 76.6%88
Pakistan July 2024 – models:
PosModelJul-24%/23Jun2024%/23PosFY231Suzuki Alto2,86933.4%+ 99.2%125,34734.7%+ 175.4%112Sazgar Haval H68249.6%+ 575.4%44,8836.7%+ 265.2%3153Suzuki Ravi5766.7%+ 208.0%141,8612.6%+ 8.0%13134Toyota Corolla (est)5095.9%– 12.7%25,6427.7%+ 31.8%225Suzuki Swift5025.8%+ 101.6%33,8395.3%+ 56.6%656Honda Civic (est)4505.2%+ 278.2%64,7626.5%+ 102.6%447Toyota Yaris (est)4094.8%– 15.5%54,5446.2%+ 27.7%538Hyundai Porter3494.1%+ 391.5%171,5372.1%+ 87.2%15169Honda City (est)3404.0%+ 282.0%93,5914.9%+ 102.4%71110Toyota Hilux (est)3083.6%+ 85.5%121,7112.3%– 50.9%14611Suzuki Bolan2883.4%+ 97.3%131,8832.6%– 12.7%121212Toyota Fortuner (est)2502.9%+ 85.2%161,3931.9%– 51.0%16913Toyota Corolla Cross (est)1882.2%new101,9462.7%new9 –14Honda BR-V & HR-V1411.6%– 50.7%199071.2%– 57.7%181415Suzuki WagonR1391.6%– 43.3%111,9052.6%– 0.3%111016Hyundai Tucson1131.3%– 65.5%81,9292.6%– 32.5%10717JAC X2001021.2%+ 52.2%215460.7%+ 96.4%202018Suzuki Cultus961.1%– 45.8%72,0662.8%+ 3.8%8819Hyundai Santa Fe580.7%new151,3041.8%new172120Hyundai Sonata340.4%– 62.2%204860.7%– 49.5%211821Hyundai Elantra330.4%– 58.8%187611.0%– 20.7%191722Isuzu D-Max100.1%– 33.3%22880.1%+ 14.3%222323BAIC BJ40L10.0%– 92.3%23300.0%– 76.6%2322
Source: PAMA
More Stories
Bulgaria Full Year 2025: Toyota and Corolla back on top in record market
This content is for members only. Visit the site and log in/register to read.
*** Full Year 2025 reports *** 33 markets available
The Maruti Suzuki DZire is #1 in India in 2025. This article is the portal to all Full Year 2025...
Russia Full Year 2025: Market down -15.6%, Belgee (+96.5%), Solaris (+132%), newcomer Tenet impress
This content is for members only. Visit the site and log in/register to read.
Belgium Full Year 2025: BMW X1 and Dacia Sandero top struggling market (-7.5%)
This content is for members only. Visit the site and log in/register to read.
How The New Lamborghini Temerario Makes Hybrid Power Feel Exciting, Stylish And Future-Ready
Lamborghini is stepping into 2026 with confidence, flair and a clear plan for the future. For the first time, every...
Thailand November 2025: Toyota Hilux Revo fades out, Jaecoo up to #4
The Jaecoo 5 EV is up to #6 in Thailand in November. 43,503 new light vehicles hit Thai roads in...