
Portugal July 2024: EX30 pushes Volvo to all time high
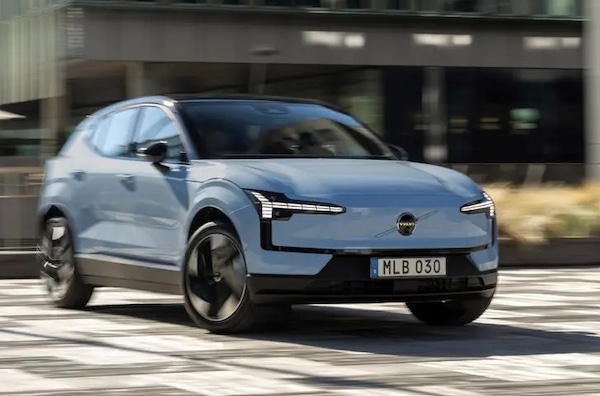
The Volvo EX30 accounts for 44% of Volvo sales this month.
The Portuguese new car market slows down -9.5% year-on-year in July to 14,055 units, yet the year-to-date tally remains in positive at +3.7% to 130,967. The Top 3 manufacturers all beat the market with positive results: Peugeot (+4.4%) leads the way at 11.2% share vs. 10.1% so far this year, followed by Mercedes (+33.8%) up to #2 also YTD and BMW (+2%) up five spots on June to #3. Dacia (-2.2%) ranks #4 and ascends to #3 year-to-date, symbolically overtaking Renault (+2.7%). Volvo (+16.5%) jumps to #7, the OEM’s first time inside the Top 10 with a record 4.5% share. Previous bests were #12 first reached in pandemic-disturbed May 2020 and 3.7% hit in May 2020 also. Tesla (+11.1%) falls to #11 but is still strong.
Over in the models ranking, the Peugeot 2008 (+159.5%) surges ahead to clearly lead the pack with 5.7% share vs. 3.8% for the Dacia Sandero. This is the second time the 2008 ranks #1 monthly this year alongside January, whereas it was #1 over the Full Year 2023. The Sandero remains #1 year-to-date in 2024. The Renault Clio (+43.8%) leaps up to #3, a ranking it also holds year-to-date. Outstanding month for the Mercedes A-Class (+88.8%) and Tesla Model 3 (+106.3%), the latter at #4 year-to-date. The new Volvo EX30 is up 13 ranks on last month to a record 6th place, accounting for 44% of Volvo sales this month and the nameplate’s first Portuguese Top 10 finish.
Previous month: Portugal June 2024: Citroen C3 and Tesla Model Y top negative market
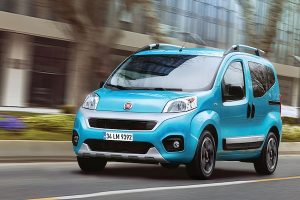
One year ago: Portugal July 2023: Fiat 500 climbs to pole position, market slowing down its growth
Full July 2024 Top 42 All brands and Top 289 All models below.
Portugal July 2024 – brands:
PosBrandJul-24%/23Jun2024%/23PosFY231Peugeot1,62511.2%+ 4.4%113,18810.1%– 8.9%112Mercedes1,4059.7%+ 33.8%310,0437.7%+ 24.2%233BMW1,0957.5%+ 2.0%88,0896.2%– 0.3%554Dacia9986.9%– 2.2%59,6267.3%+ 11.0%345Renault9616.6%+ 2.7%79,6097.3%– 7.6%426Toyota8395.8%+ 5.7%106,9385.3%+ 3.1%877Volvo6494.5%+ 16.5%114,4303.4%+ 44.6%13178Volkswagen6314.3%– 9.7%47,0145.4%– 15.1%769Seat6314.3%– 19.0%95,0443.9%– 13.4%101010Kia5593.8%– 25.6%125,0433.9%+ 13.8%111311Tesla5513.8%+ 11.1%66,0214.6%+ 30.8%9812Hyundai5343.7%– 9.2%134,2553.2%+ 11.4%151213Opel5183.6%– 2.8%144,3353.3%– 18.7%141114Ford5163.5%– 15.5%212,9132.2%– 33.6%181415Audi3812.6%– 11.4%192,9862.3%– 0.6%171816Citroen3632.5%– 54.2%27,5435.8%+ 27.4%6917Nissan3432.4%– 33.3%174,7223.6%+ 11.4%121518BYD2942.0%+ 790.9%221,2511.0%+ 1151.0%233219Skoda2561.8%– 33.3%152,6202.0%+ 8.8%191920Fiat2171.5%– 76.7%203,7102.8%– 6.5%161621MG2021.4%+ 242.4%231,2861.0%+ 109.1%222622Mitsubishi1591.1%– 21.3%182,3231.8%+ 46.6%202123Mini1411.0%– 32.2%249380.7%– 19.3%252224Cupra1130.8%– 65.1%161,3671.0%– 9.7%212025Jeep1030.7%– 28.5%261,2340.9%+ 60.1%242326Porsche750.5%+ 11.9%257230.6%+ 28.4%262827Mazda660.5%– 15.4%323980.3%– 51.6%302428Land Rover640.4%– 28.1%276060.5%– 19.8%282529Honda500.3%– 27.5%284700.4%+ 70.3%292930Smart430.3%+ 138.9%303530.3%+ 127.7%313331Lexus400.3%+ 11.1%293440.3%+ 18.6%323132Suzuki380.3%+ 8.6%342000.2%+ 3.1%343433DS330.2%– 55.4%356380.5%– 12.2%272734Alfa Romeo200.1%– 64.3%313340.3%– 5.4%333035Jaguar140.1%– 46.2%36970.1%– 48.4%363636Polestar130.1%– 63.9%331220.1%– 31.5%353537Lamborghini30.0%n/a38220.0%+ 83.3%394438Aston Martin20.0%– 60.0%37320.0%+ 6.7%373839Ferrari20.0%+ 100.0%39220.0%+ 4.8%384241Bentley10.0%– 87.5%40200.0%– 42.9%413740Maserati10.0%– 80.0%43190.0%– 42.4%403942Man10.0%– 50.0%4160.0%– 70.0%4343
Portugal July 2024 – models:
PosModelJul-24%/23Jun2024%/23PosFY231Peugeot 20088335.7%+ 159.5%54,6633.6%– 5.8%212Dacia Sandero5463.8%+ 18.7%35,1653.9%+ 48.8%123Renault Clio5213.6%+ 43.9%64,3333.3%+ 13.5%344Mercedes A-Class3702.5%+ 88.8%102,2171.7%– 12.1%1285Tesla Model 32972.0%+ 106.3%24,2283.2%+ 176.5%476Volvo EX302862.0%new191,4251.1%new242977Opel Corsa2842.0%– 13.4%132,1261.6%– 23.2%1398Peugeot 2082761.9%– 56.4%83,4022.6%– 18.6%639Seat Ibiza2611.8%– 36.3%72,3421.8%– 1.1%101410Dacia Duster2491.7%– 11.4%421,8461.4%– 17.5%161211Tesla Model Y2471.7%– 28.6%111,7611.3%– 40.1%19512Peugeot 3082281.6%+ 49.0%42,8342.2%+ 33.9%81113Renault Captur2181.5%– 4.4%153,0042.3%– 10.5%7614Toyota Yaris Cross2061.4%+ 60.9%162,0451.6%+ 54.9%142415BMW X12021.4%+ 65.6%331,0990.8%+ 156.8%326416Seat Leon1821.3%+ 68.5%439410.7%+ 110.0%395017Kia Stonic1811.2%+ 9.7%241,7851.4%+ 50.8%172818Ford Focus1721.2%– 1.1%321,1820.9%– 33.2%292319Mercedes C-Class1721.2%+ 50.9%491,0510.8%+ 36.1%343320Dacia Jogger1561.1%– 12.4%202,3401.8%+ 11.0%111021MG41561.1%+ 403.2%398070.6%+ 258.7%4910822Volvo XC601551.1%+ 154.1%617970.6%+ 43.3%505823Peugeot 30081541.1%– 31.6%409010.7%– 51.1%432224Nissan Juke1531.1%– 18.2%182,4381.9%+ 130.4%93225Ford Puma1501.0%– 51.3%771,0140.8%– 25.2%352626Citroen C31471.0%– 47.3%13,6052.8%+ 114.7%51327Toyota Yaris1431.0%– 18.8%311,4631.1%– 19.9%202028Fiat 5001380.9%– 81.1%461,7641.3%– 23.0%181629Hyundai i201350.9%+ 51.7%121,4581.1%+ 106.5%223930Seat Arona1330.9%– 39.8%171,3881.1%– 44.2%251531Hyundai Tucson1330.9%+ 35.7%577000.5%– 5.1%555132BYD Seal1310.9%new654900.4%new7531033BMW iX11300.9%new935410.4%new7010634VW T-Cross1270.9%+ 104.8%251,1810.9%– 12.5%303735BMW 2 Series1240.9%– 26.2%349610.7%– 39.6%382136VW T-Roc1210.8%+ 163.0%281,4381.1%– 13.4%232537Opel Astra1170.8%+ 95.0%528380.6%+ 19.7%475338Toyota C-HR1160.8%+ 6.4%637640.6%– 33.0%533539Mercedes GLA1110.8%+ 4.7%388110.6%+ 53.9%485540Hyundai Kauai1090.7%– 44.1%508580.7%– 28.0%463141Skoda Octavia1070.7%+ 32.1%299150.7%+ 127.6%426042BMW 5 Series1070.7%+ 98.1%826160.5%+ 9.8%627043Audi Q31050.7%+ 200.0%874670.4%+ 86.1%7911044BMW 1 Series1030.7%– 26.4%211,4611.1%– 11.1%211945Citroen C4990.7%– 48.4%351,0000.8%– 21.3%363046Nissan Qashqai990.7%– 48.2%361,9181.5%– 9.2%151747Mercedes EQE970.7%+ 203.1%645100.4%+ 22.9%736148Toyota Corolla950.7%– 2.1%786710.5%– 26.1%594649Kia Xceed940.6%– 57.1%547000.5%– 7.3%564550Audi A3910.6%– 2.2%489280.7%+ 11.8%414451Mercedes E-Class880.6%+ 175.0%441,0820.8%+ 213.6%338452BYD Atto 3880.6%+ 193.3%564320.3%+ 453.8%8212553Volvo XC40850.6%– 79.0%231,2180.9%– 29.7%281854VW ID.4850.6%+ 16.4%663400.3%– 23.1%947355Kia Picanto830.6%+ 102.4%376100.5%+ 29.0%648356BMW 3 Series810.6%– 49.7%797860.6%– 31.6%513457Volvo V60770.5%+ 67.4%416850.5%+ 170.8%5712058Ford Transit760.5%+ 153.3%1162070.2%+ 68.3%12717159Mercedes GLC Coupe750.5%– 38.5%1014240.3%+ 2.2%847860Renault Megane730.5%– 27.0%1085980.5%– 35.7%653861Mini720.5%– 39.5%705180.4%– 20.3%715262Kia Sportage720.5%– 32.7%686710.5%+ 30.0%586263Toyota Aygo X690.5%– 25.8%856700.5%+ 22.0%608064Mini Countryman690.5%– 14.8%813800.3%– 16.7%887665Mercedes Vito Tourer690.5%new902760.2%new110 –66Jeep Avenger670.5%+ 204.5%749380.7%+ 1134.2%4010367VW Taigo660.5%– 4.3%91,1370.9%– 6.3%313668Mercedes CLA650.4%– 21.7%516500.5%– 3.1%614969Hyundai Ioniq 5650.4%+ 261.1%1482040.2%+ 213.8%12817970Audi Q4640.4%+ 1.6%604730.4%+ 12.9%778171Mitsubishi Space Star630.4%+ 23.5%149800.7%+ 4.7%375472VW Multivan600.4%+ 62.2%474880.4%+ 310.1%7615473BMW i5590.4%new1043470.3%new9217674BMW i4570.4%– 61.5%587840.6%– 7.8%522775Mercedes EQA550.4%– 22.5%625840.4%+ 38.4%666576Opel Mokka550.4%– 9.8%558720.7%– 8.8%444077Toyota RAV4540.4%– 5.3%944930.4%+ 72.4%749678Mercedes GLC530.4%– 38.4%925120.4%+ 43.0%727579BMW iX2510.4%new1172010.2%new13032280Kia Ceed500.3%– 15.3%765470.4%+ 104.1%699481Ford Kuga500.3%+ 177.8%1061980.2%– 50.0%1319782Mercedes CLE490.3%new1281650.1%new14225483Skoda Fabia470.3%+ 176.5%1512700.2%– 5.9%11210284Mitsubishi Colt470.3%new897030.5%new5422385Peugeot 5008450.3%– 66.2%1334120.3%– 42.2%865986Seat Tarraco450.3%+ 50.0%961900.1%+ 48.4%13614187Peugeot 408440.3%+ 2.3%714360.3%+ 84.7%8111688Hyundai i10430.3%– 15.7%1092860.2%+ 53.8%10511889Toyota Corolla Cross430.3%+ 30.3%1453180.2%+ 158.5%9816490Citroen C3 Aircross420.3%– 68.4%271,3531.0%+ 1.2%262991Cupra Leon420.3%+ 133.3%224690.4%+ 373.7%7813092Audi A1410.3%– 14.6%752510.2%– 41.2%1149293Mitsubishi ASX400.3%– 71.2%595600.4%+ 16.9%688294Kia Niro400.3%– 16.7%693830.3%+ 77.3%8710495Porsche Cayenne Coupe400.3%+ 1233.3%972790.2%+ 160.7%10915696Cupra Formentor390.3%– 81.3%535720.4%– 43.4%674397Nissan Leaf390.3%– 58.9%2081140.1%– 71.4%1658998Nissan Ariya380.3%+ 192.3%1471370.1%– 34.1%15413999Mercedes GLB370.3%+ 48.0%1213540.3%+ 25.5%90107100Audi Q8350.2%– 65.7%1223520.3%+ 19.7%9174101Mercedes GLE350.2%+ 52.2%1191870.1%+ 125.3%137152102Skoda Kamiq340.2%– 75.4%306150.5%+ 5.7%6369103Toyota Prius340.2%+ 21.4% –1130.1%+ 130.6%166174104BYD Seal U340.2%new129640.0%new196 –105Dacia Logan340.2%n/a160520.0%n/a209 –106Renault Symbioz340.2%new259360.0%new226 –107Fiat 600330.2%new1752130.2%new125294108Cupra Born320.2%– 67.0%453260.2%– 19.3%9568109BMW iX320.2%– 61.0%1402240.2%– 56.3%123101110Toyota Proace City Verso320.2%+ 300.0%181850.1%+ 80.9%177220111VW Tiguan310.2%– 45.6%1561710.1%– 58.8%14186112BMW X2310.2%+ 82.4%1431110.1%– 54.1%167134113Citroen C5 Aircross300.2%– 65.9%914240.3%– 12.6%8385114Opel Crossland300.2%– 48.3%1131900.1%– 65.1%13571115Toyota bZ4X300.2%– 38.8%1411640.1%– 55.6%14593116BYD Dolphin300.2%new1622290.2%new120226117Renault Austral290.2%– 23.7%1362900.2%– 25.4%10367118BMW X5290.2%+ 38.1%1731620.1%+ 121.9%146165119Range Rover Sport280.2%– 3.4%1651540.1%+ 10.8%148140120MG ZS280.2%+ 86.7%992960.2%+ 89.7%102133121VW Passat280.2%+ 600.0%166730.1%– 33.6%190186122VW ID.3270.2%– 69.0%732880.2%– 55.6%10463123Fiat Panda270.2%– 61.4%721,2791.0%+ 178.6%2757124BMW X3270.2%– 50.0%1023240.2%+ 5.9%9690125Audi Q2250.2%– 32.4%983030.2%+ 4.1%101113126Peugeot 508250.2%– 16.7%1271640.1%– 32.2%144115127Hyundai i30240.2%– 63.1%862420.2%+ 13.6%117112128Honda HR-V240.2%– 51.0%882800.2%+ 135.3%108142129Ford Tourneo Courier240.2%n/a163720.1%n/a191 –130Mercedes EQB230.2%– 14.8%1152840.2%+ 39.9%106122131VW Golf220.2%– 72.2%833800.3%– 19.1%8977132DS 7220.2%– 45.0%1682510.2%– 18.0%115114133Mazda2220.2%+ 22.2%1571300.1%– 42.7%156126134Smart #1220.2%+ 120.0%1302370.2%+ 2054.5%119172135Lexus LBX220.2%new1391070.1%new170 –136BMW 4 Series210.1%– 59.6%1501820.1%– 41.7%140105137Opel Grandland210.1%– 8.7%1032040.2%– 32.5%129119138Skoda Superb210.1%+ 10.5%1181240.1%– 11.4%157161139Ford Tourneo/Transit Custom200.1%– 41.2%246630.0%– 47.5%197158140Mercedes V-Class200.1%– 9.1%1072390.2%+ 139.0%118157141Mercedes Sprinter200.1%+ 53.8%167880.1%+ 46.7%174189142Smart #3200.1%new1311100.1%new169 –143Jeep Compass190.1%– 69.8%1382120.2%– 52.0%12691144Ford Mustang (incl. Mach E)190.1%– 26.9%1701140.1%– 46.2%163127145Volvo XC90190.1%– 17.4%1691160.1%– 13.4%160151146Hyundai Santa Fe190.1%+ 111.1%227600.0%+ 1.7%198207147Skoda Scala180.1%– 69.0%1001970.2%– 62.0%13288148Alfa Romeo Tonale180.1%– 63.3%952810.2%– 14.8%107111149VW Polo180.1%– 25.0%678720.7%+ 4.9%4556150Volvo C40180.1%+ 100.0%1461370.1%– 54.8%155100151Renault Megane E-Tech170.1%– 80.7%803460.3%– 55.4%9341152Citroen e-C4170.1%– 22.7%1352740.2%– 53.6%11172153Toyota Proace Verso170.1%+ 54.5%2001410.1%+ 58.4%152143154Suzuki Swift170.1%+ 142.9%159830.1%+ 97.6%181221155Honda Jazz150.1%+ 0.0%193850.1%+ 0.0%176181156Kia Sorento150.1%+ 200.0%214590.0%+ 96.7%200229157Mercedes B-Class140.1%– 51.7%1521490.1%– 24.0%149123158Nissan X-Trail140.1%– 50.0%1901150.1%– 45.5%162131159Skoda Karoq140.1%+ 27.3%149700.1%– 27.1%192190160Dacia Spring130.1%– 87.1%1322230.2%– 73.8%12447161VW ID.5130.1%– 68.3%1371060.1%– 71.7%17187162Polestar 2130.1%– 63.9%1101180.1%– 33.7%159132163Renault Zoe130.1%– 45.8%841410.1%+ 42.4%151155164Mazda CX-5130.1%+ 18.2%179760.1%– 21.6%185182165Kia EV6120.1%– 70.0%1231910.1%+ 44.7%134146166Lexus NX120.1%– 36.8%1341640.1%+ 17.1%143147167Suzuki Vitara120.1%– 7.7%184390.0%– 13.3%223218168Land Rover Defender120.1%+ 71.4%180680.1%+ 23.6%194202169VW Caddy120.1%+ 200.0%1551400.1%+ 125.8%153192170Kia EV9120.1%new182840.1%new178230171Renault Scenic E-Tech120.1%new105830.1%new180 –172Renault Arkana110.1%– 47.6%1202260.2%– 64.2%12279173Fiat 500X110.1%– 45.0%1711440.1%+ 42.6%150128174Porsche Taycan110.1%– 15.4%199380.0%– 68.9%224144175Range Rover Evoque100.1%– 63.0%1241920.1%– 32.6%133117176DS 4100.1%– 41.2%1892280.2%– 30.5%12195177Seat Ateca100.1%+ 0.0%1871830.1%– 53.9%13999178Mazda MX-5100.1%+ 11.1%216480.0%– 29.4%211206179Citroen C4 X100.1%new1122570.2%new113209180Jeep Renegade90.1%– 83.3%183680.1%– 68.9%193136181Skoda Kodiaq90.1%– 76.9%1423070.2%+ 22.8%99109182Mazda MX-3090.1%– 52.6%176430.0%– 75.7%218129183Mitsubishi Eclipse Cross90.1%– 25.0%188800.1%– 52.9%183135184Mercedes G-Class90.1%+ 50.0%185350.0%+ 9.4%228225185BYD Han90.1%+ 350.0%231250.0%+ 150.0%246265186Renault Trafic80.1%– 78.9%1252430.2%+ 72.3%116148187BMW iX380.1%– 65.2%192830.1%– 54.4%179121188Volvo V9080.1%– 38.5%224370.0%– 43.9%225197189Mercedes EQS80.1%– 11.1%204540.0%– 51.4%206162190Peugeot Expert Traveller80.1%– 11.1% –280.0%– 75.2%237183191Renault Kangoo80.1%+ 100.0%197890.1%+ 1012.5%173214192MG Marvel R80.1%+ 300.0%205470.0%– 31.9%213203193Audi Q680.1%new –80.0%new282 –194Jaguar E-Pace70.0%– 66.7%195650.0%– 32.3%195175195Citroen C5 X70.0%– 65.0%211580.0%– 62.1%201150196Audi A670.0%– 61.1%154850.1%– 37.5%175153197Land Rover Discovery Sport70.0%– 22.2%212520.0%– 49.0%210184198Mercedes GLE Coupe70.0%– 12.5%202800.1%+ 33.3%182167199BMW X470.0%– 12.5%241390.0%– 58.9%221191200Mercedes S-Class70.0%+ 0.0%186750.1%+ 19.0%187204201Porsche Macan70.0%+ 40.0%1771110.1%+ 3.7%168177202Jeep Wrangler70.0%+ 40.0%267150.0%– 55.9%262234203BMW Z470.0%+ 75.0%282180.0%– 10.0%257256204VW ID.770.0%new236740.1%new189332205Fiat Tipo60.0%– 93.8%263050.2%– 71.4%10048206Skoda Enyaq60.0%– 71.4%1611220.1%– 6.9%158138207Range Rover 60.0%– 62.5%201940.1%– 32.4%172163208Peugeot e-Rifter60.0%– 33.3%2453220.2%+ 318.2%97199209Renault Master60.0%– 33.3%144460.0%– 51.1%216195210Mazda CX-6060.0%– 25.0%196540.0%– 36.5%205193211VW Kombi60.0%+ 20.0%1111160.1%+ 152.2%161215212Jaguar F-Pace60.0%+ 50.0%228240.0%– 7.7%248248213Opel Zafira Life60.0%+ 100.0%244310.0%– 42.6%232198214Porsche Panamera60.0%+ 200.0%153560.0%+ 27.3%203216215Peugeot Expert60.0%n/a238240.0%+ 2300.0%249330216Citroen e-C4 X50.0%– 87.8%158750.1%– 54.0%186168217Porsche 91150.0%– 85.7%1261850.1%+ 21.7%138137218Suzuki S-Cross50.0%– 50.0%215220.0%– 66.7%253212219Ford Tourneo/Transit Connect50.0%– 37.5%249540.0%– 16.9%204188220Mercedes AMG GT50.0%+ 0.0%250200.0%– 25.9%256253221Porsche Cayman50.0%+ 66.7%234210.0%+ 75.0%254267222Honda CR-V50.0%+ 150.0%209570.0%+ 54.1%202232223Mercedes GLS50.0%+ 150.0%219350.0%+ 34.6%229245224BMW XM50.0%+ 400.0%206270.0%+ 800.0%239280225Renault Espace50.0%n/a174600.0%+ 400.0%199246226Renault Rafale50.0%new164330.0%new231 –227MG350.0%new207170.0%new259 –228Audi Q540.0%– 73.3%203470.0%– 47.8%212178229VW Crafter40.0%– 55.6%230240.0%– 40.0%250227230Hyundai Ioniq 640.0%– 33.3%243270.0%– 51.8%240196231BMW X640.0%+ 33.3%281230.0%+ 0.0%252244232Tesla Model X40.0%+ 100.0% –170.0%– 75.0%260208233Honda ZR-V40.0%new237260.0%new244275234Citroen Berlingo30.0%– 75.0%2424370.3%+ 180.1%80276235MG EHS30.0%– 70.0%1911140.1%– 16.8%164160236Mazda CX-3030.0%– 66.7%248290.0%– 75.6%234180237Suzuki Ignis30.0%– 40.0%226530.0%+ 32.5%208222238BMW X730.0%– 40.0%217200.0%– 9.1%255238239BMW i730.0%– 25.0%266250.0%+ 4.2%245239240Mazda330.0%– 25.0%252180.0%– 64.0%258228241Tesla Model S30.0%– 25.0%274150.0%– 77.6%263213242BMW 7 Series30.0%+ 50.0%194460.0%– 4.2%214217243Hyundai Bayon20.0%– 96.4%1144200.3%– 30.5%8542244Lexus RX20.0%– 77.8%271140.0%– 50.0%264235245Mercedes Citan20.0%– 75.0%222270.0%– 71.6%241170246Lexus UX20.0%– 66.7%247300.0%– 61.5%233210247Alfa Romeo Giulia20.0%– 50.0%218260.0%+ 116.7%242263248Honda Civic20.0%– 33.3%232120.0%– 63.6%269241249Aston Martin DBX20.0%+ 100.0%239120.0%– 7.7%268273250BYD Tang EV20.0%+ 100.0%272110.0%– 8.3%271269251Mercedes eVito20.0%+ 100.0%27970.0%– 30.0%289240252Mercedes EQV20.0%+ 100.0% –60.0%– 33.3%293258253MG520.0%+ 100.0% –50.0%– 82.1%296259254Mercedes Citan Tourer20.0%new220450.0%new217 –255Opel Movano20.0%n/a284290.0%+ 2800.0%235255256Citroen e-Berlingo20.0%new –260.0%new243169257Opel Combo20.0%n/a27660.0%+ 50.0%294291258Ferrari 296 GTS20.0%new –40.0%new299313259VW Arteon10.0%– 98.0%262750.1%– 68.1%188124260VW Up!10.0%– 97.1%264540.0%– 54.6%207173261Renault Twingo10.0%– 95.8%172790.1%– 40.2%184166262DS 310.0%– 87.5%1981570.1%+ 503.8%147194263Smart Fortwo10.0%– 87.5%22950.0%– 96.5%297149264VW ID.Buzz10.0%– 85.7%223290.0%– 68.5%236187265Porsche Boxster10.0%– 83.3%275250.0%+ 31.6%247266266Citroen Spacetourer10.0%– 80.0%265340.0%– 15.0%230231267BMW 8 Series10.0%– 80.0%25190.0%– 65.4%279257268Maserati Grecale10.0%– 75.0% –140.0%– 46.2%265251269Bentley Bentayga10.0%– 75.0%278100.0%– 23.1%273272270Mercedes SL-Class10.0%– 75.0%27390.0%– 81.3%281224271Man TGE10.0%– 50.0%23360.0%– 70.0%292261272Range Rover Velar10.0%+ 0.0%178460.0%+ 27.8%215219273Lexus RZ10.0%+ 0.0%270160.0%+ 6.7%261252274Opel Vivaro10.0%n/a –390.0%+ 1850.0%222279275Mercedes CLS10.0%n/a253120.0%– 7.7%270274276Lamborghini Huracan10.0%n/a240110.0%+ 1000.0%272315277Mercedes e-Citan Tourer10.0%new285100.0%new275 –278VW Touareg10.0%n/a235100.0%+ 150.0%277296279Lamborghini Urus10.0%n/a28690.0%– 18.2%280284280Audi A810.0%n/a –30.0%+ 200.0%306314281Lexus LM10.0%new29230.0%new312 –282Suzuki Swace10.0%n/a –30.0%+ 200.0%313317284Fiat Doblo10.0%n/a –20.0%– 92.3%320211285Jaguar i-Pace10.0%n/a –20.0%– 95.6%324237286Lamborghini Revuelto10.0%new –20.0%new325 –287Volvo EX4010.0%new29720.0%new334 –288Fiat Ulysse10.0%new –10.0%new356341289Jeep Grand Cherokee10.0%n/a –10.0%n/a357321
Source: ACAP

More Stories
The New EV Reality Why 2026 Will Look More Hybrid Than Electric
Ford’s eye-popping $19.5 billion EV write-down is not just a headline-grabber, it is a reminder that automakers build on long...
Serbia November 2025: Skoda Octavia now #1 YTD, Toyota Yaris Cross up to #2
The Toyota Yaris Cross is up to 2nd place in Serbia in November. CE Auto data indicates a Serbian new...
Albania November 2025: BYD monopolises Top 5, holds over 50% share
The BYD Yuan Up is the most popular vehicle in Albania in November. Thanks to our local partner CE Auto...
Moldova November 2025: Jetour X50 up to record third place
The Jetour X50 is up to #3 in Moldova in November. Based on data by our local partner CE Auto, the...
Bosnia & Herzegovina November 2025: Skoda Octavia and Fabia on top
The Skoda Octavia is by far the most popular vehicle in Bosnia & Herzegovina. Data by CE Auto shows a...
Montenegro November 2025: Toyota Yaris snaps up top spot
The Toyota Yaris holds 6.8% of the Montenegrin new car market in November. Based on data by our local partner...