
Ireland July 2024: 8 SUV in Top 10, YTD volume now in negative
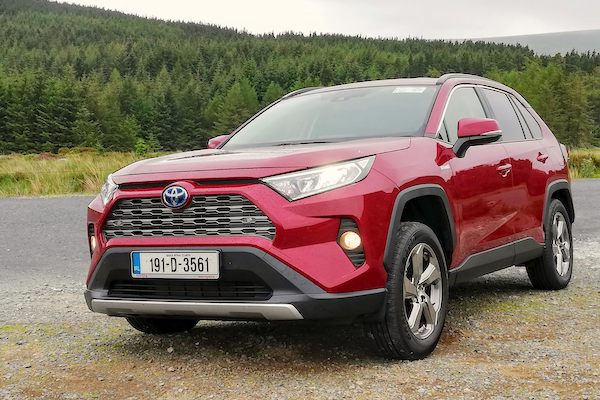
Toyota RAV4 sales are up 105% year-on-year in July.
July is the month of the bi-annual licence plate change in Ireland and traditionally corresponds to the 2nd largest monthly volume in the year. July 2024 is no exception, even if results are a little disappointing this year at -6% year-on-year to 25,705 sales. The year-to-date tally tilts into negative as a result at -0.3% to 104,631. Toyota (-5.2%) is back to #1 in the brands charts, followed by Volkswagen (+4.2%) at 12.8%. Hyundai (-15.6%) is back up five spots on June but struggles year-on-year. It distances Skoda (+21.8%) and Kia (+11.3%) both in excellent shape. BMW (+33.1.%) and Dacia (+14.4%) also shine below, with the latter outselling both Renault (-31.5%) and Peugeot (-15.1%). #1 last month with 34.6% share, Tesla (+395.1%) falls to #21 but surges year-on-year due to execrable year-ago results.
The Hyundai Tucson (-10.9%) is the clear leader with 5.5% share, 2/3 more than the #2, and this despite a year-on-year drop. The Toyota RAV4 (+105%) climbs five ranks on last month to #2 ahead of the VW Tiguan (+54.5%) and Toyota Yaris Cross (+9.6%). In fact there are 8 SUVs inside This month’s Top 10, with the Kia Sportage (+9.6%) at #5, the Skoda Kodiaq (+70.5%) at #7, the Hyundai Kona (-26%) at #9 and the Toyota C-HR (+17.2%) at #10. The two odd ones out are the Skoda Octavia (+47%) at #6 and the Toyota Corolla (+3.7%) at #8.
Previous month: Ireland June 2024: Tesla up to 34.3% share, Model 3 and Y on top
One year ago: Ireland July 2023: Toyota Corolla Cross #2, MG 4 #9, market up 23.9%
Full July 2024 Top 40 All brands and Top 245 All models below.
Ireland July 2024 – brands:
PosBrandJul-24%/23Jun2024%/23PosFY231Toyota3,83414.9%– 5.2%215,51614.8%+ 3.3%112Volkswagen3,30012.8%+ 4.2%311,75911.2%+ 0.1%223Hyundai2,91411.3%– 15.6%810,0529.6%– 4.9%434Skoda2,3829.3%+ 21.8%410,46510.0%+ 22.5%345Kia1,9347.5%+ 11.3%57,5577.2%+ 1.4%556Audi1,0964.3%– 2.2%94,5924.4%+ 3.1%777Dacia1,0244.0%+ 14.4%103,6173.5%– 17.3%1198Renault9593.7%– 31.5%233,2653.1%– 11.9%12129Peugeot9473.7%– 15.1%163,8673.7%– 3.1%91010BMW9283.6%+ 33.1%73,9713.8%+ 5.0%8811Ford7593.0%– 27.9%63,6843.5%– 29.5%10612Nissan7352.9%– 45.4%274,7434.5%+ 16.1%61113Mercedes6432.5%+ 36.2%142,7032.6%+ 8.1%131414Seat6382.5%+ 8.9%112,6072.5%+ 6.5%141615Opel5022.0%+ 11.8%122,2962.2%– 9.6%151516Volvo4041.6%– 10.6%151,5921.5%– 17.0%181717Suzuki3601.4%+ 3.2%181,7911.7%+ 8.6%171818Mazda3051.2%+ 4.1%281,1981.1%+ 8.3%202219BYD2791.1%+ 34.8%221,2001.1%+ 275.0%192720Cupra2521.0%– 50.3%241,1821.1%– 14.0%212021Tesla2030.8%+ 395.1%11,8041.7%– 18.4%161322Lexus2000.8%+ 36.1%207970.8%+ 59.4%252523MG1980.8%– 72.7%219280.9%– 25.4%231924Citroen1950.8%– 15.6%139810.9%– 8.1%222125Land Rover1730.7%– 2.3%258360.8%+ 46.9%242326Mini1550.6%+ 59.8%174240.4%– 24.4%272427Fiat1420.6%– 29.7%305290.5%+ 8.8%262628Porsche660.3%– 20.5%262950.3%– 25.9%282829Honda540.2%+ 63.6%311620.2%– 16.1%293030DS410.2%– 18.0% –1290.1%– 34.8%313131Polestar230.1%– 17.9%191450.1%– 38.6%302932Jeep200.1%+ 100.0%29970.1%+ 61.7%323333SsangYong90.0%+ 350.0%32390.0%– 30.4%363534Smart90.0%n/a33290.0%n/a37 –35Alfa Romeo60.0%+ 200.0% –430.0%– 14.0%343436Jaguar50.0%– 37.5% –510.0%– 23.9%333237GWM Ora50.0%+ 25.0% –410.0%+ 36.7%353738Subaru40.0%+ 100.0% –150.0%– 55.9%383639Aston Martin10.0%n/a –10.0%n/a42 –40Lotus10.0%n/a –10.0%n/a43 –
Ireland July 2024 – models:
PosModelJul-24%/23Jun2024%/23PosFY231Hyundai Tucson1,4185.5%– 10.9%114,8234.6%+ 0.1%112Toyota RAV48553.3%+ 105.0%73,1673.0%+ 71.2%4123VW Tiguan8483.3%+ 54.5%102,3442.2%+ 34.2%7144Toyota Yaris Cross7853.1%+ 9.6%32,9272.8%+ 2.7%545Kia Sportage7683.0%+ 9.6%63,3313.2%+ 7.1%326Skoda Octavia7442.9%+ 47.0%43,8863.7%+ 86.6%297Skoda Kodiaq6362.5%+ 70.5%521,9101.8%+ 22.0%12168Toyota Corolla5842.3%+ 3.7%52,6142.5%– 11.0%639Hyundai Kona5752.2%– 26.0%242,2232.1%+ 24.1%81010Toyota C-HR5582.2%+ 17.2%151,9901.9%– 17.9%10711VW T-Roc5552.2%+ 18.3%231,7041.6%– 4.5%161312Toyota Yaris5472.1%– 14.9%132,2132.1%– 13.6%9613Dacia Sandero5462.1%+ 35.1%181,8501.8%+ 5.8%151514VW Golf4591.8%– 24.8%121,9691.9%+ 52.4%112115Hyundai i204351.7%+ 69.9%921,3011.2%+ 29.2%203516VW ID.44181.6%– 25.2%91,2841.2%– 50.4%21517VW Polo4051.6%+ 68.8%191,4531.4%+ 46.0%182518Peugeot 30083541.4%+ 34.1%411,1471.1%+ 15.5%243319Ford Puma3211.2%– 22.7%81,3941.3%– 7.1%191820Dacia Duster3211.2%– 2.7%311,2341.2%– 25.4%231721Audi Q33141.2%+ 95.0%351,0491.0%+ 62.4%275422Renault Captur2991.2%+ 1.4%1067590.7%– 4.4%414723Kia Sorento2911.1%+ 77.4%576550.6%+ 29.2%464324Skoda Karoq2801.1%– 2.8%801,2351.2%+ 14.5%222925Seat Arona2651.0%+ 23.8%349070.9%– 3.9%333426Toyota Corolla Cross2621.0%– 71.2%141,6031.5%+ 50.0%172627Nissan Juke2611.0%– 11.2%651,9011.8%+ 172.7%144828Nissan Qashqai2601.0%– 67.4% –1,9021.8%– 20.8%13829Skoda Kamiq2551.0%+ 123.7%829330.9%+ 22.6%314230VW T-Cross2400.9%+ 64.4%287800.7%– 9.4%384131Renault Arkana2330.9%– 44.0%581,0461.0%– 9.2%282432Peugeot 20082240.9%– 32.5%509280.9%– 15.0%323033Ford Focus2190.9%– 23.4%171,0731.0%– 23.9%261934Kia Niro2190.9%+ 8.4%409570.9%– 13.9%302235Kia Stonic2060.8%+ 52.6%1346650.6%+ 30.1%456636Ford Kuga2030.8%– 27.2%251,0911.0%– 17.2%252037BMW X51980.8%+ 17.2%785000.5%+ 1.2%625738Skoda Fabia1860.7%+ 75.5%557520.7%+ 64.6%436839Kia Ceed1790.7%+ 26.1%677940.8%+ 17.3%374440Kia EV61750.7%+ 5.4%1005860.6%– 23.3%514041Opel Corsa1750.7%+ 48.3%937600.7%+ 17.5%405842Tesla Model Y1670.6%+ 438.7%29880.9%– 36.5%291143BMW 5-Series1650.6%+ 75.5%338170.8%+ 18.2%345544Suzuki Swift1600.6%+ 220.0%1074060.4%+ 53.2%739745Dacia Jogger1570.6%– 2.5%765330.5%– 45.2%583646Volvo XC601540.6%– 34.5%455740.5%– 34.5%533847Audi A31510.6%– 10.7%976730.6%+ 9.6%445648Seat Ibiza1410.5%+ 161.1%855730.5%+ 85.4%549849Skoda Superb1400.5%– 31.7%718010.8%– 29.7%362350Peugeot 50081390.5%– 39.8% –7530.7%+ 7.0%425251Hyundai Ioniq 51360.5%– 26.5%664440.4%– 62.8%692852Opel Mokka1290.5%– 11.0%536300.6%– 31.1%473753Renault Clio1280.5%– 65.2%1425650.5%– 39.4%553954Cupra Formentor1270.5%– 40.1%615410.5%– 9.5%575955Renault Austral1270.5%– 17.5% –5160.5%+ 135.6%6011256Mercedes E Class1260.5%+ 800.0%874850.5%+ 144.9%6412057BYD Seal1210.5%new475870.6%new5024358Audi A61200.5%– 9.8%1225810.6%– 1.2%526059BMW 3-Series1180.5%+ 103.4%545120.5%+ 47.6%617960Toyota bZ4X1080.4%– 14.3%303280.3%– 45.9%886261Skoda Scala1060.4%+ 20.5%1234510.4%+ 9.5%678162Hyundai Bayon1040.4%+ 205.9%1213910.4%+ 14.0%769563Seat Ateca1020.4%– 42.0%514500.4%– 37.4%685164Lexus LBX1000.4%new442220.2%new109 –65Audi A4990.4%– 47.9%626120.6%– 14.5%494666Mercedes GLA980.4%+ 151.3%1433920.4%– 5.1%758367Peugeot 208940.4%– 1.1% –3640.3%– 29.6%826468Hyundai i10930.4%– 64.2%463740.4%– 39.1%816169Toyota Aygo/X920.4%– 16.4%733980.4%– 17.1%747470Audi Q5920.4%+ 15.0%223240.3%+ 2.9%898971Volvo EX30880.3%new742770.3%new98 –72BMW X3870.3%+ 770.0%293900.4%+ 92.1%778773Nissan X-Trail860.3%– 53.5% –4230.4%+ 46.4%709174Volvo XC90860.3%– 21.8%433890.4%– 4.9%798075BYD Dolphin830.3%new1472640.3%new10119876VW ID.7820.3%new1112000.2%new117 –77Mini Coupe820.3%n/a48890.1%n/a151 –78Renault Megane810.3%– 43.8%942600.2%– 48.7%1036979BMW X1810.3%– 4.7%984160.4%+ 29.6%719980Mercedes GLC810.3%+ 32.8%833600.3%+ 24.6%839381MG4800.3%– 85.9%915570.5%– 30.9%563182Audi Q4800.3%– 23.8%384130.4%– 21.5%726583Opel Astra800.3%+ 23.1%163530.3%+ 21.7%8410484Mazda CX-5790.3%– 10.2%1092810.3%– 0.4%9710085Mazda2760.3%+ 38.2%1303880.4%+ 102.1%8011786BYD Atto 3750.3%– 63.8%493490.3%+ 9.1%857587Cupra Leon740.3%– 22.1%793150.3%+ 25.5%9210588Seat Tarraco720.3%– 48.2%1174690.4%+ 1.1%657389Range Rover Sport720.3%+ 30.9% –3890.4%+ 203.9%7813190Suzuki SX4 S-Cross710.3%– 26.8%634570.4%+ 22.8%667791VW Taigo700.3%– 38.6%1183060.3%– 40.0%936792Suzuki Vitara690.3%– 49.3%366130.6%– 9.9%484593Mercedes CLA690.3%– 23.3%603160.3%– 17.1%917894Nissan Leaf680.3%+ 13.3%703050.3%– 28.2%948495Mazda CX-30630.2%+ 5.0%1312030.2%– 27.8%11510296VW Arteon620.2%– 65.0%377620.7%+ 13.4%395397Fiat Panda620.2%– 45.1% –2940.3%+ 84.9%9513898VW ID.3610.2%– 50.0%905240.5%– 24.4%595099Opel Crossland X600.2%– 3.2%1282720.3%– 25.3%10090100Nissan Ariya600.2%+ 650.0% –2120.2%+ 44.2%112155101Kia EV9600.2%new1102330.2%new108229102Hyundai Ioniq 6580.2%– 58.9% –2200.2%– 12.4%11096103Opel Grandland X580.2%+ 11.5% –2740.3%+ 2.2%99106104Seat Leon580.2%+ 1833.3%271800.2%+ 1400.0%121178105Peugeot 308550.2%+ 12.2%1371610.2%– 21.1%126121106Citroen C5 Aircross540.2%– 19.4%1012370.2%– 29.7%10776107BMW IX1540.2%+ 50.0%263400.3%+ 295.3%86139108Mercedes GLE510.2%+ 50.0%812120.2%+ 20.5%111124109Hyundai Santa Fe500.2%– 65.8% –720.1%– 71.4%16086110Suzuki Ignis490.2%– 19.7%722830.3%+ 2.2%9692111Mercedes GLB490.2%+ 22.5%1251390.1%– 30.8%133111112Audi A1480.2%+ 60.0% –1650.2%– 19.5%125116113Renault Rafale480.2%new –480.0%new177 –114Range Rover 470.2%+ 30.6%1041320.1%+ 6.5%136142115Audi A5450.2%– 41.6%1082490.2%– 6.4%104103116Hyundai i30450.2%– 26.2% –2040.2%– 19.7%114110117VW ID.Buzz450.2%new –670.1%new164 –118Fiat 500440.2%– 47.0% –1510.1%– 45.1%12894119BMW i4440.2%– 24.1%1321810.2%– 59.9%12071120BMW iX3440.2%+ 22.2%421410.1%– 33.8%131109121BMW 2-Series430.2%– 50.0%1161960.2%– 49.2%11882122Audi Q2430.2%– 41.1%1202100.2%– 5.8%113114123Audi Q7430.2%+ 186.7% –770.1%– 3.8%157163124Renault Scenic430.2%new –470.0%new178 –125MG ZS420.2%– 41.7%641770.2%– 8.8%122113126Mini Countryman420.2%+ 7.7%321040.1%– 32.9%144133127MG3420.2%new –480.0%new176 –128Volvo XC40410.2%– 53.9%772400.2%– 50.2%10670129Mercedes CLE Coupe400.2%new1121400.1%new132 –130Toyota Prius390.2%– 13.3% –1360.1%+ 189.4%135140131Citroen Berlingo370.1%+ 5.7%201830.2%+ 144.0%119137132Kia Picanto360.1%– 79.3%1273360.3%– 24.8%8772133Tesla Model 3360.1%+ 350.0%18160.8%+ 25.0%3532134Skoda Enyaq350.1%– 87.3%594970.5%– 52.5%6327135Porsche Cayenne350.1%+ 84.2%841710.2%+ 16.3%123129136Cupra Born340.1%– 83.0%962420.2%– 53.9%10563137Peugeot 408340.1%– 72.4% –3170.3%– 15.0%9085138Lexus ES340.1%– 15.0%1381230.1%– 14.6%138135139MG5330.1%– 50.7%391110.1%– 25.5%142126140Mazda CX-60330.1%– 37.7%1361470.1%– 18.3%129122141Lexus RX320.1%– 3.0%1441380.1%+ 42.3%134143142Peugeot 508320.1%+ 166.7%150830.1%+ 56.6%156172143Fiat 600320.1%new157350.0%new190 –144BMW 1-Series290.1%+ 141.7%1291690.2%+ 50.9%124146145Citroen C4270.1%– 44.9%992000.2%– 8.7%116118146Mercedes C Class270.1%– 3.6%119900.1%– 49.4%150125147Mazda3270.1%+ 35.0% –1230.1%+ 25.5%139147148Citroen C3250.1%– 10.7%1241150.1%– 45.0%141123149DS 7240.1%– 22.6% –870.1%+ 2.4%153159150Porsche Panamera240.1%+ 118.2%155400.0%+ 11.1%186180151Mini Clubman240.1%+ 300.0%103660.1%+ 112.9%165182152VW ID.5230.1%– 70.1%126960.1%– 66.9%147107153Lexus NX220.1%– 60.7%882630.3%+ 24.1%102119154Land Rover Defender220.1%– 53.2%1021250.1%+ 95.3%137149155Mercedes EQE220.1%– 51.1%1351570.2%– 6.0%127136156Volvo C40220.1%+ 120.0% –860.1%– 33.3%154144156Citroen E-C4 X210.1%+ 2000.0%151600.1%+ 5900.0%167210157Polestar 2200.1%– 28.6%211420.1%– 39.8%130108158Mercedes EQE SUV190.1%new148940.1%new148217159Audi Q8180.1%– 5.3%152490.0%– 2.0%174176160Honda Jazz180.1%+ 50.0%154450.0%– 40.8%179156161DS 4170.1%+ 41.7% –330.0%– 62.5%193160162VW Touareg170.1%+ 54.5%149710.1%+ 184.0%161196163Cupra Ateca170.1%n/a –840.1%n/a155226164Citroen C3 Aircross160.1%– 40.7%139760.1%– 24.0%158157165Mazda MX-5160.1%+ 6.7% –340.0%– 20.9%192181166BMW 4-Series150.1%+ 25.0% –620.1%– 72.6%166115167Audi Q8 E-Tron140.1%– 63.2% –880.1%+ 54.4%152158168Land Rover Discovery Sport140.1%+ 75.0% –840.1%+ 23.5%156166169Honda CR-V140.1%+ 250.0% –400.0%– 7.0%185177170Jeep Avenger140.1%new113590.1%new168225171Honda Civic130.1%– 13.3% –490.0%– 16.9%175167172Peugeot Rifter130.1%+ 30.0%681020.1%+ 92.5%145154173Volvo V60130.1%+ 62.5% –260.0%+ 30.0%200209174Range Rover Evoque120.0%– 33.3%75680.1%– 32.7%162150175Lexus UX120.0%– 33.3%114510.0%+ 8.5%173171176Mercedes V Class120.0%+ 300.0%141370.0%+ 236.4%187221177BMW i5120.0%new –510.0%new172206178Mercedes EQB110.0%– 65.6%133970.1%– 11.0%146148179Audi A7110.0%+ 57.1%89360.0%+ 100.0%188204180Suzuki Swace110.0%+ 120.0% –320.0%– 41.8%195168181Mazda MX-30110.0%+ 1000.0% –220.0%+ 29.4%207202182BMW X2110.0%n/a115430.0%+ 207.1%180223183VW Caddy90.0%– 25.0%69750.1%– 49.7%159132184Mercedes EQA80.0%– 66.7%105580.1%– 26.6%169161185Audi Q6 e-tron80.0%new –80.0%new234 –186Honda ZR-V80.0%new –80.0%new235 –187Mercedes T class80.0%new –80.0%new236 –188Mini Hatch70.0%– 80.0%951100.1%– 63.8%14388189BMW X770.0%+ 133.3% –230.0%– 23.3%206187190Audi e-Tron70.0%+ 600.0% –200.0%– 37.5%210190191Porsche Taycan60.0%– 87.0%56670.1%– 59.6%163128192Citroen C5 X60.0%– 50.0%86550.1%– 16.7%170164193Mercedes EQS SUV60.0%– 45.5% –190.0%+ 11.8%213199194VW T760.0%– 33.3% –330.0%+ 37.5%194192195Mercedes EQS60.0%– 25.0% –140.0%– 76.3%225174196BMW 7 Series50.0%– 66.7% –400.0%– 11.1%183175197Range Rover Velar50.0%– 58.3%145270.0%– 59.1%198169198Audi A850.0%+ 66.7% –150.0%+ 7.1%219216199Ssangyong Korando50.0%+ 400.0%146260.0%– 50.9%199173200GWM Ora 0350.0%new –410.0%new182194201Citroen C4 X50.0%new –180.0%new214 –202Smart #150.0%new –180.0%new216 –203Mercedes S Class40.0%– 20.0%140430.0%+ 34.4%181185204Jaguar i-Pace40.0%– 20.0% –240.0%– 53.8%204170205Jeep Compass40.0%– 20.0% –200.0%– 51.2%211179206Ford Tourneo40.0%+ 100.0% –240.0%– 25.0%203186207Smart #340.0%new156110.0%new230 –208BMW IX240.0%new –60.0%new238 –209Ssangyong Torres40.0%new –60.0%new243 –210Toyota Camry30.0%– 90.6% –1190.1%– 30.8%140127211Mercedes AMG GT30.0%– 40.0% –120.0%– 25.0%228215212Ford Mustang Mach-E30.0%– 25.0% –170.0%+ 240.0%217165213BMW XM30.0%+ 50.0% –140.0%+ 100.0%222224214Alfa Romeo Giulia30.0%n/a –130.0%– 18.8%227219215Polestar 330.0%new –30.0%new257 –216Citroen Spacetourer20.0%– 66.7% –140.0%– 44.0%223193217Jeep Renegade20.0%– 60.0% –180.0%– 5.3%215214218Alfa Romeo Tonale20.0%+ 0.0% –200.0%+ 122.2%209184219Subaru Solterra20.0%+ 0.0% –90.0%– 65.4%232195220BMW X420.0%+ 100.0%156150.0%– 16.7%220211221Ford Ecosport20.0%n/a153290.0%n/a196260222Fiat 500C20.0%n/a –60.0%n/a241 –223Citroen C120.0%n/a20.0%n/a267 –224Mercedes A Class10.0%– 95.0% –200.0%– 79.6%212153225MG HS10.0%– 94.4% –350.0%– 63.2%191151226Audi e-Tron GT10.0%– 93.3% –250.0%– 72.8%201156227Fiat 500X10.0%– 83.3% –360.0%+ 89.5%189207228Toyota Highlander10.0%– 80.0% –210.0%+ 23.5%208200229Porsche 911/Carrera10.0%– 80.0% –140.0%– 51.7%226189230Ford Transit Custom10.0%– 66.7% –40.0%– 95.3%248162231Mercedes G Class10.0%– 66.7% –10.0%– 85.7%273239232Land Rover Discovery10.0%n/a –110.0%– 35.3%229213233Alfa Romeo Stelvio10.0%n/a –100.0%– 60.0%231235234BMW X610.0%n/a –60.0%– 40.0%239231235Jaguar XF10.0%n/a –60.0%n/a242 –236Fiat Tipo10.0%n/a –50.0%– 84.8%244191237Subaru Forester10.0%n/a –40.0%– 33.3%250240238BMW Z410.0%n/a –30.0%n/a252 –239Mercedes EQV10.0%n/a –30.0%+ 0.0%254247240Peugeot Expert10.0%n/a15830.0%+ 50.0%255245241BMW 8 Series10.0%n/a –20.0%– 66.7%258237242Subaru Outback10.0%n/a –20.0%+ 0.0%266256243Lotus Electre10.0%new –10.0%new274 –244Honda HR-V10.0%n/a10.0%n/a275 –245Aston Martin Unidentified10.0%n/a10.0%n/a276 –
Source: SIMI


More Stories
The New EV Reality Why 2026 Will Look More Hybrid Than Electric
Ford’s eye-popping $19.5 billion EV write-down is not just a headline-grabber, it is a reminder that automakers build on long...
Serbia November 2025: Skoda Octavia now #1 YTD, Toyota Yaris Cross up to #2
The Toyota Yaris Cross is up to 2nd place in Serbia in November. CE Auto data indicates a Serbian new...
Albania November 2025: BYD monopolises Top 5, holds over 50% share
The BYD Yuan Up is the most popular vehicle in Albania in November. Thanks to our local partner CE Auto...
Moldova November 2025: Jetour X50 up to record third place
The Jetour X50 is up to #3 in Moldova in November. Based on data by our local partner CE Auto, the...
Bosnia & Herzegovina November 2025: Skoda Octavia and Fabia on top
The Skoda Octavia is by far the most popular vehicle in Bosnia & Herzegovina. Data by CE Auto shows a...
Montenegro November 2025: Toyota Yaris snaps up top spot
The Toyota Yaris holds 6.8% of the Montenegrin new car market in November. Based on data by our local partner...