
Indonesia June 2024: Toyota Kijang Innova back in charge, Tank and Haval land
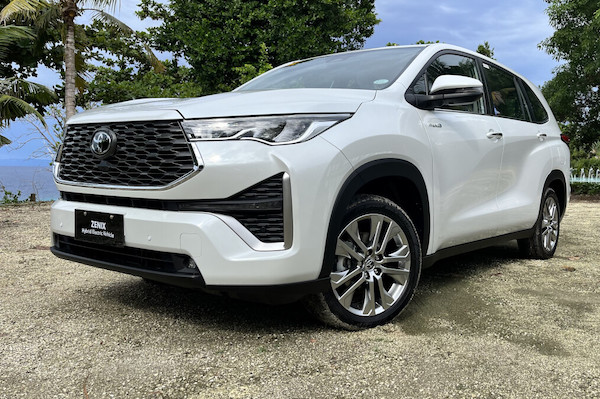
The Toyota Kijang Innova is the best-selling vehicle in Indonesia in June.
Wholesales of new vehicles in Indonesia drop -11.7% year-on-year in June to 72,936 leading to a H1 2024 result off -19.4% to 408,012. Retail sales for their part are down -12.3% to 70,198 with a H1 tally off -14% to 431,987.
In the wholesales brands ranking, Toyota (+2.7%) defies the surrounding gloom to grow to 34.9% share vs. 31.8% over H1. Daihatsu (-17.4%) and Honda (-34.1%) fall even faster than the market to round out the podium. Mitsubishi (+17.6%), Fuso (+6.1%) and Isuzu (+3.2%) are also up in the remainder of the Top 10. Wuling (-41.6%) is in big trouble at #10, followed by Chery (+68.9%), MG (+766.7%) and BMW (+28.7%) all in great shape. We welcome Tank at #26 and Haval at #29.
As for the retail charts, 9 of the Top 10 brands are in negative, the odd one out being Mitsubishi (+0.9%). Toyota (-8.1%), Daihatsu (-14.7%) and Honda (-27.1%) are on top while Suzuki (-26.3%) and Hyundai (-20.8%) are the hardest hit below.
The Toyota Kijang Innova (+23.1%) reclaims the models top spot for the first time this year and is now #2 year-to-date. The Daihatsu Gran Max Pikap (+41.4%) soars two spots on May to land at an outstanding 2nd place with 7.2% share vs. 5.4% year-to-date. #1 for the past five months, the Daihatsu Sigra (-14.1%) retrogrades to third place but easily keeps its YTD leadership with over 3,400 sales more than the Kijang Innova. The Toyota Avanza (+6.2%) drops one rank on May to #4 while the Honda Brio (-18%), in difficulty, rounds out the Top 5. The Toyota Hilux (+78.1%), Fortuner (+66.3%), Rush (+47.9%) and Agya (+41%) all shine below.
Previous month: Indonesia May 2024: Chery breaks into Top 10
One year ago: Indonesia June 2023: Daihatsu Sigra repeats at #1, Toyota Yaris Cross lands
Full June 2024 Top 33 All brands (wholesales and retail) and Top 160 All models (wholesales) below.
Indonesia June 2024 – brands (wholesales):
PosBrandJun-24%/23May2024%/23PosFY231Toyota25,46434.9%+ 2.7%1129,80231.8%– 19.0%112Daihatsu14,96720.5%– 17.4%285,43420.9%– 13.9%223Honda7,61810.4%– 34.1%347,58911.7%– 36.3%334Mitsubishi6,4708.9%+ 17.6%436,5609.0%– 7.0%455Suzuki4,5846.3%– 41.5%533,1338.1%– 19.8%546Isuzu3,0734.2%+ 3.2%714,0333.4%– 13.1%687Mitsubishi Fuso2,2303.1%+ 6.1%613,2233.2%– 22.7%778Hino2,0302.8%– 18.7%89,7352.4%– 30.7%999Hyundai1,9082.6%– 29.6%912,0443.0%– 34.6%8610Wuling9641.3%– 41.6%118,5182.1%– 12.6%101011Chery8481.2%+ 68.9%103,9391.0%+ 97.5%111412MG4680.6%+ 766.7%121,9500.5%+ 279.4%132013BMW 3990.5%+ 28.7%141,7830.4%– 5.1%141314Mazda3310.5%– 39.8%152,1070.5%– 21.3%121215Mercedes3100.4%– 40.7%161,6840.4%– 38.6%151116Citroen2860.4%new176190.2%new19 –17UD Trucks2160.3%+ 44.0%199630.2%+ 0.6%171618Lexus1880.3%– 30.6%131,5330.4%+ 30.8%161519Kia 1090.1%+ 45.3%206930.2%+ 4.8%181820Mini950.1%+ 120.9%234120.1%+ 19.1%222121Neta930.1%new291750.0%new262822FAW550.1%+ 83.3%183270.1%+ 24.3%232323Nissan530.1%– 54.3%225510.1%– 40.4%201724Dongfeng (DFSK)510.1%– 37.8%214730.1%– 38.7%211925Subaru410.1%– 51.8%242330.1%– 22.1%242426Tank320.0%new261150.0%new27 –27Scania230.0%– 69.3%251820.0%– 58.9%252228Seres140.0%new28740.0%new282929Haval90.0%new27350.0%new30 –30Volkswagen40.0%– 77.8%30500.0%– 65.3%292631Audi30.0%– 40.0%31150.0%– 28.6%323032Peugeot00.0%– 100.0% –270.0%– 78.4%312733Tata00.0%n/a –10.0%– 93.3%3331
Indonesia June 2024 – brands (retail):
PosBrandJun-24%/23May2024%/23PosFY231Toyota23,98734.2%– 8.1%1140,60832.5%– 10.3%112Daihatsu13,06518.6%– 14.7%289,37820.7%– 12.8%223Honda7,62510.9%– 27.1%351,68112.0%– 23.8%334Mitsubishi6,4629.2%+ 0.9%537,1098.6%– 14.2%455Suzuki5,0177.1%– 26.3%434,9448.1%– 15.3%546Isuzu2,5233.6%– 13.9%613,9453.2%– 10.1%687Mitsubishi Fuso2,3303.3%– 6.7%713,0323.0%– 24.9%778Hyundai2,3133.3%– 20.8%912,6362.9%– 30.6%869Wuling1,8002.6%– 7.0%811,1502.6%– 4.9%91010Hino1,7012.4%– 10.0%109,8872.3%– 22.3%10911Chery9201.3%+ 92.5%113,8870.9%+ 118.1%111412MG4680.7%+ 693.2%131,9260.4%+ 277.6%132013BMW 3650.5%+ 0.0%151,6790.4%– 2.0%151314Mazda3000.4%– 22.3%122,1830.5%– 3.0%121215Mercedes2770.4%– 40.0%161,7940.4%– 33.2%141116Lexus2370.3%+ 8.2%141,4940.3%+ 41.7%161517UD Trucks1490.2%– 5.7%187970.2%– 11.4%171618Mini1090.2%+ 98.2%234310.1%+ 26.8%212119Citroen1070.2%new222660.1%new24 –20Dongfeng (DFSK)1030.1%– 27.5%206480.2%– 21.2%191821Neta720.1%new –1560.0%new262822Kia 710.1%– 26.0%196670.2%– 24.4%181923FAW550.1%+ 83.3%173270.1%+ 24.3%222324Subaru510.1%+ 13.3%242760.1%+ 16.0%232425Tank 270.0%new261050.0%new27 –26Scania230.0%– 69.3%251820.0%– 58.9%252227Nissan170.0%– 88.3%215890.1%– 43.7%201728Volkswagen90.0%– 30.8%29610.0%– 49.6%282629Seres80.0%new27550.0%new293030Haval50.0%new28200.0%new32 –31Audi20.0%– 71.4%30140.0%– 50.0%332932Jeep00.0%– 100.0% –310.0%– 82.4%302533Peugeot00.0%– 100.0% –270.0%– 78.4%312734Tata00.0%– 100.0% –20.0%– 86.7%3431
Indonesia June 2024 – models (wholesales):
Note medium and heavy commercial vehicles are not included in this ranking.
PosModelJun-24%/23May2024%/23PosFY231Toyota Kijang Innova5,3927.4%+ 23.1%227,2526.7%+ 15.1%212Daihatsu Gran Max Pikap5,2467.2%+ 41.4%422,0175.4%– 11.6%563Daihatsu Sigra4,6056.3%– 14.1%130,6887.5%+ 1.7%134Toyota Avanza4,5016.2%+ 6.2%324,0315.9%– 20.5%425Honda Brio4,3506.0%– 18.0%525,0256.1%– 14.8%346Mitsubishi Xpander3,0594.2%+ 7.7%617,8634.4%– 19.1%787Toyota Calya2,9024.0%– 29.2%718,1094.4%– 21.1%658Toyota Rush2,5683.5%+ 47.9%916,4574.0%– 15.9%899Suzuki Carry Pikap2,3063.2%– 43.4%815,1153.7%– 34.1%9710Toyota Agya2,3023.2%+ 41.0%109,8332.4%– 13.5%101311Toyota Hilux1,9112.6%+ 78.1%256,2521.5%– 51.8%191612Toyota Veloz1,5342.1%– 20.3%266,5971.6%– 43.9%171413Toyota Fortuner1,5282.1%+ 66.3%136,6811.6%– 18.8%162114Honda HR-V1,3421.8%+ 16.1%158,2512.0%– 44.6%121015Toyota Raize1,2621.7%– 19.7%165,5841.4%– 36.7%221816Hyundai Stargazer1,1871.6%+ 43.7%236,7521.7%– 10.1%151917Daihatsu Terios1,1321.6%– 53.6%119,7292.4%– 13.8%111118Mitsubishi L-300 Pikap1,0221.4%+ 27.8%125,6981.4%– 17.6%212319Isuzu Traga PHR1,0181.4%+ 0.0%244,9911.2%– 14.1%252620Mitsubishi Pajero Sport1,0071.4%+ 4.4%176,8111.7%– 8.7%142421Daihatsu Ayla9981.4%– 68.9%148,0382.0%– 43.8%131222Honda WR-V9541.3%– 59.2%185,4121.3%– 52.9%241523Mitsubishi L200 Triton9401.3%+ 4.4%283,7890.9%+ 23.2%272824Daihatsu Xenia8141.1%– 35.4%226,3381.6%– 18.9%182225Daihatsu Gran Max Minibus7901.1%– 42.1%194,7361.2%– 14.2%262526Honda BR-V7211.0%– 64.3%205,7811.4%– 54.8%201727Suzuki XL76971.0%– 60.8%215,5191.4%– 11.1%232028Chery OMODA E55960.8%new272,6420.6%new31 –29Toyota Hiace5290.7%+ 59.3%431,8870.5%– 3.4%373730Wuling Cloud4980.7%new321,5470.4%new40 –31Daihatsu Rocky4830.7%+ 24.5%351,9500.5%– 30.5%353532Mitsubishi Xforce4420.6%new302,3690.6%new334733Suzuki Ertiga4400.6%– 8.1%313,6660.9%– 35.0%282734Toyota Yaris Cross3850.5%– 71.1%292,4750.6%+ 85.8%323035Hyundai Creta3760.5%– 22.5%423,2340.8%– 33.3%302936Toyota Alphard3610.5%– 32.1%371,8970.5%– 21.3%363937MG 43250.4%new361,2550.3%new4313938Suzuki Baleno3180.4%+ 13.6%331,6100.4%+ 34.1%394439Daihatsu Luxio2700.4%– 26.6%391,2460.3%– 37.5%444240Suzuki Alpha2700.4%new341,7920.4%new38 –41Suzuki APV Minibus2090.3%– 51.2%401,4030.3%– 11.7%424042Citroen C3 Aircross SUV1850.3%new473610.1%new66 –43Hyundai Ioniq 51730.2%– 80.1%616850.2%– 80.7%553144Wuling Air1710.2%– 18.6%511,0480.3%– 36.7%463445Suzuki Jimny1410.2%+ 135.0%581,0770.3%+ 128.7%456446Suzuki Grand Vitara1390.2%– 46.7%411,0440.3%+ 46.8%475247BMW 3 Series1390.2%+ 414.8%524370.1%+ 45.7%616848Mazda CX-31150.2%+ 57.5%535770.1%– 54.5%575049Chery Tiggo 5X1130.2%new1111720.0%new83 –50Honda CR-V1110.2%+ 6.7%382,2680.6%– 16.1%343651Mazda CX-51030.1%– 71.5%487760.2%– 1.0%535152Citroen C31010.1%new782580.1%new73 –53Hyundai Palisade1000.1%– 77.0%469730.2%– 47.8%484554Toyota Land Cruiser 3001000.1%+ 20.5%547790.2%+ 335.2%526155Lexus LM950.1%+ 4650.0%448160.2%+ 318.5%517456Neta V930.1%new1071750.0%new8211357Wuling Confero S850.1%– 86.4%566030.1%– 76.1%563358Chery OMODA 5840.1%– 79.8%508230.2%– 44.2%504359BMW X1810.1%n/a592960.1%+ 29500.0%729360Isuzu D-Max730.1%– 66.5% –2050.1%– 79.0%795361Wuling Binguo730.1%new803,6150.9%new295662Wuling Alvez720.1%– 85.3%557280.2%– 77.5%543263Toyota Vellfire710.1%+ 20.3%1152100.1%– 7.5%7710464Isuzu MU-X700.1%+ 233.3% –700.0%– 47.8%1159265Lexus RX670.1%– 59.4%495730.1%– 16.8%586066Mini Countryman650.1%+ 261.1%752030.0%+ 34.4%809967Suzuki S-Presso640.1%– 79.9%451,5400.4%– 1.1%413868Hyundai Santa Fe640.1%– 21.0%683240.1%– 42.9%706269MG ZS630.1%+ 472.7%1103210.1%+ 89.9%718770Honda Mobilio600.1%– 1.6% –4210.1%– 50.1%625471Honda Civic590.1%– 35.9%634480.1%– 23.0%605872MG VS HEV500.1%new691450.0%new91 –73Kia Sonet470.1%– 20.3%623760.1%+ 15.0%636774BMW X3460.1%+ 39.4%811970.0%– 35.0%818275Mazda3420.1%+ 740.0%673540.1%+ 420.6%677076Kia Carnival400.1%n/a153510.0%– 29.2%12112477BMW IX370.1%+ 5.7%128920.0%– 48.3%1056978Mazda CX-30340.0%– 12.8%721680.0%+ 6.3%859679Tank 500320.0%new821150.0%new97 –80Mercedes S-Class310.0%+ 82.4%118510.0%– 56.8%12211581BMW X5300.0%– 50.8%842380.1%– 12.8%757182Daihatsu Sirion300.0%+ 200.0%94900.0%– 79.5%1067883Mini Cooper290.0%+ 16.0%931500.0%– 15.7%877584Wuling Formo280.0%– 78.8%703290.1%– 69.0%694885Toyota Corolla270.0%– 20.6%114780.0%– 71.4%1107786Dongfeng Gelora260.0%– 13.3%76970.0%– 34.0%1009587Lexus LX250.0%+ 4.2%92950.0%+ 93.9%10212688Dongfeng Mini Truck240.0%+ 0.0%653650.1%– 29.0%656689Chery Tiggo 8230.0%new104550.0% ne118 –90Wuling Almaz220.0%– 80.4%954930.1%– 35.0%594991Mercedes GLA210.0%+ 200.0%1121440.0%– 23.0%9310592Toyota Vios200.0%– 60.0%96840.0%– 71.7%1077693Nissan Livina200.0%– 39.4%1021450.0%– 65.9%927294Toyota Camry190.0%– 83.9%891030.0%– 84.3%997995MG 5 GT190.0%– 34.5%1061360.0%– 37.9%948196Mercedes A-Class180.0%– 41.9%105940.0%– 13.0%10310697Mazda CX-60180.0%new109790.0%new10913198Subaru Forester160.0%+ 128.6%120550.0%+ 89.7%11915799Chery GT160.0%new881280.0%new96118100Wuling Cortez150.0%– 81.3%1391500.0%– 70.6%8863101Mercedes GLE150.0%– 67.4%742080.1%+ 54.1%7891102Nissan Magnite150.0%+ 15.4%1031090.0%+ 26.7%9897103Kia Carens150.0%+ 200.0%831530.0%– 8.9%8694104Mercedes C-Class140.0%– 74.5%642550.1%– 41.2%7465105BMW 2 Series140.0%– 65.0%711300.0%+ 19.3%95100106Seres E502140.0%new101740.0%new111135107Toyota Yaris130.0%– 87.9%662350.1%– 78.0%7655108Subaru Crosstrek130.0%– 71.7%79740.0%– 9.8%112117109Chery Tiggo 7 Pro130.0%– 61.8%97720.0%– 65.6%11486110Toyota bZ4X120.0%– 72.7%158160.0%– 89.7%15383111Honda Accord110.0%– 81.7%901460.0%– 38.9%9085112MG HS110.0%– 21.4%113930.0%– 13.9%104112113BMW i7110.0%new85840.0%new108125114BMW i5110.0%new77410.0%new129 –115Honda City100.0%– 97.3%1163350.1%– 80.1%6841116Mercedes GLS100.0%– 28.6%133170.0%– 79.8%152134117Nissan Terra100.0%+ 11.1%129510.0%– 25.0%123130118Mercedes CLA100.0%+ 42.9%132240.0%– 45.5%143142119Mercedes GLC90.0%– 60.9%731480.0%+ 322.9%8988120Haval H690.0%new99350.0%new137 –121Toyota Voxy80.0%– 96.9%578630.2%– 18.0%4946122BMW 5 Series80.0%– 73.3% –230.0%– 90.5%14590123Mercedes GLB80.0%– 61.9%87390.0%– 53.6%131137124Nissan Kicks80.0%– 27.3%123690.0%– 21.6%116123125Mazda CX-880.0%n/a –460.0%– 41.8%126102126Lexus NX70.0%– 82.1%130330.0%– 63.7%139103127BMW X770.0%– 61.1%144550.0%– 17.9%120133128Kia EV970.0%new91960.0%new101156129Hyundai Ioniq 660.0%new152200.0%new148101130Toyota Corolla Cross50.0%– 97.7%121380.0%– 95.5%13359131Subaru WRX50.0%– 79.2%124380.0%– 43.3%134129132Mazda CX-950.0%– 44.4%145280.0%– 71.7%140119133Subaru BRZ50.0%– 37.5%142400.0%– 63.3%130116134Mercedes Sprinter50.0%n/a –220.0%n/a146155135Mercedes CLE50.0%new155130.0%new157 –136VW Tiguan40.0%– 69.2%134420.0%– 66.4%127110137BMW Z440.0%– 63.6%119380.0%– 49.3%135140138Mercedes V-Class40.0%+ 33.3%122250.0%– 26.5%142151139Chery Tiggo 8 Pro30.0%– 94.3%151470.0%– 84.8%12573140Mazda230.0%– 91.4%126420.0%– 64.7%128109141BMW 4 Series30.0%– 91.4% –70.0%– 97.0%16489142Lexus ES30.0%– 90.3%108220.0%– 78.8%147111143BMW 7 Series30.0%n/a100740.0%+ 1750.0%113122144BMW X630.0%n/a86380.0%#DIV/0!136161145Mercedes GLC Coupe30.0%n/a –60.0%– 50.0%166169146Mercedes E-Class20.0%– 95.9% –190.0%– 93.8%14980147Hyundai Staria20.0%– 83.3%117510.0%– 38.6%124121148BMW X420.0%– 81.8% –60.0%– 86.7%167148149Toyota GR 8620.0%– 77.8%125390.0%– 26.4%132132150Mazda MX-520.0%– 60.0%141240.0%+ 84.6%144146151Mercedes EQE20.0%– 50.0%136100.0%– 54.5%159153152Toyota Supra20.0%– 50.0% –50.0%+ 0.0%170170153Lexus UX20.0%– 33.3% –20.0%– 94.3%177159154Audi Q320.0%+ 100.0% –20.0%– 33.3%176181155Subaru Outback20.0%n/a143260.0%n/a141158156Mazda610.0%– 95.7%131160.0%– 80.0%154128157Mercedes G-Class10.0%– 88.9%13890.0%– 84.7%162141158Dongfeng Glory 56010.0%– 80.0%135110.0%– 64.5%158138159Mini Clubman10.0%n/a127590.0%+ 247.1%117144160Audi Q510.0%n/a –30.0%– 25.0%172185
Source: GAIKINDO

More Stories
The New EV Reality Why 2026 Will Look More Hybrid Than Electric
Ford’s eye-popping $19.5 billion EV write-down is not just a headline-grabber, it is a reminder that automakers build on long...
Serbia November 2025: Skoda Octavia now #1 YTD, Toyota Yaris Cross up to #2
The Toyota Yaris Cross is up to 2nd place in Serbia in November. CE Auto data indicates a Serbian new...
Albania November 2025: BYD monopolises Top 5, holds over 50% share
The BYD Yuan Up is the most popular vehicle in Albania in November. Thanks to our local partner CE Auto...
Moldova November 2025: Jetour X50 up to record third place
The Jetour X50 is up to #3 in Moldova in November. Based on data by our local partner CE Auto, the...
Bosnia & Herzegovina November 2025: Skoda Octavia and Fabia on top
The Skoda Octavia is by far the most popular vehicle in Bosnia & Herzegovina. Data by CE Auto shows a...
Montenegro November 2025: Toyota Yaris snaps up top spot
The Toyota Yaris holds 6.8% of the Montenegrin new car market in November. Based on data by our local partner...