
Portugal June 2024: Citroen C3 and Tesla Model Y top negative market
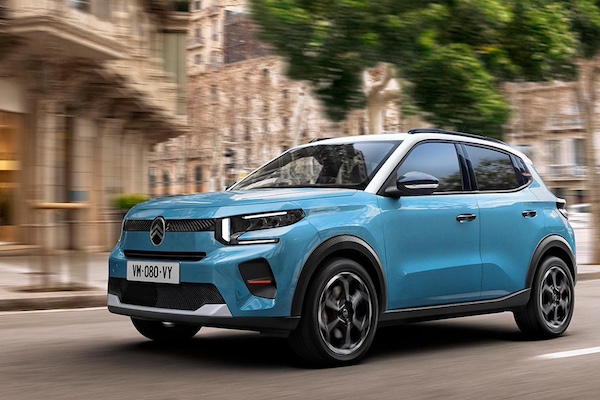
Citroen C3 sales are up 6-fold year-on-year. Next generation pictured.
20,193 new cars found a buyer in Portugal in June, a steep -8.4% year-on-year decline. The H1 2024 tally stands at 116,417, up 5.7% on the same period in 2023. Peugeot (-43.6%) stays on top of the brands charts despite a debilitating loss and holds 8.7% of the market vs. 9.9% over H1. Citroen (+19%) surges six spots on May to end the month in 2nd place with 7.2% share. Mercedes (+6.9%) is only 8 sales below and ascends to the third spot YTD. Volkswagen (-3.9%) keeps its fall below the market rate unlike Dacia (-13.1%). Tesla (+42.1%) is the only additional Top 10 member to show a positive year-on-year result. Further down, Volvo (+66.7%), Hyundai (+39.3%), Skoda (+33.8%) and Cupra (+146.5%) stand out. Finally notice BYD (+830.8%) up to #22 and outselling MG (+102.9%).
Rushed sales of the outgoing generation before new safety regulations are put in place in early July push the Citroen up 6-fold year-on-year (+503.1%) to snap its first pole position since April 2022. It ranks #5 year-to-date with sales up 147% vs. #13 over the Full Year 2023. The Tesla Model Y (+96.4%) is down one spot on last month to a still very impressive 2nd place, a ranking it also holds year-to-date vs. #7 over FY2023. The Dacia Sandero (+67.9%) stays at #3 and holds onto its YTD pole position. The Peugeot 308 (+22.4%) is up 20 ranks on May to #4 with the Peugeot 2008 (-67.6%) in great difficulty at #5. The VW Taigo (+43.1%) and Seat Ibiza (+0.2%) are the only additional gainers inside the Top 10, ranking #9 and #7 respectively.
Previous month: Portugal May 2024: Tesla Model Y best-seller for the 2nd time ever
One year ago: Portugal June 2023: Peugeot and 2008 in control
Full June 2024 Top 45 All brands and Top 297 All models below.
Portugal June 2024 – brands:
PosBrandJun-24%/23May2024%/23PosFY231Peugeot1,7528.7%– 43.6%111,5639.9%– 10.5%112Citroen1,4597.2%+ 19.0%87,1806.2%+ 40.0%593Mercedes1,4517.2%+ 6.9%28,6387.4%+ 22.7%334Volkswagen1,3606.7%– 3.9%36,3835.5%– 15.6%765Dacia1,3396.6%– 13.1%68,6287.4%+ 12.8%446Tesla1,2256.1%+ 42.1%95,4704.7%+ 33.2%987Renault1,1815.8%– 36.9%48,6487.4%– 8.6%228BMW1,1175.5%– 12.9%56,9946.0%– 0.7%659Seat9724.8%– 13.1%104,4133.8%– 12.6%111010Toyota8224.1%– 30.2%76,0995.2%+ 2.8%8711Volvo8154.0%+ 66.7%123,7813.2%+ 50.8%141712Kia7663.8%– 18.6%134,4843.9%+ 21.8%101313Hyundai7163.5%+ 39.3%113,7213.2%+ 15.1%151214Opel6153.0%– 45.5%153,8173.3%– 20.5%131115Skoda5352.6%+ 33.8%172,3642.0%+ 16.9%191916Cupra4932.4%+ 146.5%211,2541.1%+ 5.4%212017Nissan4792.4%– 16.7%164,3793.8%+ 17.6%121518Mitsubishi4782.4%+ 25.1%202,1641.9%+ 56.5%202119Audi4532.2%– 23.9%142,6052.2%+ 1.2%171820Fiat4332.1%+ 14.9%183,4933.0%+ 15.1%161621Ford3601.8%– 30.9%192,3972.1%– 36.5%181422BYD2421.2%+ 830.8%239570.8%+ 1328.4%243223MG2091.0%+ 102.9%221,0840.9%+ 95.0%232624Mini1500.7%– 2.6%247970.7%– 16.5%252225Porsche1210.6%+ 77.9%276480.6%+ 30.6%262826Jeep1130.6%+ 56.9%251,1311.0%+ 80.4%222327Land Rover800.4%+ 2.6%285420.5%– 18.7%282528Honda790.4%+ 79.5%264200.4%+ 102.9%292929Lexus600.3%+ 25.0%313040.3%+ 19.7%333130Smart590.3%+ 1080.0%303100.3%+ 126.3%323331Alfa Romeo580.3%– 30.1%293140.3%+ 5.7%313032Mazda570.3%– 36.7%323320.3%– 55.4%302433Polestar430.2%+ 95.5%361090.1%– 23.2%353534Suzuki350.2%+ 45.8%341620.1%+ 1.9%343435DS320.2%– 68.3%336050.5%– 7.4%272736Jaguar110.1%– 38.9%35830.1%– 48.8%363637Aston Martin60.0%+ 100.0%38300.0%+ 20.0%373838Lamborghini40.0%n/a –190.0%+ 58.3%414439Ferrari30.0%+ 50.0%39200.0%+ 0.0%384241Man30.0%+ 50.0% –50.0%– 72.2%434340Bentley20.0%– 50.0%37190.0%– 29.6%393742Ssangyong20.0%new –20.0%new51 –43Maserati10.0%– 50.0%41180.0%– 35.7%403944Lotus10.0%+ 0.0% –20.0%+ 100.0%495045Rolls Royce10.0%+ 0.0% –20.0%+ 100.0%5053
Portugal June 2024 – models:
PosModelJun-24%/23May2024%/23PosFY231Citroen C39654.8%+ 503.1%53,4583.0%+ 147.0%5132Tesla Model 38824.4%+ 96.4%13,9313.4%+ 183.8%273Dacia Sandero8804.4%+ 67.9%34,6194.0%+ 53.4%124Peugeot 3085572.8%+ 22.4%242,6062.2%+ 32.7%8115Peugeot 20085012.5%– 67.6%43,8303.3%– 17.3%316Renault Clio4952.5%– 37.9%23,8123.3%+ 10.3%447Seat Ibiza4862.4%+ 0.2%72,0811.8%+ 6.3%11148Peugeot 2084152.1%– 43.8%63,1262.7%– 11.8%639VW Taigo3721.8%+ 43.1%411,0710.9%– 6.5%293610Mercedes A-Class3491.7%– 26.2%231,8471.6%– 20.6%12811Tesla Model Y3421.7%– 16.6%281,5141.3%– 41.6%19512Hyundai i203361.7%+ 1360.9%151,3231.1%+ 114.4%213913Opel Corsa3181.6%– 44.8%121,8421.6%– 24.6%13914Mitsubishi Space Star3181.6%+ 63.1%859170.8%+ 3.6%335415Renault Captur3071.5%– 29.3%102,7862.4%– 11.0%7616Toyota Yaris Cross3031.5%+ 138.6%91,8391.6%+ 54.3%142417Seat Arona2981.5%– 11.8%221,2551.1%– 44.6%251518Nissan Juke2981.5%+ 78.4%172,2852.0%+ 162.3%93219Volvo EX302961.5%new211,1391.0%new2729720Dacia Jogger2811.4%– 43.5%112,1841.9%+ 13.1%101021BMW 1 Series2671.3%+ 25.4%181,3581.2%– 9.6%201922Cupra Leon2591.3%+ 640.0%964270.4%+ 427.2%7513023Volvo XC402491.2%– 17.8%341,1331.0%– 14.6%281824Kia Stonic2341.2%+ 48.1%451,6041.4%+ 57.4%172825VW T-Cross2251.1%– 15.7%301,0540.9%– 18.2%303726Fiat Tipo2031.0%+ 3.6%1742990.3%– 69.2%944827Citroen C3 Aircross2021.0%– 56.1%371,3111.1%+ 8.9%242928VW T-Roc1931.0%+ 47.3%81,3171.1%– 18.5%232529Skoda Octavia1870.9%+ 120.0%468080.7%+ 151.7%436030Skoda Kamiq1870.9%+ 192.2%315810.5%+ 30.9%606931Toyota Yaris1820.9%– 49.9%161,3201.1%– 20.0%222032Ford Focus1770.9%– 11.1%351,0100.9%– 36.7%312333BMW X11640.8%+ 127.8%388970.8%+ 193.1%356434BMW 2 Series1590.8%– 61.6%278370.7%– 41.2%412135Citroen C41490.7%– 51.3%449010.8%– 16.5%343036Nissan Qashqai1460.7%– 49.1%251,8191.6%– 5.4%151737Kia Picanto1460.7%+ 180.8%525270.5%+ 22.0%658338Mercedes GLA1450.7%+ 150.0%477000.6%+ 66.3%505539MG41430.7%+ 308.6%536510.6%+ 235.6%5210840Peugeot 30081400.7%– 25.9%297470.6%– 53.8%462241Volvo V601380.7%+ 475.0%326080.5%+ 193.7%5512042Dacia Duster1330.7%– 68.0%191,5971.4%– 18.4%181243Seat Leon1330.7%– 26.9%677590.7%+ 123.2%445044Mercedes E-Class1300.6%+ 170.8%269940.9%+ 217.6%328445Cupra Born1270.6%+ 296.9%1242940.3%– 4.2%976846Fiat 5001260.6%+ 51.8%331,6261.4%+ 4.3%161647VW Multivan1260.6%+ 447.8%554280.4%+ 422.0%7415448Audi A31220.6%– 21.3%138370.7%+ 13.6%404449Mercedes C-Class1190.6%+ 17.8%408790.8%+ 33.6%363350Hyundai Kauai1160.6%– 55.6%427490.6%– 24.8%453151Mercedes CLA1160.6%+ 0.9%545850.5%– 0.5%594952Opel Astra1080.5%+ 107.7%667210.6%+ 12.7%485353Cupra Formentor1070.5%– 19.5%515330.5%– 33.5%634354Kia Xceed1060.5%– 24.3%366060.5%+ 13.1%564555Opel Mokka1050.5%– 59.3%578170.7%– 8.7%424056BYD Atto 31040.5%+ 511.8%1023440.3%+ 616.7%8712557Hyundai Tucson1000.5%– 19.4%495670.5%– 11.4%625158BMW i41000.5%– 17.4%587270.6%+ 3.6%472759Mitsubishi ASX940.5%– 31.4%765200.4%+ 52.9%678260Audi Q4920.5%+ 22.7%654090.4%+ 14.9%798161Volvo XC60900.4%– 1.1%396420.6%+ 29.7%545862Mercedes EQA900.4%+ 15.4%685290.5%+ 50.7%646563Toyota C-HR890.4%– 51.1%616480.6%– 37.2%533564Mercedes EQE890.4%– 36.9%834130.4%+ 7.8%776165BYD Seal880.4%new893590.3%new8431066VW ID.4870.4%– 24.3%1172550.2%– 30.9%1087367VW Polo850.4%– 50.9%148540.7%+ 5.8%395668Kia Sportage810.4%+ 5.2%435990.5%+ 46.5%586269Kia Niro790.4%+ 58.0%863430.3%+ 104.2%8810470Mini780.4%– 12.4%944460.4%– 16.0%715271Peugeot 408780.4%+ 90.2%803920.3%+ 103.1%8111672Fiat Panda770.4%– 12.5%201,2521.1%+ 221.9%265773VW ID.3760.4%+ 13.4%1012610.2%– 53.6%1056374Jeep Avenger760.4%+ 375.0%738710.7%+ 1513.0%3710375Audi A1720.4%– 50.3%1272100.2%– 44.6%1209276Kia Ceed720.4%– 4.0%774970.4%+ 137.8%699477Ford Puma700.3%– 64.6%488640.7%– 17.5%382678Toyota Corolla700.3%– 51.0%595760.5%– 29.0%614679BMW 3 Series690.3%– 32.4%507050.6%– 28.6%493480Renault Megane E-Tech680.3%– 35.2%1283290.3%– 52.2%894181Mini Countryman680.3%+ 23.6%873110.3%– 17.1%937682BMW 5 Series670.3%+ 4.7%645090.4%+ 0.4%687083VW Golf640.3%– 47.1%743580.3%– 8.4%857784Renault Zoe640.3%+ 392.3%1451280.1%+ 70.7%14915585Toyota Aygo X610.3%– 57.9%696010.5%+ 31.8%578086Hyundai i30610.3%+ 510.0%912180.2%+ 47.3%11711287Audi Q3590.3%+ 145.8%723620.3%+ 67.6%8311088Honda HR-V580.3%+ 222.2%902560.2%+ 265.7%10714289Mitsubishi Colt580.3%new936560.6%new5122390Mercedes Vito Tourer550.3%new1722070.2%new122 –91Citroen C5 Aircross540.3%– 57.1%1163940.3%– 0.8%808592Mercedes GLC540.3%+ 184.2%624590.4%+ 68.7%707593BMW iX1540.3%new634110.4%new7810694Toyota RAV4520.3%– 1.9%604390.4%+ 91.7%729695Alfa Romeo Tonale490.2%– 37.2%812630.2%– 6.4%10211196Seat Tarraco470.2%+ 6.8%1361450.1%+ 48.0%14014197Porsche Cayenne Coupe470.2%+ 1075.0%1202390.2%+ 129.8%11115698Audi Q2460.2%– 6.1%1062780.2%+ 9.4%9911399MG ZS460.2%+ 12.2%952680.2%+ 90.1%101133100Skoda Scala450.2%– 55.0%1101790.2%– 61.2%13188101Mercedes GLC Coupe450.2%+ 40.6%983490.3%+ 19.1%8678102BMW X3440.2%– 29.0%842970.3%+ 17.9%9690103Opel Grandland430.2%+ 0.0%1091830.2%– 34.4%126119104BMW i5430.2%new1042880.2%new98176105Renault Scenic E-Tech430.2%new169710.1%new181 –106Ford Kuga420.2%+ 61.5%1111480.1%– 60.8%13997107Mercedes V-Class410.2%+ 51.9%752190.2%+ 180.8%115157108Renault Megane400.2%– 64.6%565250.5%– 36.7%6638109Hyundai i10400.2%+ 344.4%922430.2%+ 80.0%110118110Polestar 2390.2%+ 77.3%1981050.1%– 26.1%159132111VW Kombi390.2%+ 85.7%1311100.1%+ 168.3%157215112Citroen C4 X380.2%new1382470.2%new109209113Opel Crossland370.2%– 79.3%1621600.1%– 67.1%13471114Hyundai Bayon360.2%– 42.9%794180.4%– 23.7%7642115Mercedes EQB350.2%+ 6.1%882610.2%+ 48.3%103122116Ford Transit350.2%+ 40.0%1221310.1%+ 40.9%148171117BMW iX2350.2%new1051500.1%new138322118Skoda Superb340.2%– 17.1%1321030.1%– 14.9%161161119Mercedes GLE340.2%+ 100.0%1121520.1%+ 153.3%137152120Renault Arkana330.2%– 83.2%1392150.2%– 64.8%11879121Mercedes GLB330.2%– 46.8%703170.3%+ 23.3%91107122Audi Q8320.2%– 52.9%993170.3%+ 65.1%9074123Kia EV6320.2%– 3.0%1211790.2%+ 94.6%130146124Range Rover Evoque310.2%+ 29.2%1081820.2%– 29.5%127117125Renault Trafic290.1%– 32.6%712350.2%+ 128.2%112148126Porsche 911290.1%+ 61.1%1261800.2%+ 53.8%129137127Peugeot 508290.1%+ 61.1%1581390.1%– 34.4%143115128Mercedes CLE290.1%new1511160.1%new154254129BYD Seal U290.1%new289300.0%new223 –130Smart #1280.1%+ 2700.0%1072150.2%#######119172131Smart #3280.1%new140900.1%new167 –132Dacia Spring270.1%– 74.0%1542100.2%– 72.0%12147133Peugeot 5008270.1%– 72.7%823670.3%– 36.7%8259134Lexus NX270.1%+ 28.6%1421520.1%+ 25.6%136147135Citroen e-C4260.1%– 72.6%1232570.2%– 54.8%10672136Renault Austral260.1%– 61.2%1132610.2%– 25.6%10467137VW ID.5260.1%– 43.5%168930.1%– 72.1%16687138Jeep Compass260.1%– 23.5%1571930.2%– 49.1%12491139Lexus LBX260.1%new137850.1%new169 –140BMW iX250.1%– 72.5%1251920.2%– 55.5%125101141Toyota bZ4X240.1%– 76.9%1351340.1%– 58.1%14593142Skoda Kodiaq240.1%– 4.0%1412980.3%+ 41.2%95109143BMW X2240.1%+ 71.4%152800.1%– 64.4%171134144Renault Master230.1%– 66.7%249400.0%– 52.9%215195145Toyota Corolla Cross230.1%+ 76.9%782750.2%+ 205.6%100164146Volvo C40220.1%– 24.1%1671190.1%– 59.5%153100147Nissan Ariya220.1%+ 120.0%130990.1%– 49.2%163139148Hyundai Ioniq 5220.1%n/a1181390.1%+ 195.7%142179149Skoda Karoq210.1%+ 16.7%195560.0%– 34.1%192190150BMW 4 Series200.1%– 57.4%1291610.1%– 38.1%133105151Skoda Fabia200.1%– 51.2%1002230.2%– 17.4%114102152Mercedes B-Class200.1%– 37.5%1151350.1%– 19.2%144123153Porsche Panamera200.1%+ 81.8%263500.0%+ 19.0%198216154Audi A6190.1%– 32.1%160780.1%– 33.9%173153155VW Caddy190.1%+ 5.6%1591280.1%+ 120.7%150192156VW Tiguan180.1%– 66.0%1141400.1%– 60.9%14186157Mazda2180.1%– 25.0%1641080.1%– 48.3%158126158Citroen e-C4 X180.1%+ 500.0%260700.1%– 42.6%182168159Suzuki Swift180.1%n/a171660.1%+ 88.6%187221160Dacia Logan180.1%n/a –180.0%n/a250 –161Skoda Enyaq170.1%– 34.6%1701160.1%+ 5.5%155138162BYD Dolphin170.1%new1331990.2%new123226163Ford Tourneo Courier170.1%new196480.0%new201 –164Renault Rafale170.1%new269280.0%new227 –165Range Rover Sport150.1%+ 25.0%1551260.1%+ 14.5%151140166VW Passat150.1%+ 66.7%181450.0%– 57.5%206186167Mercedes Sprinter150.1%n/a186680.1%+ 44.7%185189168DS 7140.1%– 70.2%1832290.2%– 13.9%113114169Volvo XC90140.1%– 53.3%143970.1%– 12.6%164151170Ford Mustang (incl. Mach E)140.1%– 17.6%165950.1%– 48.9%165127171Fiat 500X140.1%+ 75.0%1901330.1%+ 64.2%147128172Renault Twingo130.1%– 31.6%134780.1%– 27.8%174166173BMW X5130.1%+ 18.2%1461330.1%+ 155.8%146165174Renault Espace130.1%+ 30.0%210550.0%+ 358.3%193246175Fiat 600130.1%new1841800.2%new128294176Mazda MX-30120.1%– 45.5%235340.0%– 78.5%220129177Porsche Macan120.1%+ 33.3%1501040.1%+ 2.0%160177178Range Rover Velar120.1%+ 140.0%207450.0%+ 28.6%205219179Mazda CX-5110.1%– 45.0%161630.1%– 26.7%188182180Land Rover Defender110.1%+ 37.5%194560.0%+ 16.7%191202181Toyota Proace City Verso110.1%+ 57.1%233530.0%+ 35.9%194220182Kia EV9110.1%new185720.1%new179230183Jeep Renegade100.0%– 23.1%176590.1%– 64.2%189136184Suzuki Vitara100.0%– 16.7%236270.0%– 15.6%232218185Mercedes G-Class100.0%+ 42.9%266260.0%+ 0.0%234225186Mercedes S-Class100.0%+ 66.7%149680.1%+ 21.4%184204187Seat Ateca80.0%– 88.4%971730.1%– 55.3%13299188Mitsubishi Eclipse Cross80.0%– 84.0%193710.1%– 55.1%180135189DS 480.0%– 82.6%1562180.2%– 29.9%11695190Nissan X-Trail80.0%– 81.8%1471010.1%– 44.8%162131191MG EHS80.0%– 63.6%1631110.1%– 12.6%156160192BMW iX380.0%– 60.0%175750.1%– 52.8%175121193Honda Jazz80.0%– 60.0%148700.1%+ 0.0%183181194BMW 7 Series80.0%– 46.7%200430.0%– 6.5%209217195Jaguar E-Pace80.0%– 33.3%187580.0%– 22.7%190175196Mazda CX-6080.0%– 20.0%199480.0%– 37.7%202193197Renault Kangoo80.0%+ 300.0%103810.1%+ 1925.0%170214198DS 380.0%n/a1731560.1%+ 766.7%135194199Porsche Taycan70.0%– 69.6%214270.0%– 75.2%231144200Toyota Proace Verso70.0%– 61.1%1441240.1%+ 59.0%152143201Range Rover 70.0%+ 40.0%191880.1%– 28.5%168163202Mercedes GLE Coupe70.0%+ 40.0%197730.1%+ 40.4%178167203Audi Q560.0%– 76.0%205430.0%– 42.7%208178204Mercedes EQS60.0%– 73.9%222460.0%– 54.9%203162205MG Marvel R60.0%+ 20.0%206390.0%– 41.8%216203206BMW XM60.0%n/a202220.0%+ 1000.0%243280207MG360.0%new232120.0%new263 –208Nissan Leaf50.0%– 92.5%209750.1%– 75.3%17689209Honda CR-V50.0%+ 66.7%177520.0%+ 48.6%196232210Alfa Romeo Stelvio50.0%+ 66.7%220270.0%+ 237.5%229277211Citroen C5 X40.0%– 87.9%188510.0%– 61.7%197150212Land Rover Discovery Sport40.0%– 83.3%261450.0%– 51.6%204184213Mini Clubman40.0%– 60.0%217400.0%– 18.4%214205214Kia Sorento40.0%– 50.0%216440.0%+ 76.0%207229215Suzuki S-Cross40.0%– 42.9%228170.0%– 69.6%252212216Mazda MX-540.0%+ 0.0%189380.0%– 35.6%217206217BMW X740.0%+ 33.3%227170.0%+ 0.0%251238218Alfa Romeo Giulia40.0%+ 100.0%213240.0%+ 200.0%237263219Mercedes GLS40.0%+ 300.0%219300.0%+ 25.0%224245220Mercedes Citan Tourer40.0%new179430.0%new211 –221Polestar 340.0%new40.0%new298 –222Mercedes Citan30.0%– 82.4%248250.0%– 71.3%235170223VW ID.Buzz30.0%– 70.0%246280.0%– 67.1%228187224Volvo V9030.0%– 66.7%211290.0%– 45.3%225197225Audi A430.0%– 62.5%234350.0%– 20.5%219201226Suzuki Ignis30.0%– 40.0%204500.0%+ 42.9%199222227Hyundai Santa Fe30.0%– 40.0%180410.0%– 18.0%212207228Jaguar F-Pace30.0%– 25.0%225180.0%– 18.2%248248229Smart Fortwo30.0%– 25.0% –40.0%– 97.0%296149230VW Crafter30.0%+ 0.0%250200.0%– 35.5%246227231BYD Han30.0%+ 0.0%267160.0%+ 100.0%253265232Honda Civic30.0%+ 0.0%273100.0%– 66.7%268241233Man TGE30.0%+ 50.0% –50.0%– 72.2%290261234Porsche Cayman30.0%+ 200.0%239160.0%+ 77.8%254267235VW Touareg30.0%+ 200.0%25790.0%+ 125.0%276296236VW ID.730.0%new192670.1%new186332237Honda ZR-V30.0%new208220.0%new244275238Peugeot Expert30.0%n/a237180.0%+ 1700.0%249330239Aston Martin DBX30.0%n/a –100.0%– 16.7%267273240Lamborghini Huracan30.0%n/a –100.0%+ 900.0%270315241BMW X420.0%– 90.0%201320.0%– 63.2%222191242Citroen Berlingo20.0%– 89.5%1824340.4%+ 201.4%73276243Hyundai Ioniq 620.0%– 89.5%221230.0%– 54.0%241196244Opel Zafira Life20.0%– 88.9% –250.0%– 51.0%236198245Peugeot e-Rifter20.0%– 84.6%2593160.3%+ 378.8%92199246Ford Tourneo/Transit Custom20.0%– 84.6%178430.0%– 50.0%210158247Lexus UX20.0%– 84.6%218280.0%– 61.1%226210248Mazda CX-3020.0%– 75.0%212260.0%– 76.4%233180249Ford Tourneo/Transit Connect20.0%– 71.4%166490.0%– 14.0%200188250Mercedes AMG GT20.0%– 60.0%268150.0%– 31.8%257253251BMW 8 Series20.0%– 50.0%25580.0%– 61.9%277257252Mazda320.0%+ 0.0% –150.0%– 67.4%256228253Mercedes CLS20.0%+ 0.0%271110.0%– 15.4%266274254Lexus ES20.0%+ 0.0%27580.0%– 71.4%280250255DS 920.0%+ 100.0% –20.0%– 77.8%326270256Audi e-Tron20.0%n/a –70.0%– 94.7%285185257Honda e:Ny120.0%new231100.0%new269271258Porsche 71820.0%n/a27680.0%n/a282323259Renault Symbioz20.0%new20.0%new327 –260Ssangyong Torres20.0%new20.0%new312 –261Volvo EC4020.0%new20.0%new329 –262VW Arteon10.0%– 98.4%119740.1%– 59.8%177124263Mercedes Vito10.0%– 97.7%262400.0%– 72.6%213159264VW Up!10.0%– 96.0%203530.0%– 36.9%195173265Citroen Spacetourer10.0%– 95.0%244330.0%– 5.7%221231266BMW i710.0%– 88.9%264220.0%+ 10.0%242239267Jeep Wrangler10.0%– 88.9%27480.0%– 72.4%278234268VW Touran10.0%– 87.5%252130.0%– 35.0%261242269Kia ProCeed10.0%– 85.7% –130.0%– 60.6%258236270Lexus RZ10.0%– 83.3%226150.0%+ 7.1%255252271Lexus RX10.0%– 83.3%229120.0%– 36.8%262235272BYD Tang EV10.0%– 83.3%25490.0%– 18.2%274269273Mercedes SL-Class10.0%– 83.3% –80.0%– 81.8%281224274Tesla Model S10.0%– 66.7% –120.0%– 81.0%264213275Porsche Boxster10.0%– 50.0%224240.0%+ 84.6%239266276Opel Combo10.0%– 50.0% –40.0%+ 0.0%295291277Bentley Flying Spur10.0%– 50.0% –30.0%– 50.0%302286278Bentley Bentayga10.0%+ 0.0%25390.0%+ 0.0%273272279Mercedes eVito10.0%+ 0.0%27850.0%– 44.4%291240280Aston Martin Vantage10.0%+ 0.0% –20.0%– 71.4%311282281BMW X610.0%n/a215190.0%– 5.0%247244282BMW Z410.0%n/a270110.0%– 31.3%265256284Opel Movano10.0%n/a245270.0%+ 2600.0%230255285Mercedes e-Citan Tourer10.0%new27290.0%new275 –286Lamborghini Urus10.0%n/a –80.0%– 27.3%279284287Aston Martin DB1210.0%new24170.0%new284348288Aston Martin DB12 Volante10.0%new27760.0%new287 –289Ferrari 296 GTB10.0%n/a –30.0%+ 200.0%303343290Ferrari Purosangue10.0%new28530.0%new304351291Ferrari 812 Competizione10.0%n/a –20.0%+ 100.0%314333292Lexus LM10.0%new –20.0%new319 –293Lotus Eletre10.0%new –20.0%new320 –294Ford Explorer10.0%n/a –10.0%– 66.7%351319295Maserati Quattroporte10.0%n/a –10.0%n/a352 –296Rolls-Royce Spectre10.0%new10.0%new353 –297Volvo EX4010.0%new10.0%new354 –
Source: ACAP

More Stories
5 Reasons to Hire a Personal Injury Lawyer for Your Case
New York City hit a massive safety milestone in 2025 with just 205 traffic fatalities, which is the lowest since...
Bentley’s First Electric SUV Could Arrive With Bentayga Pricing and Big Expectations
Bentley is stepping into the EV era carefully, but not timidly. The brand’s first fully electric SUV is shaping up...
Next-Gen Nissan Rogue Will Go Hybrid First as e-Power Takes Center Stage
Nissan is making a pretty bold call with the next-generation Rogue, and honestly, it feels like the kind of move...
Why a Missing Front Plate Can Lead to More Than Just a Traffic Ticket
Many car enthusiasts spent thousands of dollars on the specific aesthetics of their vehicles, from custom paint jobs to aerodynamic...
Hill Yeah! Suzuki is back in action at the Simola Hillclimb
Suzuki is back for the 16th annual Simola Hillclimb, bringing a fresh three-year sponsorship deal and a media-led fleet of...
Future Jeep Grand Cherokee SRT Render Brings Back V8 Performance Talk
A digital proposal for a faster fifth generation Jeep Grand Cherokee surfaced online through Instagram creator @kelsonik, where a regular...