Europe May 2024: Toyota (+8.3%), Skoda (+7.1%) highlight negative market
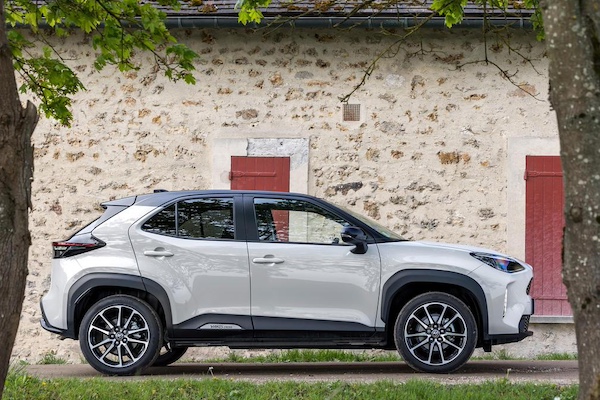
Toyota Yaris Cross
Preliminary data from ACEA shows a European new car market (EU+EFTA+UK) off -2.6% year-on-year to 1,092,901 units. The year-to-date tally remains in positive however at +4.6% to 5,569,024. Among the main 5 markets, Spain (+3.4%) and the UK (+1.7%) gain ground whereas France (-2.9%), Germany (-4.3%) and Italy (-6.6%) skid. The best performing markets are Croatia (+19%), Romania (+14.7%), Poland (+13.2%), Greece (+6.2%), Hungary (+5.7%), Lithuania (+5.5%) and Denmark (+4%). Reversely Cyprus (-24%), Norway (-23.2%), Iceland (-22.1%), Finland (-17.5%) and Estonia (-16.8%) struggle mightily. Year-to-date, all major 5 markets are up, with the UK at +7.1%, Spain at +6.8%, Germany at +5.2%, France at +4.9% and Italy at +3.4%. Bulgaria (+37%), Croatia (+15%), Cyprus (+12.9%), Greece (+12.1%) and Malta (+11%) shine whereas Iceland (-38.2%), Estonia (-15.3%) and Norway (-14.2%) sink.
BEV sales drop significantly faster than the market at -10.8% and 151,968 units for a 13.9% share vs. 15.2% a year ago in May 2023. 29,708 BEVs were registered in Germany (-30.6%) for a 12.6% share, 26,031 in the UK (+6.2%) for a 17.6% share, 23,892 in France (+5.4%) for a 16.9% share, 10,418 in Belgium (+44.8%) for a 26.8% share, 9,681 in the Netherlands (-11.7%) for a 34.1% share and 7,893 in Norway (-26.7%) for a 77% share. Year-to-date, BEVs are up 2.1% to 745,269 and 13.4% share vs. 13.7% over the same period a year ago. The largest markets for BEVs are Germany at 140,13 (-15.9%), the UK at 133,062 (+9.7%), France at 128,565 (+22.9%) and Belgium at 50,690 (+47.1%). For May, PHEV sales are off -9.6% to 73,757 and 6.7% share vs. 7.3% a year ago, HEVs are up 15.4% to 332,772 and 30.4% share vs. 25.7%, petrol sales drop -6.3% to 384,753 and 35.2% share vs. 36.6% and diesel skids -11.4% to 126,445 and 11.6% share vs. 12.7%.
The Volkswagen Group (+1.8%) ignores the market slump to rise to 27.1% share vs. 25.5% so far this year. In contrast Stellantis (-8.7%) is hit hard. Renault-Nissan-Mitsubishi (-1.5%) contains its loss while Hyundai-Kia (-4.9%) loses share year-on-year. The Toyota Group (+8.2%) impresses. Brand-wise, Volkswagen (+0.9%) edges up to over 120,000 sales, keeping its YTD tally in positive also (+0.9%). Toyota (+8.3%) manages the largest gain in the Top 13 and consolidates its 2nd place overall with more than 75,000 units sold for the month. YTD Toyota sales are up a splendid 15.1%. BMW (-7%) is down on a particularly high year-ago base and cements its third position YTD. Skoda (+7.1%), Hyundai (+2.8%), Renault (+1.2%) and Mercedes (+0.2%) are also up in the remainder of the Top 10 whereas Peugeot (-13.2%), Kia (-11.7%) and Audi (-10.1%) sink. Further down, Land Rover (+27.5%), Volvo (+26.4%) and Seat (+21.1%) stand out.
Previous month: Europe April 2024: Volvo, Toyota, Suzuki shine in market up 12%
One year ago: Europe May 2023: BMW up to #2, Audi and Renault impress in market up 18.2%, Sandero #1
Full May 2024 Top 10 groups and Top 30 brands below.
Europe May 2024 – groups (Source ACEA):
PosGroupMay-24/23Apr2024/23PosFY231Volkswagen Group296,446+ 1.8%11,420,858+ 3.2%112Stellantis173,969– 8.7%2938,744+ 0.5%223Renault-Nissan-Mitsubishi133,042– 1.5%3706,568+ 8.2%334Hyundai-Kia92,196– 4.9%4461,758– 1.5%445Toyota Group81,175+ 8.2%5427,918+ 16.3%566BMW Group74,318– 12.7%6384,202+ 6.2%657Mercedes55,412+ 0.2%7282,529– 0.4%778Ford Motor35,272– 21.6%8188,021– 16.4%889Volvo34,101+ 26.4%9160,145+ 35.5%91010SAIC Motor20,992+ 5.2%n/a97,251+ 21.6%11n/a
Europe May 2024 – brands (Source ACEA):
PosBrandMay-24/23Apr2024/23PosFY231Volkswagen120,141+ 0.9%1567,839+ 0.9%112Toyota75,031+ 8.3%2399,094+ 15.1%223BMW64,923– 7.0%3326,682+ 13.6%344Renault 62,565+ 1.2%5282,174+ 2.9%665Skoda62,372+ 7.1%4311,216+ 11.4%476Audi59,096– 10.1%6279,466– 8.1%737Peugeot53,447– 13.2%8288,554– 1.3%588Mercedes53,127+ 0.2%7272,002– 0.5%859Hyundai46,697+ 2.8%10228,365+ 4.4%111110Kia45,499– 11.7%11233,393– 6.7%10911Dacia43,647– 9.0%9245,293+ 2.5%91012Opel/Vauxhall37,463– 7.8%16190,560– 2.0%121313Ford 35,272– 21.6%12188,021– 16.4%131214Volvo34,101+ 26.4%13160,145+ 35.5%151815Citroën32,521+ 7.6%15180,214+ 11.9%141516Fiat27,766– 12.6%17158,678– 4.2%161417Seat25,162+ 21.1%14121,169+ 10.3%181918Nissan21,706+ 3.5%18146,497+ 19.7%171719MG20,992+ 5.2%2097,251+ 21.6%202020Cupra 20,324+ 14.6%2187,281+ 20.4%222121Tesla19,108– 35.9%22119,533– 13.7%191622Suzuki17,001+ 6.5%1993,546+ 27.1%212223Mazda15,385+ 13.4%2374,313– 2.7%232424Jeep11,384+ 2.0%2658,647+ 12.6%242525Land Rover10,806+ 27.5%2557,303+ 14.0%262626Mini9,395– 38.6%2757,519– 22.3%252327Porsche8,567+ 0.2%2450,140+ 14.4%272728Lexus6,144+ 7.3%2828,824+ 35.1%302929Honda5,220+ 40.0%2935,237+ 48.0%282830Mitsubishi4,766+ 25.0%n/a30,871+ 97.5%29n/a
Source: ACEA


