
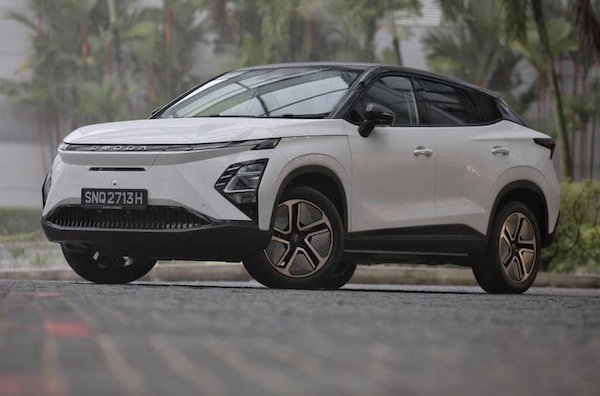
Indonesia May 2024: Chery breaks into Top 10
Chery is now among Indonesia’s 10 best-selling brands.
Wholesales in Indonesia lose -13.2% year-on-year in May to 71,263 units, leading to a year-to-date tally off -20.9% to 334,969. For their part retail sales are off -12.6% to 72,137 for the month and -14.4% year-to-date to 361,698. In the wholesales brands ranking, Toyota (-16.7%) retains the top spot with a strong 33% market share above Daihatsu (-6.4%) at 21% and Honda (-34.6%) at 10.2%. Mitsubishi (+22%) defies the negative market to land in fourth place, overtaking Suzuki (-9.6%). Mitsubishi Fuso (+25.7%) and Isuzu (+4.4%) also shine. After ranking #11 for four consecutive months, Chery (+82.3%) breaks into the Top 10 for the first time at #10, dislodging fellow Chinese fare Wuling (-57.1%).
Retail-wise, there are no gainers in the Top 10. Toyota (-6.7%) leads the way with 33.4% of the market above Daihatsu (-5.6%) and Honda (-31.5%). Isuzu (-5.2%) and Mitsubishi Fuso (-7.6%) resist well.
Over in the models charts (wholesales), the Daihatsu Sigra (+2.2%) confirms it is now the favourite in Indonesian hearts, lodging a 5th consecutive monthly win. The Toyota Kijang Innova (+12.5%) is very solid at #2 but remains #3 year-to-date. The Toyota Avanza (-4.7%) rounds out the podium ahead of the Daihatsu Gran Max Pikap (-1.8%) and the Honda Brio (-7.2%). Excellent performance by the Mitsubishi Xpander (+18.9%) at #6.
Previous month: Indonesia April 2024: Daihatsu Sigra and Toyota Rush on top, Wuling Cloud lands
One year ago: Indonesia May 2023: Daihatsu Sigra best-seller, sales rally up 66%
Full May 2024 Top 30 All brands wholesales and retail and Top 156 All models wholesales below.
Indonesia May 2024 – brands (wholesales):
PosBrandMay-24%/23Apr2024%/23PosFY231Toyota23,48233.0%– 16.7%1104,33831.1%– 23.0%112Daihatsu14,98321.0%– 6.4%270,46721.0%– 13.1%223Honda7,29410.2%– 34.6%439,97111.9%– 36.7%334Mitsubishi6,9769.8%+ 22.0%530,0919.0%– 10.9%455Suzuki5,7628.1%– 9.6%328,5498.5%– 14.7%546Mitsubishi Fuso2,4113.4%+ 25.7%610,9933.3%– 26.7%677Isuzu2,2653.2%+ 4.4%710,9603.3%– 16.8%788Hino1,8482.6%– 27.6%97,7052.3%– 33.2%999Hyundai1,4082.0%– 53.5%810,1363.0%– 35.5%8610Chery9681.4%+ 82.3%113,0910.9%+ 107.2%111411Wuling9091.3%– 57.1%107,5542.3%– 6.6%101012MG4380.6%+ 553.7%131,4820.4%+ 222.2%132013Lexus4150.6%+ 18.6%141,3450.4%+ 49.3%161514BMW 4000.6%– 3.6%151,3840.4%– 11.8%141315Mazda3810.5%+ 37.1%121,7760.5%– 16.5%121216Mercedes3320.5%– 12.4%161,3780.4%– 38.0%151117Citroen1970.3%n/a253330.1%n/a21 –18FAW1750.2%+ 548.1%242720.1%+ 16.7%232319UD Trucks1690.2%+ 15.8%177470.2%– 7.4%171620Kia 1070.2%– 35.2%185840.2%– 0.3%181821Dongfeng (DFSK)870.1%– 32.6%214220.1%– 38.8%201922Nissan620.1%– 59.2%194980.1%– 38.4%191723Mini610.1%– 32.2%203170.1%+ 4.6%222124Subaru520.1%– 3.7%221920.1%– 10.3%242425Scania450.1%– 47.1%231590.0%– 56.8%252226Seres160.0%new27600.0%new272927Neta130.0%new –820.0%new262828Volkswagen50.0%– 61.5%26460.0%– 63.5%282629Audi20.0%+ 0.0%29110.0%– 31.3%303030Peugeot00.0%– 100.0%28270.0%– 75.7%2927
Indonesia May 2024 – brands (retail):
PosBrandMay-24%/23Apr2024%/23PosFY231Toyota24,07433.4%– 6.7%1116,62132.2%– 10.8%112Daihatsu14,74720.4%– 5.6%276,31321.1%– 12.5%223Honda7,80510.8%– 31.5%344,05612.2%– 23.2%334Suzuki6,1108.5%– 11.0%529,9278.3%– 13.1%545Mitsubishi5,8328.1%– 19.4%430,6478.5%– 16.8%456Isuzu2,5143.5%– 5.2%711,2763.1%– 10.3%687Mitsubishi Fuso2,3103.2%– 7.6%610,7023.0%– 27.9%778Wuling2,0012.8%– 16.6%89,3502.6%– 4.5%9109Hyundai1,8032.5%– 42.3%910,3232.9%– 32.5%8610Hino1,4222.0%– 22.5%108,1862.3%– 24.4%10911Chery9011.2%+ 102.5%112,9670.8%+ 127.5%111412Mazda4510.6%+ 10.5%131,8830.5%+ 1.0%121213MG4200.6%+ 491.5%121,4580.4%+ 223.3%142014Lexus3330.5%– 8.0%151,2640.3%+ 51.4%161515BMW 3170.4%– 9.4%161,3140.4%– 2.5%151316Mercedes2460.3%– 56.1%141,5110.4%– 32.1%131117FAW1750.2%+ 548.1%242720.1%+ 16.7%222318UD Trucks1510.2%– 0.7%176460.2%– 12.9%171619Kia 1060.1%– 25.9%205960.2%– 24.2%181920Dongfeng (DFSK)870.1%– 36.5%185450.2%– 19.9%201821Nissan760.1%– 59.4%195720.2%– 36.5%191722Citroen720.1%n/a251590.0%n/a25 –23Mini590.1%– 21.3%213220.1%+ 13.0%212124Subaru550.1%+ 14.6%222250.1%+ 16.6%232425Scania450.1%– 47.1%231590.0%– 56.8%242226Seres140.0%new28470.0%new283027Volkswagen90.0%– 30.8%27520.0%– 51.9%272628Audi20.0%– 71.4%30110.0%– 47.6%312929Neta00.0%new26840.0%new262830Jeep00.0%– 100.0% –310.0%– 81.1%2925
Indonesia May 2024 – models (wholesales):
Note: Medium and heavy vehicles are included in the wholesales brands ranking but not in the models ranking.
PosModelMay-24%/23Apr2024%/23PosFY231Daihatsu Sigra5,4677.7%+ 2.2%126,0837.8%+ 5.1%132Toyota Kijang Innova5,3827.6%+ 12.5%321,8606.5%+ 13.3%313Toyota Avanza5,0277.1%– 4.7%419,5305.8%– 24.8%424Daihatsu Gran Max Pikap4,3756.1%– 1.8%816,7715.0%– 20.8%565Honda Brio3,5835.0%– 7.2%620,6756.2%– 14.1%246Mitsubishi Xpander3,3014.6%+ 18.9%914,8044.4%– 23.0%787Toyota Calya3,1284.4%– 20.7%715,2074.5%– 19.3%658Suzuki Carry Pikap2,5843.6%– 24.2%512,8093.8%– 32.1%979Toyota Rush2,4363.4%– 12.9%213,8894.1%– 22.1%8910Toyota Agya1,6712.3%– 39.9%137,5312.2%– 22.6%111311Daihatsu Terios1,3041.8%– 6.5%118,5972.6%– 2.8%101112Mitsubishi L-300 Pikap1,2561.8%+ 18.8%184,6761.4%– 23.5%232313Toyota Fortuner1,2241.7%– 0.4%385,1531.5%– 29.5%192114Daihatsu Ayla1,2201.7%– 45.9%107,0402.1%– 36.6%121215Honda HR-V1,2161.7%– 3.3%256,9092.1%– 49.8%131016Toyota Raize1,2101.7%– 1.9%234,3221.3%– 40.3%251817Mitsubishi Pajero Sport1,1311.6%+ 24.8%155,8041.7%– 10.7%152418Honda WR-V1,1211.6%– 54.8%214,4581.3%– 51.3%241519Daihatsu Gran Max Minibus1,0131.4%+ 11.9%273,9461.2%– 5.1%272520Honda BR-V9871.4%– 60.5%165,0601.5%– 53.0%181721Suzuki XL79751.4%+ 98.6%194,8221.4%+ 8.8%202022Daihatsu Xenia9441.3%– 12.3%175,5241.6%– 15.8%162223Hyundai Stargazer8671.2%– 10.7%145,5651.7%– 16.7%141924Isuzu Traga PHR8631.2%+ 19.9%223,9731.2%– 17.1%262625Toyota Hilux8591.2%– 59.7%124,3411.3%– 63.6%221626Toyota Veloz7601.1%– 51.2%355,0631.5%– 48.5%171427Chery OMODA E57551.1%new302,0460.6%new35 –28Mitsubishi L200 Triton6851.0%– 30.1%202,8490.9%+ 30.9%302829Toyota Yaris Cross6520.9%new362,0900.6%new323030Mitsubishi Xforce6020.8%new291,9270.6%new334731Suzuki Ertiga5280.7%– 46.1%283,2261.0%– 37.4%282732Wuling Cloud4520.6%new241,0490.3%new48 –33Suzuki Baleno4450.6%+ 62.4%371,2920.4%+ 40.3%414434Suzuki Alpha3840.5%new321,5220.5%new37 –35Daihatsu Rocky3810.5%+ 46.5%411,4670.4%– 39.3%393536MG 43600.5%new439300.3%new5013937Toyota Alphard3020.4%– 54.6%261,5360.5%– 18.2%363938Honda CR-V2990.4%– 32.7%332,1570.6%– 17.0%313639Daihatsu Luxio2810.4%– 1.1%559760.3%– 40.0%454240Suzuki APV Minibus2450.3%– 34.1%401,1940.4%+ 2.8%404041Suzuki Grand Vitara2410.3%– 46.4%539050.3%+ 101.1%475242Hyundai Creta2360.3%– 59.3%342,8580.9%– 34.4%292943Toyota Hiace2320.3%– 52.4%421,3580.4%– 16.2%383744Lexus LM2250.3%+ 57.3%507210.2%+ 273.6%547445Suzuki S-Presso1840.3%+ 20.3%391,4760.4%+ 19.1%343846Hyundai Palisade1830.3%– 57.4%458730.3%– 39.0%464547Citroen C3 Aircross SUV1670.2%new1161760.1%new147 –48Mazda CX-51590.2%+ 736.8%496730.2%+ 59.1%535149Lexus RX1510.2%– 5.0%545060.2%– 3.4%596050Chery OMODA 51480.2%– 69.0%567390.2%– 30.3%494351Wuling Air1450.2%– 68.1%688770.3%– 39.3%443452BMW 3 Series1200.2%+ 200.0%802980.1%+ 9.2%726853Mazda CX-31120.2%– 44.3%524620.1%– 61.3%605054Toyota Land Cruiser 3001120.2%+ 115.4%486790.2%+ 607.3%516155Wuling Alvez1110.2%– 89.1%586560.2%– 76.2%523256Wuling Confero S1080.2%– 74.8%665180.2%– 72.6%573357Toyota Voxy1060.1%– 71.1%468550.3%+ 7.7%434658Suzuki Jimny1020.1%+ 8.5%449360.3%+ 127.7%426459BMW X1790.1%n/a702150.1%+ 21400.0%769360Suzuki Ignis740.1%– 51.6%573690.1%– 43.2%635761Hyundai Ioniq 5660.1%– 92.8%655120.2%– 80.8%563162Kia Sonet580.1%– 46.8%673290.1%+ 22.8%656763Honda Civic560.1%– 53.3%623890.1%– 20.6%615864Mercedes C-Class550.1%– 47.1%732410.1%– 36.4%706565Toyota Yaris510.1%– 77.9%872220.1%– 76.9%735566Dongfeng Mini Truck510.1%+ 4.1%723410.1%– 30.4%646667Mazda3460.1%+ 187.5%593120.1%+ 395.2%667068Hyundai Santa Fe450.1%– 62.5%612600.1%– 46.5%696269MG VS HEV420.1%new64950.0%new100 –70Wuling Formo410.1%– 43.8%993010.1%– 67.6%674871BMW 2 Series400.1%+ 48.1%921160.0%+ 68.1%9310072Mazda CX-30380.1%+ 1166.7%751340.0%+ 12.6%909673Mercedes GLE330.0%+ 106.3%761930.1%+ 116.9%749174Mini Countryman330.0%+ 135.7%811380.0%+ 3.8%879975Mercedes GLC330.0%+ 200.0%691390.0%+ 1058.3%868876Dongfeng Gelora320.0%+ 28.0%128710.0%– 39.3%1169577Citroen C3300.0%new1251570.0%new80 –78BMW i5300.0%new –300.0%new –79Subaru Crosstrek290.0%+ 38.1%121610.0%+ 69.4%12211780Wuling Binguo290.0%new313,5421.1%new215681BMW X3280.0%– 40.4%821510.0%– 44.1%818282Kia Carens260.0%– 31.6%791380.0%– 15.3%849483BMW X5250.0%– 30.6%772080.1%– 1.9%717184Mercedes GLB240.0%+ 41.2% –310.0%– 50.8%15413785BMW i7240.0%new94730.0%new10412586BMW X6240.0%n/a –350.0%n/a14316187Toyota Camry230.0%– 88.0%101840.0%– 84.4%987988Chery GT230.0%new1121120.0%new9111889Honda Accord220.0%– 37.1%971350.0%– 24.6%828590Kia EV9220.0%new113890.0%new9615691Mini Cooper210.0%– 69.1%831210.0%– 20.9%897592Lexus LX210.0%+ 600.0%90700.0%+ 180.0%10312693Daihatsu Sirion200.0%– 33.3%85600.0%– 86.0%1137894Wuling Almaz190.0%– 75.3%1174710.1%– 27.2%554995Toyota Vios180.0%– 67.3%95640.0%– 74.1%1087696Nissan Serena170.0%– 43.3%741690.1%+ 3.7%758497Chery Tiggo 7 Pro170.0%– 19.0%103590.0%– 66.3%1128698BMW 7 Series160.0%n/a93710.0%+ 1675.0%9912299Seres E502160.0%new134600.0%new110135100Nissan Livina150.0%– 64.3%861250.0%– 68.1%8572101Nissan Magnite150.0%+ 7.1%104940.0%+ 28.8%9297102MG 5 GT130.0%– 43.5%881170.0%– 38.4%8881103Mercedes A-Class130.0%– 31.6%84760.0%– 1.3%97106104Neta V130.0%new –820.0%new95113105Chery Tiggo 8130.0%new91320.0%new132 –106Lexus ES120.0%– 45.5%124190.0%– 74.0%152111107MG ZS120.0%– 42.9%602580.1%+ 63.3%6887108Mazda CX-60120.0%new100610.0%new105131109Toyota Vellfire110.0%– 87.4%631390.0%– 17.3%79104110Toyota Corolla110.0%– 62.1%98510.0%– 78.7%11477111MG HS110.0%– 52.2%89820.0%– 12.8%94112112Mercedes GLA110.0%+ 10.0%781230.0%– 31.7%83105113Chery Tiggo 5X110.0%new71590.0%new107 –114Honda City100.0%– 97.0%1083250.1%– 75.4%6241115Mercedes S-Class100.0%– 9.1% –200.0%– 80.2%146115116Hyundai Staria100.0%+ 0.0%115490.0%– 31.0%115121117Toyota Corolla Cross90.0%– 94.0%119330.0%– 94.7%12859118BMW Z490.0%– 57.1%109340.0%– 46.9%126140119Subaru Forester90.0%+ 80.0%118390.0%+ 77.3%124157120Nissan Kicks80.0%– 78.4%114610.0%– 20.8%101123121Toyota GR 8680.0%– 57.9%110370.0%– 15.9%125132122Subaru WRX80.0%– 55.6%132330.0%– 23.3%127129123Mercedes V-Class80.0%– 11.1%138210.0%– 32.3%141151124Mini Clubman70.0%– 12.5%106580.0%+ 241.2%102144125Mazda270.0%+ 600.0%131390.0%– 53.6%123109126BMW IX60.0%– 90.0%102550.0%– 61.5%10669127Nissan Terra60.0%– 68.4%127410.0%– 30.5%118130128Lexus NX50.0%– 75.0% –260.0%– 50.0%131103129Mercedes GLS50.0%– 75.0%14570.0%– 90.0%169134130VW Tiguan50.0%– 61.5%122380.0%– 66.1%120110131Mazda650.0%+ 150.0%144150.0%– 73.7%145128132Mercedes CLA50.0%+ 400.0% –140.0%– 62.2%148142133Wuling Cortez40.0%– 93.7%1201350.0%– 68.6%7863134Mercedes EQE40.0%– 77.8%14980.0%– 55.6%158153135Mercedes G-Class40.0%– 76.5% –80.0%– 84.0%161141136Dongfeng Glory 56040.0%n/a –100.0%– 61.5%157138137Mercedes EQS SUV40.0%new –60.0%new174175138BMW i430.0%– 78.6%129180.0%– 37.9%138150139Subaru BRZ30.0%– 70.0%123350.0%– 65.3%121116140Subaru Outback30.0%n/a139240.0%n/a130158141Mazda MX-530.0%n/a105220.0%+ 175.0%133146142Mercedes EQS20.0%– 81.8%142100.0%– 71.4%149149143Mazda CX-920.0%– 75.0%130230.0%– 74.4%129119144BMW X720.0%+ 0.0%133480.0%– 2.0%109133145Mercedes EQA20.0%new –100.0%new151165146Toyota bZ4X10.0%– 97.9%15140.0%– 96.4%16483147Chery Tiggo 8 Pro10.0%– 97.0%136440.0%– 82.9%11173148Nissan Leaf10.0%– 90.0% –50.0%– 88.9%162145149Hyundai Ioniq 610.0%new141140.0%new142101150Kia Carnival10.0%n/a111110.0%– 84.7%144124151Mercedes CLE10.0%new –80.0%new153 –152Mitsubishi L100 EV10.0%new14870.0%new155 –153Audi A510.0%n/a –30.0%– 40.0%170179154Audi Q810.0%n/a –30.0%+ 50.0%172174155Lexus LC10.0%n/a –20.0%n/a178187156BMW XM10.0%new –10.0%new185172
Source: GAIKINDO

More Stories
Montenegro November 2025: Toyota Yaris snaps up top spot
The Toyota Yaris holds 6.8% of the Montenegrin new car market in November. Based on data by our local partner...
North Macedonia November 2025: Skoda Kamiq and Octavia now equal #1 YTD
The Skoda Kamiq easily wins November in North Macedonia. Data shared with us by our local partner CE Auto, new...
Is the GT1R Front Drag Pack the Ultimate Upgrade for Your Nissan GT-R?
If you are a car enthusiast, you know the feeling. You press the gas pedal, the engine roars, and you...
Uruguay November 2025: Chevrolet repeats at #1 with 15.2% share
Chevrolet holds 15.2% of the Uruguayan market in November. New light vehicle sales in Uruguay are off -1.1% year-on-year in...
How Mechanical Design Influences the Feel of a Vehicle
You know that feeling. You slide into the driver’s seat. You press the start button. The vehicle comes alive. It...
Competition Time. Chance to win a Smallest Cog goodies bundle.
The Smallest Cog Unveils Exciting New Merchandise Range Inspired by Richard Hammond’s iconic restoration workshop, The Smallest Cog’s exclusive new...