
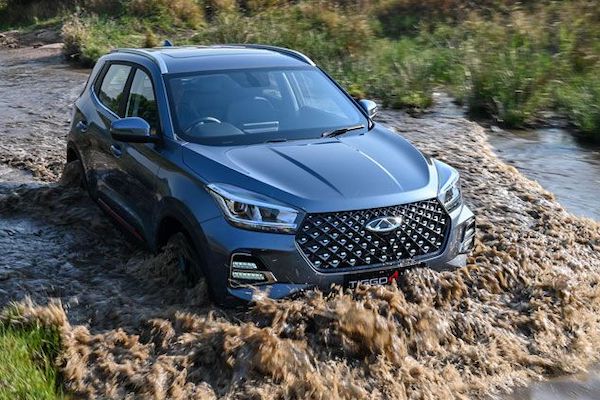
South Africa May 2024: Chery (+32.9%) shines in 9th market decline in past 10 months
The Chery Tiggo 4 Pro ranks #8 overall in South Africa in May.
After lodging its first year-on-year gain in 9 months in April, the South African new vehicle market is back in negative in May at -14.2% to 37,105 units, potentially due to the national elections. The year-to-date tally is now off -6% to 205,965. Toyota (-22.8%) easily retains the brands pole position with 23.7% share and despite a steep year-on-year decline. The Volkswagen Group (-6.1%) is back above Suzuki (+10.6%) in 2nd place with Ford (+14.8%) also in great shape. Hyundai (-20.4%) struggles and rounds out the Top 5. Chery (+32.9%) also shines at #7.
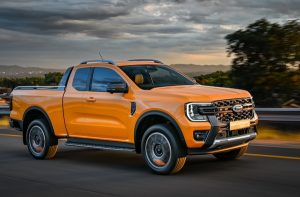
The Toyota Hilux (-15.4%) remains the best-selling vehicle in the country with 6.4% share, in line with the 6.5% it commands year-to-date. The podium is unchanged on last month with the Ford Ranger (+5.3%) in second place and the VW Polo Vivo (-3.1%) in third. The Toyota Corolla Cross (-6.1%) and Isuzu D-Max (-17.6%) follow as they also do year-to-date. The Chery Tiggo 4 Pro (+47.8%) secures by far the largest gain in the Top 10 and ends the month at #8 like in April. Notice also the Toyota Land Cruiser 70 (+21.8%) up to #16 and the new Suzuki Fronx up 24 spots on April to a record #17.
Previous month: South Africa April 2024: First market lift in 9 months, Omoda C5 and Jaecoo J7 land in Top 50
One year ago: South Africa May 2023: Toyota (+71%) catches up on low year-ago volumes, market up 10.1%
Full May 2024 Top 38 All manufacturers and Top 50 models below.
South Africa May 2024 – manufacturers:
PosManufacturerMay-24%/23Apr2024%/23PosFY231Toyota8,79523.7%– 22.8%150,82424.7%– 12.8%112Volkswagen Group4,93913.3%– 6.1%325,77112.5%– 2.4%223Suzuki4,10111.1%+ 10.6%223,78311.5%+ 20.5%334Ford2,8607.7%+ 14.8%413,0356.3%+ 4.7%455Hyundai2,1855.9%– 20.4%511,4525.6%– 14.5%646Isuzu1,6264.4%– 13.1%79,4644.6%– 1.2%777Chery1,6094.3%+ 32.9%68,0783.9%+ 22.4%8118Nissan1,5224.1%– 34.2%912,0145.8%– 8.3%569GWM (incl. Haval)1,2053.2%– 35.8%87,3813.6%– 11.6%9910Renault1,1103.0%– 39.9%106,4453.1%– 31.7%10811BMW Group1,0682.9%– 13.0%115,3822.6%– 13.3%121212Kia1,0032.7%– 39.9%125,5142.7%– 35.7%111013Mahindra9412.5%+ 3.7%134,9332.4%– 10.5%131314Stellantis5151.4%+ 70.5%152,2031.1%+ 32.6%151615Mercedes4781.3%– 30.9%142,6391.3%– 23.0%141416Daimler Trucks3601.0%– 20.9%171,5570.8%– 17.7%171517FAW Trucks3380.9%– 0.3%162,0061.0%+ 41.4%161718Mazda2510.7%– 29.1%191,3590.7%– 24.0%181819Scania2500.7%– 32.2%181,2100.6%– 3.5%212220Jaguar Land Rover2460.7%– 19.6%241,2120.6%– 17.6%202021UD Trucks2220.6%+ 35.4%209240.4%+ 0.9%232422Honda2010.5%+ 41.5%261,3320.6%+ 5.9%191923Volvo Group1900.5%– 30.1%218880.4%– 17.9%242324Man1470.4%– 36.1%277770.4%– 9.2%262525Mitsubishi1400.4%– 43.8%239580.5%– 33.8%222126JAC1380.4%+ 36.6%307480.4%+ 66.2%272827Volvo Cars1220.3%– 1.6%226670.3%+ 30.5%282728BAIC1170.3%new258720.4%new25 –29Porsche1150.3%– 6.5%285300.3%+ 7.3%292630Proton720.2%new294250.2%new303331Powerstar640.2%– 25.6%323560.2%+ 0.3%313032Tata520.1%– 13.3%332830.1%– 15.5%323133Subaru350.1%– 46.2%342550.1%– 22.3%333234Iveco290.1%– 21.6%352530.1%– 24.0%342935Sinotruk270.1%new312210.1%new353636Babcock190.1%– 53.7%38770.0%– 32.5%363437VECV South Africa100.0%– 60.0%36450.0%– 61.2%373538Ferrari (Scuderia)30.0%+ 200.0%37260.0%+ 73.3%3837
South Africa May 2024 – models:
PosModelMay-24%/23Apr2024%/23PosFY231Toyota Hilux2,3676.4%– 15.4%113,3306.5%– 11.2%112Ford Ranger2,2166.0%+ 5.3%210,3445.0%+ 7.4%223VW Polo Vivo1,8174.9%– 3.1%39,4114.6%+ 18.1%334Toyota Corolla Cross1,5434.2%– 6.1%58,7764.3%+ 3.4%445Isuzu D-Max1,2823.5%– 17.6%67,6553.7%– 4.9%556Suzuki Swift1,2393.3%+ 5.2%47,5803.7%+ 16.5%677Hyundai Grand i101,1173.0%+ 6.0%95,4482.6%+ 28.6%9118Chery Tiggo 4 Pro1,1013.0%+ 47.8%84,9122.4%+ 17.4%10139Toyota Starlet1,0472.8%– 14.0%76,4133.1%– 7.6%7810VW Polo8882.4%– 13.3%114,7362.3%– 0.7%111011Nissan Magnite7742.1%+ 12.5%103,7981.8%+ 22.2%141512Toyota Fortuner7632.1%– 25.0%144,0011.9%– 8.1%121213Mahindra Scorpio Pik Up7161.9%+ 12.1%153,3571.6%– 12.0%151614Suzuki Baleno5781.6%+ 14.7%122,9911.5%+ 1.5%162115Haval Jolion5721.5%– 35.1%132,8221.4%– 28.6%171416Toyota Land Cruiser 704801.3%+ 21.8%22n/an/an/an/an/a17Suzuki Fronx4741.3%new411,8400.9%new29n/a18VW T-Cross4511.2%– 18.0%212,3881.2%– 34.7%201819Toyota Vitz4231.1%+ 35.6%172,7191.3%+ 446.0%182820Nissan Navara4231.1%+ 33.0%352,5841.3%+ 33.0%193021Toyota Hiace4171.1%– 73.1%163,9911.9%– 43.0%13622Renault Kiger4061.1%– 43.6%232,1751.1%– 38.4%241723Kia Sonet3791.0%– 14.6%322,2921.1%– 2.2%231924Toyota Rumion3701.0%+ 16.0%311,7610.9%– 6.0%31n/a25Chery Tiggo 7 Pro3420.9%+ 18.3%201,8420.9%n/a28n/a26Hyundai i203370.9%– 5.3%191,9571.0%– 14.7%262627Renault Kwid3300.9%– 32.0%271,4930.7%– 33.7%352028VW Amarok3250.9%– 1.5%241,6680.8%n/a33n/a29Suzuki Grand Vitara3240.9%– 15.2%291,4900.7%n/a36n/a30Suzuki Ertiga3140.8%– 26.1%342,3711.2%#VALUE!21n/a31Suzuki Jimny3090.8%+ 42.4%331,7060.8%n/a32n/a32Toyota Urban Cruiser3010.8%– 57.8%282,3461.1%– 0.4%222433Nissan NP2002970.8%– 74.3%375,4792.7%– 3.0%8934Haval H62720.7%– 32.5%251,9651.0%– 12.6%252535Suzuki S-Presso2660.7%– 24.4%301,6270.8%– 21.0%342936Ford Territory2660.7%newn/an/an/anewn/an/a37VW T6.12360.6%n/an/an/an/an/an/an/a38VW Polo Sedan2340.6%n/a391,4870.7%n/a37n/a39Toyota Corolla Quest2270.6%– 30.6%n/an/an/an/an/a2240Ford Everest2200.6%– 10.2%401,4400.7%n/a38n/a41Kia Seltos2190.6%+ 43.1%43n/an/an/an/an/a42GWM P-Series2050.6%– 58.5%261,8930.9%+ 14.4%27n/a43Hyundai H100 Bakkie1990.5%– 12.3%479590.5%n/an/an/a44Renault Triber1960.5%– 49.9%181,8160.9%– 32.0%302345Toyota Land Cruiser 3001750.5%#DIV/0!n/an/an/an/an/an/a46Hyundai Venue1710.5%– 57.6%36n/an/an/an/a2747Chery Tiggo 8 Pro1660.4%#VALUE!45n/an/an/an/an/a48Citroen C31630.4%#DIV/0!46n/an/an/an/an/a49Suzuki Eeco1610.4%#DIV/0!42n/an/an/an/an/a50Audi Q31560.4%n/an/an/an/an/an/an/a
Source: NAAMSA
More Stories
Saudi Arabia November 2025: Hyundai places Accent at #1 and i10 at #4
This content is for members only. Visit the site and log in/register to read.
United Arab Emirates November 2025: Mitsubishi Outlander and Tesla Model Y inside Top 5
This content is for members only. Visit the site and log in/register to read.
How Small Upgrades Can Make a Big Difference Off Road
When people think about improving off-road performance, they often picture major upgrades like suspension lifts or oversized tires. While those...
2026 Chrysler Pacifica Pinnacle AWD Review & Test Drive
The Chrysler Pacifica minivan continues to be a force to reckon with when it comes to an affordable transportation appliance...
The New EV Reality Why 2026 Will Look More Hybrid Than Electric
Ford’s eye-popping $19.5 billion EV write-down is not just a headline-grabber, it is a reminder that automakers build on long...
Serbia November 2025: Skoda Octavia now #1 YTD, Toyota Yaris Cross up to #2
The Toyota Yaris Cross is up to 2nd place in Serbia in November. CE Auto data indicates a Serbian new...