New Zealand May 2024: Ford Ranger back in charge in depleted market (-23.6%)
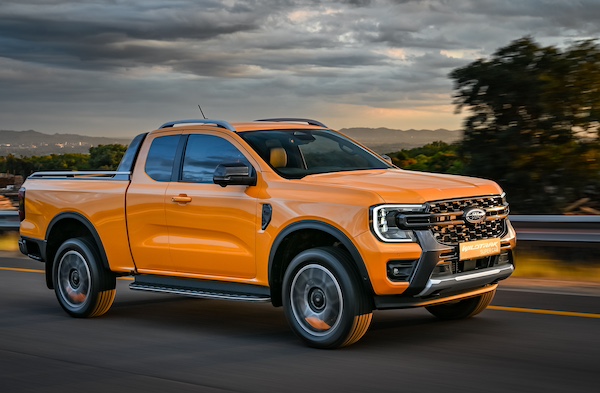
The Ford Ranger holds 10.5% of the New Zealand market in May.
New Zealand new vehicle sales drop a harsh -23.6% year-on-year in May to just 10,186 units, leading the year-to-date tally down -13.3% to 53,271. Passenger cars implode -40.3% to 1,175 and 11.5% share, SUVs are off -31.6% to 5,180 and Light Commercials edge down -0.9% to 3,142. Year-to-date, passenger cars are off -34.3% to 6,221, SUVs down -18.7% to 27,758 and LCVs actually up 7.6% to 15,864.
Toyota (-14.1%) falls significantly slower than the market, resulting in sturdy 23.3% share. Ford (+5.2%) and Kia (+5.4%) swim upstream at #2 and #4 respectively, whereas Hyundai (-61%), Suzuki (-28.4%), Mazda (-25.7%) and Mitsubishi (-24.2%) all suffer. GWM (+478.6%) surges to #10 with 2.4% share. Tesla is down -56.1%. Chinese Jaecoo (#61) and Farizon (#70) make their first appearance in the ranking.
The Ford Ranger (+8.5%) reclaims the models top spot with 10.5% share, relegating the Toyota RAV4 (-11.5%) to 2nd place. The Toyota Hilux (-5%) and Mitsubishi Triton (+23.3%) stay #3 and #4 respectively. The Mitsubishi ASX (+108.9%), Toyota Hiace (+49%), Kia Seltos (#9), Ford Transit (+103.4%), Everest (#12) and Kia Stonic (+81%) all make themselves noticed with fantastic gains.
Previous month: New Zealand April 2024: Toyota RAV4 at record share, sales down to lowest since pandemic
One year ago: New Zealand May 2023: Ford and Ranger stand out in stable market (+0.2%)
Full May 2024 Top 70 All brands and Top 25 models below.
New Zealand May 2024 – brands:
PosBrandMay-24%/23Apr2024%/23PosFY231Toyota2,37523.3%– 14.1%111,75322.1%– 1.2%112Ford 1,46414.4%+ 5.2%27,65214.4%+ 10.5%223Mitsubishi1,10410.8%– 24.2%36,02711.3%+ 15.1%334Kia6806.7%+ 5.4%43,4926.6%– 22.6%445Suzuki5065.0%– 28.4%52,4064.5%– 29.0%566Mazda3653.6%– 25.7%111,5092.8%– 23.8%8107Hyundai3553.5%– 61.0%81,6063.0%– 58.9%758Nissan2602.6%– 22.2%62,1914.1%+ 11.9%699MG2582.5%– 50.0%101,1922.2%– 44.5%13710GWM2432.4%+ 478.6%71,4102.6%+ 670.5%92511Volkswagen2402.4%– 57.2%91,3912.6%– 15.3%101112Isuzu2322.3%– 0.9%121,2052.3%+ 5.5%121513Honda1891.9%– 51.7%131,3362.5%– 18.6%111314Subaru1651.6%– 20.7%157841.5%– 25.0%151615Mercedes1451.4%– 22.0%148901.7%– 9.2%141416LDV1321.3%– 6.4%263610.7%– 44.5%232417BMW1151.1%– 14.2%206401.2%– 13.3%161918Audi1001.0%– 2.9%195131.0%– 8.4%202019Lexus960.9%– 36.8%165591.0%+ 5.5%172120Fuso960.9%– 5.0%214460.8%– 15.2%222221Land Rover800.8%– 9.1%185241.0%– 14.0%182322Tesla760.7%– 56.1%225211.0%– 67.5%19823Skoda710.7%– 48.2%174660.9%– 36.1%211824Omoda580.6%new231200.2%new41 –25Hino560.5%– 23.3%272330.4%– 29.6%292826BYD530.5%– 76.1%312070.4%– 85.2%311227Mini490.5%– 10.9%242910.5%+ 9.8%252728Fiat480.5%+ 26.3%292950.6%+ 89.1%242929Scania480.5%– 9.4%252750.5%+ 15.1%263030Volvo400.4%– 4.8%281750.3%– 40.3%323231Porsche380.4%+ 52.0%352370.4%+ 13.4%273632DAF330.3%+ 106.3%371510.3%+ 41.1%344433Peugeot320.3%– 73.3%332360.4%– 51.3%282634Mahindra300.3%– 42.3%302180.4%+ 77.2%304235SsangYong/KGM300.3%– 11.8%401510.3%– 33.5%353536Kenworth270.3%+ 107.7%391320.2%+ 112.9%374637Foton240.2%+ 20.0%44750.1%+ 1.4%464938Cupra220.2%– 60.7%451280.2%– 29.7%393739Iveco210.2%– 30.0%341730.3%+ 1.8%333140Volvo Trucks210.2%– 4.5%361450.3%+ 18.9%364141Ram200.2%– 28.6%381220.2%– 7.6%404342Chevrolet190.2%– 13.6%411300.2%+ 30.0%384543UD Trucks150.1%– 53.1%431040.2%– 17.5%424044Jaguar130.1%+ 18.2%48860.2%+ 0.0%444845Opel130.1%– 62.9%49320.1%– 75.9%533846Jeep100.1%– 83.6%46760.1%– 51.0%453447Alfa Romeo100.1%+ 233.3%32470.1%+ 161.1%485148Polestar90.1%– 59.1%47360.1%– 84.3%503349Haval80.1%– 97.0%55460.1%– 95.5%491750Citroen50.0%– 61.5%50340.1%– 56.4%514751MAN50.0%– 77.3%52260.0%– 66.2%545052Renault40.0%– 84.6%42940.2%– 46.6%433953Aston Martin40.0%– 42.9%56220.0%– 15.4%555654Ineos30.0%+ 50.0%51320.1%+ 1500.0%525255Sinotruk30.0%– 50.0%60180.0%+ 63.6%576556Ferrari30.0%+ 50.0%57170.0%+ 0.0%586057Lotus30.0%n/a6590.0%+ 12.5%656158Bentley20.0%+ 100.0%53150.0%– 31.8%595559Shacman20.0%new –40.0%new72 –60Zhongtong20.0%n/a –40.0%n/a74 –61Jaecoo20.0%new –20.0%new78 –62Maserati10.0%– 83.3%59180.0%– 28.0%565363International10.0%– 50.0%61140.0%+ 133.3%606464Can-Am10.0%– 75.0%64130.0%– 18.8%615965Lamborghini10.0%n/a62100.0%– 16.7%636366JAC10.0%new5870.0%new68 –67Rolls-Royce10.0%+ 0.0% –70.0%+ 16.7%696768McLaren10.0%n/a6750.0%+ 66.7%717369DFSK10.0%new –10.0%new81 –70Farizon10.0%new –10.0%new82 –
New Zealand May 2024 – models:
PosModelMay-24%/23Apr2024%/23PosFY231Ford Ranger 1,06710.5%+ 8.5%25,33610.0%+ 9.0%112Toyota RAV47617.5%– 11.5%13,6476.8%+ 44.1%223Toyota Hilux7097.0%– 5.0%33,1806.0%– 18.0%334Mitsubishi Triton4444.4%+ 23.3%42,2934.3%+ 57.1%4105Mitsubishi ASX3283.2%+ 108.9%91,4292.7%n/a6n/a6Suzuki Swift2462.4%– 39.0%51,1852.2%– 40.8%767Toyota Hiace2342.3%+ 49.0%119191.7%+ 16.2%11188Mitsubishi Outlander2242.2%– 50.4%61,4332.7%+ 11.2%549Kia Seltos2012.0%n/a71,1672.2%n/a82210MG ZS1851.8%– 52.7%187581.4%– 53.9%14911Ford Transit1791.8%+ 103.4%196821.3%+ 70.1%15n/a12Ford Everest1541.5%n/a89691.8%n/a101913Mazda CX-51511.5%– 9.0%226431.2%– 21.5%182314Kia Stonic1431.4%+ 81.0%138661.6%+ 8.8%122115Hyundai Kona1361.3%– 40.6%23n/an/an/an/a1516Toyota Highlander1211.2%– 9.7%n/a6101.1%n/a20n/a17Kia Sportage1151.1%n/a146731.3%+ 27.5%17n/a18Nissan Navara1141.1%– 0.9%109751.8%+ 56.3%9n/a19Isuzu D-Max1041.0%– 19.4%n/a6101.1%+ 8.3%19n/a20Kia Carnival1021.0%n/an/an/an/an/an/an/a21Suzuki Jimny950.9%n/a17n/an/an/an/an/a22Toyota Corolla930.9%– 39.6%21n/an/an/an/a1223Mitsubishi Eclipse Cross910.9%– 74.9%246771.3%– 57.2%16724Nissan X-Trail870.9%+ 24.3%155751.1%– 28.9%21n/a25Toyota Corolla Cross830.8%n/a167631.4%n/a131726Toyota Yaris Cross830.8%n/a125581.0%+ 0.4%2211n/aVW Amarok510.5%– 57.9%n/a3810.7%n/an/an/an/aToyota Land Cruiser Ute470.5%– 39.0%n/a2600.5%+ 26.2%n/an/a
Source: MIA


