
Germany May 2024: Negative market (-4.4%), Opel Astra at highest in over 7 years
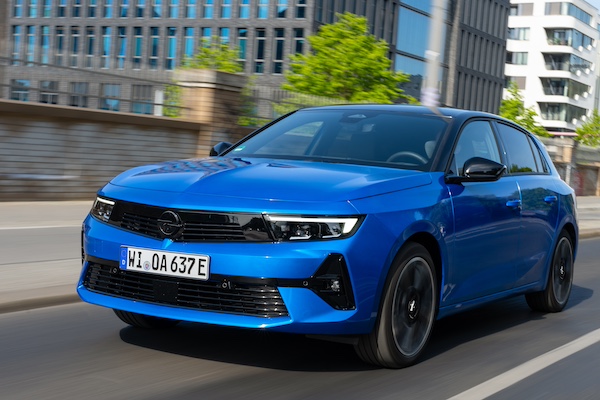
The Opel Astra is up to #4 in Germany in May.
The German new car market recedes slightly in May at -4.4% to 236,044 sales. The year-to-date tally remains in positive however at +5% to 1,172,725 units. Volkswagen (+8.7%) goes against the general negative trend with a solid uptick leading to a 20.2% share vs. 19.5% so far this year. The three following brands – the premium 3 – all lose significant ground year-on-year with double-digit drops: Mercedes is off -28.9%, BMW is at -32.5% and Audi at -17.7%. Skoda on the other hand improves 32.9% to 7.4% share in 5th place. Opel (+29.3%) and Seat (+53.3%) are also in fantastic shape just below. Further down, Peugeot (+70.9%), Volvo (+64.9%) and MG (+51.6%) stand out whereas Tesla (-64%) implodes.
Over in the models charts, the VW Golf (+65%) continues to catch up on lost sales but sees its share drop vs. the past few months at 3.8% vs. 4.5% year-to-date. The T-Roc (+29.8%) and Tiguan (-5%) reproduce the podium of last month and YTD. The performer of the month is the Opel Astra surging 230.5% year-on-year to reach a stellar 4th position. This is the nameplate’s highest ranking in Germany since March 2017 (#3). The Skoda Octavia (+36.9%) is also very dynamic at #5 and ranks #4 so far this year vs. #10 over the Full Year 2023. The Seat Leon (+79.6%), Audi A4 (+44.4%) and Fiat Ducato (+36.8%) also make themselves noticed in the remainder of the Top 10.
Previous month: Germany April 2024: VW Golf, Opel Astra highlight market up 19.8%
One year ago: Germany May 2023: BMW at highest in five years, VW T-Roc best-seller
Full May 2024 Top 63 All brands and Top 340 All models below.
Germany May 2024 – brands:
PosBrandMay-24%/23Apr2024%/23PosFY231Volkswagen47,63620.2%+ 8.7%1228,46419.5%+ 10.2%112Mercedes19,8328.4%– 28.9%2105,4889.0%– 12.2%223BMW18,5687.9%– 32.5%393,7438.0%+ 1.9%344Audi18,2337.7%– 17.7%483,7667.1%– 16.8%435Skoda17,4867.4%+ 32.9%581,8297.0%+ 19.1%556Opel13,4555.7%+ 29.3%660,1285.1%+ 14.9%667Seat11,4274.8%+ 53.3%746,5144.0%+ 51.8%798Hyundai8,0343.4%– 12.8%839,7503.4%+ 0.7%989Ford7,7913.3%– 28.6%941,7503.6%– 12.4%8710Toyota6,5092.8%+ 12.8%1035,9813.1%+ 19.8%101111Peugeot6,0162.5%+ 70.9%1426,3102.2%+ 40.8%141712Kia5,7912.5%– 13.4%1129,5432.5%+ 9.7%111213Fiat5,3762.3%– 4.8%1626,7212.3%– 6.6%131014Dacia5,1352.2%– 9.2%1229,3982.5%+ 10.8%121315Volvo5,0982.2%+ 64.9%1326,1302.2%+ 67.6%152016Cupra4,6092.0%+ 15.8%2017,8071.5%+ 8.7%201617Renault4,5121.9%– 14.7%1818,2101.6%– 21.5%191418Citroen4,3591.8%+ 17.8%1525,4862.2%+ 57.9%162119Mazda3,5011.5%+ 6.8%1919,3171.6%+ 5.8%171820Porsche2,9741.3%– 0.6%1719,2621.6%+ 28.9%182221MG Roewe2,6991.1%+ 51.6%278,4440.7%+ 24.8%262522Mini1,9430.8%– 48.7%2212,6281.1%– 26.2%241923Nissan1,9140.8%+ 5.3%2113,9031.2%+ 7.5%222324Tesla1,8960.8%– 64.0%2516,6011.4%– 41.4%211525Mitsubishi1,6520.7%+ 7.4%2413,8571.2%+ 132.2%232626Smart1,5090.6%– 7.0%266,9230.6%+ 5.5%272727Suzuki1,4890.6%+ 0.7%2310,2710.9%+ 4.7%252428Jeep1,0200.4%+ 6.3%295,1640.4%+ 29.0%292829Land Rover8880.4%+ 0.5%285,3740.5%+ 0.6%282930Alfa Romeo5850.2%– 3.9%312,7760.2%+ 10.1%313231Honda4650.2%+ 7.4%302,9540.3%+ 34.3%303032Polestar4140.2%– 34.2%371,2510.1%– 43.3%343133Lexus3750.2%+ 56.3%321,7740.2%+ 70.9%333634Subaru3210.1%– 6.7%331,9050.2%+ 14.2%323435GWM2680.1%+ 72.9%351,0780.1%+ 149.5%373336BYD2010.1%+ 272.2%407770.1%+ 370.9%403537SsangYong1980.1%+ 15.1%399220.1%+ 7.7%394038DS1880.1%+ 28.8%341,1310.1%+ 66.6%363839Ferrari1790.1%+ 4.7%389320.1%+ 14.6%384240Jaguar1650.1%– 8.8%361,1600.1%– 11.2%353741Man1440.1%– 27.6%416020.1%– 43.0%414142Iveco1050.0%+ 12.9%424750.0%+ 25.3%434843Genesis 950.0%– 22.8%453650.0%– 29.4%444344Lamborghini880.0%– 21.4%435420.0%+ 21.0%424745Bentley630.0%– 39.4%443340.0%– 18.3%454946Maserati470.0%– 42.7%462460.0%– 58.5%474547Alpine430.0%– 15.7%482330.0%+ 54.3%485148Rolls-Royce420.0%+ 44.8%511610.0%+ 9.5%505249NIO350.0%– 20.5%471900.0%– 7.3%494450Ineos310.0%– 46.6%502480.0%+ 217.9%464651Lotus290.0%– 21.6%531180.0%– 4.1%535352Aston Martin280.0%– 51.7%491430.0%– 32.5%515053Cadillac130.0%– 58.1%56740.0%– 39.8%545454Lucid 130.0%+ 1200.0%54500.0%+ 614.3%555755Maxus130.0%+ 116.7%57340.0%+ 277.8%565856Fisker120.0%new521220.0%new525557Xpeng120.0%new –120.0%new61 –58Vinfast80.0%new60300.0%new57 –59Morgan60.0%+ 0.0%59240.0%– 14.3%595960Lada60.0%– 57.1%58190.0%– 80.4%605661Aiways40.0%+ 300.0% –70.0%– 70.8%636062Lynk & Co10.0%– 99.6%55280.0%– 98.2%583963Chevrolet10.0%– 50.0% –70.0%+ 133.3%62n/a –Others4940.2%– 61.5% –4,4540.4%– 21.5% – –
Germany May 2024 – models:
Note: Model detail for Mercedes EQ series, GWM and BYD aren’t available for now.
PosModelMay-24%/23Apr2024%/23PosFY231VW Golf8,9713.8%+ 65.0%152,3634.5%+ 70.1%112VW T-Roc7,8353.3%+ 29.8%231,0802.7%+ 8.4%223VW Tiguan5,3602.3%– 5.0%327,6682.4%+ 3.4%334Opel Astra5,3042.2%+ 230.5%820,7011.8%+ 195.8%5295Skoda Octavia4,4501.9%+ 36.9%421,7431.9%+ 13.4%4106VW Passat4,1551.8%– 5.2%520,6401.8%+ 12.7%657Audi A44,0021.7%+ 44.4%617,1921.5%+ 8.5%7138Seat Leon3,8111.6%+ 79.6%1317,0521.5%+ 107.4%8259Fiat Ducato3,4391.5%+ 36.8%913,0321.1%+ 27.4%164510Opel Corsa3,3541.4%– 24.4%2515,6401.3%– 24.6%11411Cupra Formentor3,1901.4%+ 11.1%2113,2761.1%+ 11.6%151912VW Transporter3,1741.3%+ 18.2%1015,9321.4%+ 14.3%92013Audi A32,9921.3%– 3.6%1513,9381.2%+ 14.4%131414BMW 3er2,9891.3%– 32.2%715,9081.4%+ 14.2%101515BMW X12,9091.2%– 19.1%1213,0181.1%+ 2.1%181116VW Polo2,7931.2%+ 45.9%1414,3631.2%+ 31.1%121617Mercedes E-Klasse 2,7041.1%+ 17.4%2210,1090.9%+ 10.7%304118VW T-Cross2,6311.1%– 4.5%1611,6151.0%– 7.3%232219VW Taigo2,5221.1%+ 66.5%3910,8980.9%+ 15.8%263920Skoda Fabia2,5181.1%+ 76.5%2612,2021.0%+ 40.3%204921Skoda Karoq2,4451.0%+ 46.2%4712,1621.0%+ 33.9%214422Dacia Sandero2,4121.0%+ 7.5%2313,0201.1%+ 30.0%173223VW ID.32,3831.0%+ 9.1%336,9400.6%– 27.1%613624Seat Ateca2,2971.0%+ 17.7%509,5580.8%+ 19.4%353825Toyota Yaris/Cross2,2671.0%+ 13.4%1710,7390.9%– 8.3%272326Seat Ibiza2,2561.0%+ 61.0%378,6890.7%+ 46.9%427327Seat Arona2,2360.9%+ 65.0%417,8860.7%+ 33.3%507028Skoda Kamiq2,2030.9%+ 69.7%449,7080.8%+ 36.0%345829BMW X32,1290.9%– 21.6%3110,5880.9%+ 15.8%282630BMW 1er2,0920.9%– 11.0%308,4180.7%+ 2.5%454631Audi A62,0840.9%– 34.6%427,7770.7%– 39.9%521832MG 42,0640.9%+ 119.3%1104,6670.4%+ 12.2%877433Hyundai Tucson2,0490.9%+ 12.0%249,7240.8%+ 43.0%335034Mercedes GLC2,0260.9%– 37.6%1811,8561.0%– 13.6%221735Mini All1,9430.8%– 48.7%1912,6281.1%– 26.2%19736Mercedes C-Klasse 1,9200.8%– 63.2%2811,4661.0%– 44.2%24937Skoda Enyaq1,9200.8%+ 13.5%587,3120.6%+ 25.4%563138Audi Q31,8890.8%+ 10.5%369,1550.8%– 15.6%392739Mercedes GLA1,8440.8%– 14.3%866,1590.5%+ 29.4%668040VW ID.4, ID.51,8310.8%– 50.8%119,2910.8%– 29.7%371241VW Caddy1,7510.7%+ 19.2%467,7490.7%+ 2.9%536142Citroen C3/C3 Aircross1,7480.7%+ 234.2%2710,2980.9%+ 310.8%299743Volvo XC601,7320.7%+ 59.5%329,7490.8%+ 73.6%326044BMW 4er1,7050.7%– 54.1%2010,0680.9%– 2.6%312445Ford Kuga1,7000.7%– 26.4%529,0880.8%+ 33.1%403746Mercedes V-Klasse/EQV1,6870.7%– 24.7%347,9800.7%– 7.7%494847BMW 5er1,5960.7%– 35.6%458,3700.7%– 21.6%463548Skoda Kodiaq1,5780.7%– 20.9%438,4640.7%– 8.3%443449Mercedes A-Klasse 1,5330.6%– 37.6%577,2870.6%– 30.5%574250Kia Ceed/Xceed1,5180.6%– 10.2%299,3980.8%+ 9.6%364351Opel Mokka1,5160.6%– 12.0%598,2960.7%– 16.1%472152Ford Focus1,4840.6%– 24.5%498,5780.7%– 22.3%432853Dacia Duster1,4430.6%– 11.3%487,8100.7%– 8.9%515454Ford Puma1,4240.6%– 33.9%389,1860.8%+ 10.7%384055Cupra Born1,4170.6%+ 27.9%1014,5290.4%+ 1.1%915656Peugeot 20081,4000.6%+ 112.4%566,1870.5%+ 81.2%659657Skoda Superb1,3930.6%+ 1.9%605,9710.5%– 9.7%686658Fiat 500 lineup1,3700.6%– 51.4%6211,1020.9%– 21.6%25659Hyundai i301,3120.6%+ 41.7%545,9070.5%+ 17.4%708360Toyota Aygo X1,3030.6%+ 18.7%557,7060.7%+ 72.5%548661Mercedes GLB1,2900.5%– 11.7%924,0340.3%+ 0.3%9410362Peugeot 3081,2870.5%+ 233.4%724,9220.4%+ 120.3%8113663BMW 2er1,2750.5%– 50.7%358,8390.8%– 1.1%414764VW Touran1,2710.5%– 16.4%677,3160.6%+ 1.5%555965Toyota Corolla/Cross1,2330.5%+ 103.1%516,9080.6%+ 52.6%627566Hyundai i201,2230.5%– 1.9%795,8330.5%+ 56.2%719067Audi Q21,2070.5%– 45.7%765,4410.5%– 23.1%755768Mercedes CLA-Klasse1,1920.5%– 42.1%407,0290.6%– 9.2%605369Audi Q51,1720.5%– 48.5%845,6720.5%– 48.2%723070Kia Sportage1,1710.5%– 32.3%656,6020.6%+ 5.6%636771Tesla Model Y1,1690.5%– 72.4%7713,3161.1%– 38.7%14872Audi A51,1330.5%+ 11.1%734,6430.4%+ 14.4%898873Opel Crossland1,1170.5%+ 59.8%1265,2420.4%+ 11.1%777774Hyundai i101,0990.5%– 16.6%805,1410.4%– 24.0%796975Opel Grandland X1,0980.5%– 10.7%828,1590.7%+ 74.4%486576Porsche 9111,0940.5%+ 12.9%536,2810.5%+ 35.0%649877Peugeot 30081,0730.5%+ 165.6%1234,7130.4%+ 101.1%8410978BMW X51,0650.5%– 38.1%855,1920.4%– 2.9%787679Audi A11,0650.5%– 36.6%644,6790.4%– 35.4%866480Smart #11,0600.4%+ 113.3%973,1600.3%+ 181.1%11012481Audi Q41,0580.4%– 35.6%685,6700.5%– 14.3%735582Ford Transit, Tourneo1,0360.4%– 54.2%665,3230.5%– 42.5%765283Mercedes GLE1,0290.4%+ 47.8%787,0550.6%+ 66.5%599184Kia Picanto1,0250.4%+ 5.1%913,6490.3%+ 9.7%10210185Citroen Jumper1,0210.4%– 5.8%614,7330.4%– 1.6%839986Volvo EX309920.4%new813,7420.3%new9831687Peugeot 2089880.4%+ 2.0%704,3870.4%– 2.2%929288Dacia Jogger9850.4%– 26.8%636,0350.5%+ 9.3%676889Skoda Scala9780.4%+ 115.9%934,2380.4%+ 45.2%9311690Mitsubishi Space Star9760.4%– 16.4%747,2250.6%+ 62.4%587991VW Touareg9490.4%+ 117.7%1172,9160.2%– 5.4%11712192Mazda CX-58550.4%+ 41.3%894,6990.4%– 0.4%858493Volvo XC408350.4%– 10.7%714,7890.4%+ 6.2%828294Hyundai Kona8340.4%– 62.4%755,4920.5%– 38.7%743395Seat Tarraco8260.3%+ 35.9%1143,3190.3%+ 47.6%10911396Toyota C-HR8250.3%+ 7.1%1283,9090.3%+ 11.3%9711297Mercedes Sprinter8040.3%– 4.3%903,9350.3%+ 0.2%9610498Mercedes CLE7700.3%new1432,0020.2%new14223599Mazda27690.3%+ 34.4%963,9740.3%+ 18.3%95106100Renault Clio7620.3%– 29.3%833,7130.3%– 20.0%10085101Porsche Cayenne7280.3%+ 56.6%944,9710.4%+ 59.2%80135102Tesla Model 37100.3%– 15.8%1302,9920.3%– 46.8%11662103Renault Captur6710.3%+ 10.2%1372,0090.2%– 46.2%14193104Audi Q86460.3%+ 9.5%1702,0540.2%– 25.2%137122105Ford Transit Custom6360.3%n/a1183,3690.3%n/a107262106Volvo S/V606280.3%+ 81.0%1212,7950.2%+ 83.5%121138107Volvo XC906270.3%+ 51.4%1113,5670.3%+ 46.1%105129108Mazda CX-306200.3%+ 54.2%953,6240.3%+ 47.7%103120109Nissan Qashqai6180.3%– 34.3%695,9630.5%– 17.1%6963110Mercedes B-Klasse6180.3%– 41.6%1333,0380.3%– 31.9%113100111Mercedes S-Klasse5860.2%– 29.3%1611,6950.1%– 32.0%155146112Opel Combo5620.2%+ 123.0%1681,0000.1%– 50.9%180169113Citroen Berlingo5610.2%– 39.1%2887290.1%– 83.4%198134114Renault Austral5590.2%– 31.2%1152,0440.2%– 14.8%138105115Renault Kangoo5360.2%+ 16.3%1162,0300.2%+ 18.0%140143116Kia Niro5240.2%– 23.1%1192,4420.2%+ 58.4%128118117Suzuki Ignis5100.2%+ 88.2%1093,1580.3%+ 114.8%111131118Ford Transit Connect5040.2%+ 107.4%1122,5220.2%+ 169.4%126182119Nissan Juke4960.2%+ 52.1%1023,0360.3%+ 62.8%114141120Kia EV64950.2%+ 5.1%1482,1930.2%+ 27.3%132110121Kia Stonic4910.2%+ 18.6%1032,5490.2%+ 23.9%124144122VW ID.74750.2%new1351,4280.1%new164234123Hyundai Ioniq54710.2%– 48.2%1082,5450.2%– 29.7%12587124BMW X24670.2%– 36.4%1361,7070.1%– 17.2%152153125Mercedes Vito4590.2%– 57.4%1003,6820.3%– 3.9%10195126BMW X44580.2%– 22.2%1251,9890.2%+ 6.9%144149127Hyundai Bayon4530.2%+ 290.5%1411,8620.2%+ 150.6%146176128VW Crafter4460.2%– 44.1%1321,9980.2%– 22.7%143148129VW Arteon4390.2%– 57.7%1522,6690.2%– 47.9%12278130Mazda CX-604320.2%+ 13.7%1312,8230.2%+ 30.3%119125131Fiat Panda4300.2%+ 72.0%1621,7970.2%– 48.1%148119132Toyota RAV44220.2%+ 1.2%1242,5640.2%+ 113.7%123159133Opel Zafira Life4200.2%+ 78.7%2337060.1%– 46.9%200171134Citroen C4/C4 X/Spacetourer4180.2%– 10.7%1054,6590.4%+ 193.0%88111135Suzuki Vitara4160.2%– 6.5%1342,2870.2%– 38.6%131114136Polestar 24140.2%– 34.2%1821,2510.1%– 43.3%171128137Mercedes G-Klasse4110.2%+ 0.2%1292,8000.2%– 2.9%120133138Citroen C5 X/Aircross4100.2%– 26.1%874,5850.4%+ 95.1%90132139Mercedes Citan4090.2%– 49.1%1442,1440.2%– 29.2%134126140MG ZS3980.2%– 29.4%1272,1840.2%+ 65.2%133163141Kia Sorento3980.2%+ 167.1%1221,7050.1%+ 106.7%153154142Jeep Compass3940.2%+ 37.8%1711,7950.2%+ 8.2%149161143Peugeot 50083880.2%+ 57.7%1562,8640.2%+ 81.8%118150144Ford Transit Courier3860.2%+ 38500.0%1471,1890.1%+ 9046.2%172356145Renault Twingo3700.2%– 10.8%1461,5300.1%– 27.7%159107146BMW X63560.2%– 7.8%1591,4070.1%+ 23.7%166181147BMW Z43510.1%– 46.7%1201,6950.1%– 16.0%154168148Nissan X-Trail3450.1%+ 325.9%1402,4650.2%+ 148.0%127165149Mitsubishi Colt3410.1%new1542,1360.2%new135246150BMW iX3320.1%– 44.9%1421,7980.2%+ 15.7%147140151Suzuki Swift3270.1%– 21.6%1063,4840.3%+ 75.3%106130152Peugeot Boxer3240.1%– 5.5%1491,4280.1%– 2.8%163179153Alfa Romeo Stelvio3150.1%+ 61.5%1859300.1%+ 26.4%182206154Mazda33140.1%– 1.3%1581,5010.1%– 11.5%161162155Jeep Avenger3100.1%– 1.0%1511,7280.1%+ 452.1%151127156Hyundai Staria3090.1%+ 96.8%1391,6280.1%+ 65.6%156178157VW ID.Buzz3080.1%– 11.2%1731,5500.1%+ 17.1%157142158Porsche Macan3070.1%– 54.2%993,6180.3%+ 11.6%104117159Mercedes GLS3040.1%+ 53.5%1551,8630.2%+ 86.7%145201160Porsche Taycan2960.1%– 23.7%1601,1300.1%– 35.1%175139161Renault Megane2930.1%– 43.7%1801,4230.1%– 39.4%165102162Peugeot 5082790.1%+ 272.0%1898900.1%+ 53.2%187212163VW Up!2780.1%– 84.8%1751,7470.1%– 67.9%15051164Renault Trafic2710.1%+ 66.3%1761,3730.1%+ 67.2%167180165BMW 7er2590.1%+ 0.8%1571,3230.1%+ 9.9%170172166Renault Arkana2580.1%– 36.1%2001,3670.1%– 33.3%168123167Hyundai Ioniq62580.1%– 23.7%1451,3240.1%– 23.2%169137168BMW X72540.1%+ 11.9%1781,4400.1%+ 55.5%162175169Toyota Proace2510.1%– 34.5%1502,0930.2%– 2.4%136145170Smart #32360.1%new2117310.1%new197333171Renault Scenic2270.1%– 2.6%3212630.0%– 65.6%253222172Ford Mustang Mach-E2230.1%– 44.0%1799040.1%– 34.4%185164173Ford Mustang2220.1%+ 23.3%2055540.0%+ 7.2%221216174Renault Master2150.1%+ 1691.7%1886670.1%+ 1610.3%206315175Dacia Spring2140.1%– 51.1%1662,3990.2%+ 0.1%13081176Smart Fortwo2130.1%– 81.1%1073,0320.3%– 44.2%11589177Audi Q72100.1%– 58.2%1989140.1%– 51.2%184152178Peugeot 4082090.1%+ 140.2%2275930.1%+ 1.5%214233179Mazda MX-52010.1%– 26.1%2375370.0%– 42.5%223202180Citroen Jumpy2010.1%+ 34.9%2304820.0%– 3.6%228221181Nissan Townstar1990.1%– 16.4%1651,1440.1%+ 21.2%174185182Jeep Renegade1930.1%– 11.1%1721,0710.1%– 29.0%178156183Land Rover Defender1870.1%– 27.5%1531,5460.1%– 8.4%158151184Range Rover Sport1820.1%+ 139.5%1779400.1%+ 94.6%181213185Mitsubishi Eclipse Cross1740.1%+ 24.3%1961,1570.1%+ 126.9%173189186Volvo S/V901740.1%+ 30.8%1878620.1%+ 34.9%190205187Range Rover Evoque1680.1%– 10.2%1748120.1%– 28.8%192184188Audi A71680.1%– 18.8%2235610.0%– 33.5%220193189Porsche Boxster1670.1%+ 7.1%1691,0870.1%+ 63.7%177224190Alfa Romeo Tonale1650.1%– 6.8%1811,1030.1%+ 15.1%176195191Suzuki SX41610.1%– 47.4%1841,0520.1%– 53.4%179155192Renault Espace1600.1%+ 700.0%1838960.1%+ 729.6%186251193Mitsubishi ASX1590.1%– 29.0%1643,3310.3%+ 233.1%108173194Mazda61570.1%– 61.3%1381,5150.1%+ 4.8%160166195Mazda MX-301530.1%– 52.8%2126410.1%– 56.7%209158196Man TGE1400.1%– 28.9%2095770.0%– 44.3%216207197Range Rover 1370.1%+ 37.0%2265690.0%+ 26.7%218218198Nissan Primastar1330.1%+ 209.3%1937070.1%+ 211.5%199256199BMW 8er1250.1%– 45.4%1638780.1%– 6.4%188209200MG RX61230.1%+ 156.3%2067790.1%+ 91.9%194214201Honda E:NY11210.1%new1865960.1%new212295202Audi e-Tron GT1200.1%+ 8.1%2135930.1%– 5.9%213199203Audi A81180.0%– 56.8%1957690.1%– 12.6%195187204DS 71180.0%+ 66.2%1907000.1%+ 156.4%201231205Mercedes AMG GT1180.0%– 29.3%1996450.1%– 2.6%208226206Lexus LBX1180.0%new2222810.0%new251 –207Range Rover Velar1170.0%– 15.2%1978360.1%+ 8.6%191204208Audi TT1150.0%– 46.0%1928070.1%– 14.2%193177209Jeep Wrangler1140.0%– 7.3%2045120.0%+ 2.8%225247210Porsche Panamera1110.0%– 14.0%2316810.1%+ 17.4%203217211Volvo C401100.0%– 37.5%2256260.1%– 26.6%210190212BMW XM1100.0%+ 89.7%2365120.0%+ 130.6%224243213Renault Rafale1080.0%new3311290.0%new283 –214Lexus NX1060.0%+ 27.7%2016030.1%+ 57.0%211238215Alfa Romeo Giulia1050.0%– 55.7%1917430.1%– 10.2%196194216Porsche Cayman1030.0%– 25.4%2076870.1%+ 25.8%202229217Iveco Daily1030.0%+ 15.7%2244570.0%+ 27.3%232248218Honda HR-V1020.0%+ 13.3%2036790.1%+ 51.6%205208219Subaru Forester1010.0%– 13.7%2214600.0%– 28.3%231220220Mercedes SL980.0%– 76.6%1946610.1%– 56.5%207183221Kia EV9940.0%new2165510.0%new222272222Subaru Outback920.0%+ 114.0%2175650.0%+ 69.2%219225223Honda Jazz860.0%– 53.5%2354340.0%– 40.0%234210224Nissan Leaf840.0%– 19.2%3052860.0%– 49.6%248203225Dacia Logan790.0%n/a2611310.0%n/a282 –226Audi R8780.0%+ 169.0%2144640.0%+ 341.9%230290227Fiat Tipo770.0%+ 92.5%2104140.0%– 34.8%235237228Honda CR-V760.0%+ 13.4%2205700.0%+ 29.0%217232229Opel Movano730.0%n/a2412960.0%n/a246320230Ferrari 296 GTB730.0%+ 231.8%2482850.0%+ 109.6%249279231MG 5720.0%– 47.8%2576800.1%+ 21.6%204200232Lexus RX680.0%+ 33.3%2393520.0%+ 45.5%239236233Toyota bZ4X670.0%– 78.4%2188620.1%– 35.0%189170234Land Rover Discovery Sport660.0%– 14.3%2344540.0%– 26.1%233219235SsangYong Tivoli640.0%– 13.5%2623030.0%– 3.2%245249236Renault Zoe600.0%– 86.7%2155830.0%– 62.3%215167237Toyota Land Cruiser600.0%– 41.2%2403620.0%– 49.9%238230238DS 4580.0%+ 34.9%2453670.0%+ 54.2%237241239Kia Soul570.0%+ 14.0%2632920.0%+ 100.0%247266240Genesis GV70570.0%+ 0.0%2562190.0%+ 1.9%264260241Fiat 600550.0%new2083300.0%new240283242Jaguar F-Pace540.0%– 31.6%2285050.0%+ 46.4%226227243Ssangyong Torres540.0%new2512050.0%new268302244Bentley Continental530.0%– 17.2%2382520.0%– 1.6%255271245Jaguar F-Type520.0%+ 23.8%2592250.0%– 13.8%262270246Lamborghini Urus480.0%– 26.2%2533300.0%+ 26.4%241263247Ford Explorer480.0%+ 37.1%2652030.0%+ 2.0%269281248Suzuki Swace470.0%+ 51.6%2582270.0%– 32.0%261259249Peugeot Expert460.0%– 53.5%2691350.0%– 57.8%280258250Toyota GR86440.0%+ 340.0%2444680.0%+ 209.9%229252251Ford Fiesta440.0%– 94.8%2733240.0%– 94.2%24272252Honda Civic430.0%– 38.6%2194030.0%– 20.0%236228253Alpine A110430.0%– 15.7%2672330.0%+ 54.3%260274254SsangYong Korando410.0%– 26.8%2661780.0%– 39.5%272253255Lamborghini Huracan400.0%– 14.9%2522120.0%+ 13.4%265278256SsangYong Rexton380.0%– 9.5%2542350.0%– 5.6%259268257Lexus UX360.0%– 35.7%2463150.0%+ 60.7%243254258Honda ZR-V360.0%+ 620.0%2472680.0%+ 5260.0%252267259Jaguar E-Pace360.0%+ 63.6%2502420.0%+ 7.6%258261260Ineos Grenadier310.0%– 46.6%2702480.0%+ 217.9%256239261Ferrari Roma310.0%+ 93.8%2432200.0%+ 117.8%263305262Subaru BRZ300.0%– 14.3%2751480.0%+ 146.7%275293263Land Rover Discovery290.0%– 38.3%2492120.0%+ 13.4%266264264Nissan Ariya260.0%– 63.9%2712080.0%– 13.0%267240265Ferrari Purosangue260.0%new2891420.0%new278337266Suzuki Across260.0%+ 225.0%287620.0%+ 169.6%299280267Ferrari SF90/Stradale240.0%– 22.6%2721440.0%+ 0.0%276286268Maserati Grecale230.0%– 48.9%2681360.0%– 66.0%279255269MG 3230.0%new317340.0%new321 –270Peugeot Rifter220.0%– 91.3%2771910.0%– 88.6%270186271Renault Koleos220.0%– 79.6%2911830.0%– 79.6%271211272Lexus ES220.0%– 29.0%2801090.0%– 6.0%286284273Hyundai Santa Fe190.0%– 87.4%2642610.0%– 74.1%254188274MG Marvel190.0%– 78.4%2841000.0%– 68.5%289257275Bentley Bentayga190.0%– 52.5%298910.0%– 40.1%290285276Aston Martin DBX180.0%– 43.8%2831030.0%– 6.4%288296277Audi Q6170.0%new2293090.0%new244 –278Subaru XV160.0%– 87.9%2601780.0%– 67.9%273215279Mercedes CLS160.0%– 80.7%276850.0%– 81.0%291244280Lotus Emira150.0%– 59.5%306460.0%– 62.3%313300281Subaru Solterra140.0%+ 55.6%320680.0%+ 151.9%297312282Genesis GV80130.0%+ 44.4%303590.0%– 10.6%302307283Lotus Eletre130.0%new304570.0%new306321284Lucid Air130.0%+ 1200.0%282500.0%+ 614.3%310318285Maxus Mifa 9130.0%new –340.0%new320347286Fisker Ocean120.0%new2741220.0%new285298287DS 3120.0%– 60.0%286600.0%– 62.3%300287288Lexus LC120.0%+ 1100.0%297490.0%– 7.5%312327289Toyota Supra110.0%– 66.7%2791070.0%– 28.2%287291290Opel Vivaro110.0%+ 175.0%301810.0%+ 800.0%293322291Maserati Levante110.0%– 35.3%292500.0%– 33.3%311314292Genesis GV60110.0%– 73.8%308360.0%– 69.2%319294293Tesla Model S100.0%– 90.6%2951430.0%– 77.6%277223294Jaguar i-Pace100.0%– 23.1%318590.0%– 33.7%303303295Toyota Mirai100.0%– 63.0%327460.0%– 36.1%314309296Lexus RZ100.0%– 37.5%315370.0%+ 15.6%318311297Toyota Highlander90.0%n/a310680.0%+ 580.0%298328298Jeep Grand Cherokee90.0%– 57.1%326580.0%+ 132.0%305288299Cadillac Escalade80.0%– 33.3%299580.0%+ 75.8%304323300Vinfast VF880.0%new339290.0%new324 –301Tesla Model X70.0%– 90.8%2781500.0%– 57.7%274250302Kia Rio70.0%– 98.4%293820.0%– 96.2%292157303Jaguar XF70.0%– 46.2%309750.0%– 61.5%296289304Ford S-Max60.0%– 97.3%338600.0%– 95.0%301197305Jaguar XE60.0%– 50.0%311540.0%– 71.6%307275306Kia Stinger60.0%– 91.9%343510.0%– 82.7%308269307Rolls-Royce Spectre60.0%new312450.0%new316353308Rolls-Royce Cullinan60.0%– 57.1%313380.0%– 22.4%317319309Aston Martin V860.0%– 66.7%307310.0%– 58.7%322310310Genesis G7060.0%– 33.3%323290.0%– 63.3%323308311Genesis G8060.0%+ 0.0%337170.0%– 57.5%335325312Lada Niva60.0%– 40.0%330160.0%– 69.2%338324313Maserati Ghibli50.0%+ 0.0%325170.0%– 57.5%337326314Mercedes Atego50.0%– 16.7% –90.0%– 10.0%349346315Ford Ecosport50.0%– 97.1% –70.0%– 99.6%352192316Toyota Prius40.0%n/a3001240.0%+ 552.6%284282317Cadillac XT440.0%– 78.9%333140.0%– 84.4%341301318Fiat Scudo40.0%n/a –100.0%n/a344 –319Aston Martin DB1140.0%– 50.0%34280.0%– 70.4%351336320Toyota Camry30.0%– 66.7%328230.0%+ 15.0%329331321Lexus LM30.0%new324210.0%new330 –322Subaru Impreza30.0%– 40.0%344160.0%– 66.0%339313323Ferrari Portofino30.0%– 87.5%329150.0%– 85.1%340304324Mercedes Actros30.0%+ 0.0% –100.0%– 9.1%346345325Man TGM20.0%+ 0.0% –120.0%+ 9.1%342n/a326Ferrari F820.0%– 91.3%345110.0%– 92.9%343299327Genesis G9020.0%new341100.0%new345360328Mercedes Arocs20.0%– 33.3% –100.0%+ 150.0%347354329Mercedes Unimog20.0%n/a –30.0%+ 0.0%358n/a330Cupra Tavascan20.0%new –20.0%new359 –331Lynk & Co 0110.0%– 99.6%290280.0%– 98.2%325191332Maserati GranTurismo10.0%– 80.0%316190.0%– 9.5%332339333Fiat Doblo10.0%– 95.2%332180.0%– 82.2%333297334Iveco Eurocargo10.0%– 75.0%336170.0%– 10.5%336342335Suzuki Jimny10.0%n/a31990.0%– 10.0%350351336Man TGL0210.0%n/a –60.0%+ 50.0%354n/a337Maserati Quattroporte10.0%– 66.7%34730.0%– 81.3%357343338Lotus Emeya10.0%new34820.0%new364 –339Man TGS10.0%n/a –20.0%+ 0.0%365n/a340Cadillac XT510.0%n/a –10.0%n/a367 –341Iveco Trakker10.0%new –10.0%new369 –
Source: KBA

More Stories
2027 Ram 1500 SRT TRX Roars Back with 777 HP and a Price Punch
Ram didn’t just bring the TRX back, it brought it back with a point to prove. After the supertruck bowed...
Saudi Arabia November 2025: Hyundai places Accent at #1 and i10 at #4
This content is for members only. Visit the site and log in/register to read.
United Arab Emirates November 2025: Mitsubishi Outlander and Tesla Model Y inside Top 5
This content is for members only. Visit the site and log in/register to read.
How Small Upgrades Can Make a Big Difference Off Road
When people think about improving off-road performance, they often picture major upgrades like suspension lifts or oversized tires. While those...
2026 Chrysler Pacifica Pinnacle AWD Review & Test Drive
The Chrysler Pacifica minivan continues to be a force to reckon with when it comes to an affordable transportation appliance...
The New EV Reality Why 2026 Will Look More Hybrid Than Electric
Ford’s eye-popping $19.5 billion EV write-down is not just a headline-grabber, it is a reminder that automakers build on long...