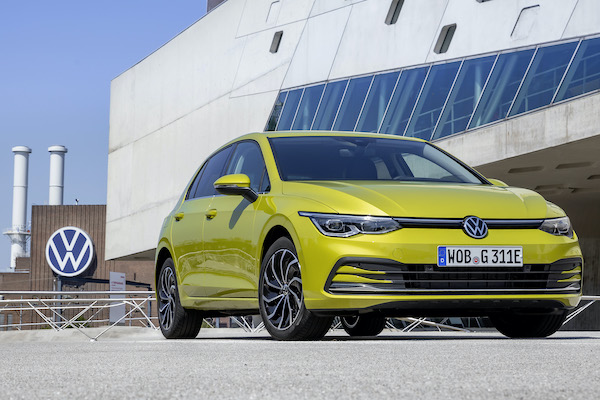
Austria May 2024: VW Golf at highest in almost 10 years
The VW Golf hits 7.2% share in May, its highest since December 2014.
New car sales in Austria recede -3.9% year-on-year in May to 19,820 units, however the year-to-date volume remains in positive at +2.2% to 104,420. Volkswagen (+14.8%) defies the negative market to improve to a stellar 18% share, compared to 15.1% year-to-date. The next three carmakers all fall heavily: Skoda is down -27.7% to 7.6% share vs. 9.5% YTD, BMW falls -10.1% and Audi is off -10.4%. In contrast Mercedes (+17%), Dacia (+25%) and Hyundai (+6.5%) are in great shape below. Volvo (+109.7%), MG (+94%), Peugeot (+37.5%) and Mazda (+19.9%) also shine. Tesla (-41.2%) falls to #14 just as BYD (+373.3%) stays at #23 with 1.4% share.
Model-wise, the VW Golf (+239.1%) lodges another fantastic performance and climbs to 7.2% share, the nameplate’s highest in almost ten years: since the 7.4% it reached back in December 2014. It sells over 3 times more than any other vehicle in the market: the 2nd placed VW Tiguan (+64.3%) is at 2.2% share, followed closely by the Skoda Octavia (-41.5%) in perdition. The rest of the Top 7 all manage double-digit gains and only contain one non-VW Group model: the Dacia Duster (+59%) at #6. The VW Bus (+49.6%), Skoda Karoq (+31.4%) and Seat Ibiza (+13.1%) all impress. Notice also the Citroen C3 (+408.5%), MG ZS (+156%), Dacia Sandero (+60.1%), Audi Q3 (+47.2%) and BMW i4 (+48.8%) making themselves noticed in the remainder of the Top 20. Among BEVs, the MG 4 is up 122.5% and the BYD Atto 3 up 183.3%.
Previous month: Austria April 2024: VW Golf (+150.3%) surges in solid market
One year ago: Austria May 2023: Cupra #10, breaks all records in market up 20.6%
Full May 2024 Top 53 All brands and Top 20 models below.
Austria May 2024 – brands:
PosBrandMay-24%/23Apr2024%/23PosFY231Volkswagen3,56618.0%+ 14.8%115,79115.1%+ 5.3%112Skoda1,5107.6%– 27.7%29,9349.5%– 1.7%223BMW1,4847.5%– 10.1%37,8077.5%+ 10.0%334Audi1,3366.7%– 10.4%46,4646.2%– 6.8%445Mercedes9855.0%+ 17.0%65,3295.1%+ 2.0%666Seat9764.9%– 17.6%56,3186.1%+ 8.5%577Toyota8424.2%– 10.3%74,7534.6%+ 10.9%888Dacia8144.1%+ 25.0%84,9304.7%+ 23.1%799Hyundai6203.1%+ 6.5%102,8552.7%– 14.8%13510Cupra5963.0%– 24.8%152,4162.3%– 21.9%171411Mazda5372.7%+ 19.9%93,1353.0%+ 16.8%101512Peugeot5102.6%+ 37.5%122,4312.3%+ 10.0%161713Kia5042.5%– 38.4%112,9592.8%– 22.8%121014Tesla4992.5%– 41.2%173,3923.2%– 14.6%91315Ford4892.5%– 35.1%132,5852.5%– 41.5%141216MG4832.4%+ 94.0%201,8211.7%+ 59.2%202317Renault4822.4%– 36.7%142,5702.5%– 32.4%151118Volvo4532.3%+ 109.7%161,9411.9%+ 47.3%192119Suzuki4522.3%+ 39.5%223,0772.9%+ 87.9%111820Opel4072.1%– 25.3%191,7421.7%– 24.4%211621Citroen3771.9%+ 36.1%211,5351.5%– 12.9%222022Mitsubishi3231.6%+ 27.2%182,2042.1%+ 150.7%182423BYD2841.4%+ 373.3%231,2181.2%+ 434.2%243024Fiat2391.2%– 19.3%241,1651.1%– 31.6%251925Porsche1580.8%+ 8.2%258070.8%+ 4.4%262626Land Rover1280.6%+ 36.2%285980.6%+ 15.4%282827Mini1180.6%– 44.6%276650.6%– 25.1%272528Alfa Romeo1110.6%+ 68.2%304800.5%– 17.9%302929Nissan1080.5%– 34.9%261,2781.2%+ 42.5%232230Honda990.5%+ 73.7%295200.5%+ 71.1%293131Jeep640.3%– 9.9%314440.4%+ 25.4%312732Polestar420.2%– 46.2%331820.2%– 32.6%333233Smart350.2%+ 1066.7%322220.2%+ 909.1%323934Subaru340.2%– 27.7%371050.1%– 36.0%373335Lexus280.1%+ 55.6%341620.2%+ 37.3%343636DS280.1%+ 33.3%361100.1%+ 5.8%363537Fisker220.1%new351280.1%new353738SsangYong140.1%+ 1300.0%39610.1%+ 1425.0%394039Ferrari130.1%+ 62.5%40460.0%– 20.7%403840Jaguar110.1%– 72.5%38860.1%– 47.6%383441Ineos90.0%+ 12.5%52160.0%+ 100.0%444242Skywell70.0%+ 133.3%44180.0%+ 260.0%425343MAN60.0%+ 500.0%47130.0%+ 160.0%464844McLaren30.0%– 25.0%41180.0%+ 5.9%414645Maserati30.0%– 66.7%51110.0%– 56.0%474146Aston Martin20.0%– 60.0%42160.0%– 15.8%434447Lamborghini20.0%– 33.3%43140.0%+ 7.7%454348Chrysler 20.0%n/a5380.0%+ 14.3%484949Bentley10.0%– 80.0%4960.0%– 57.1%504550Lotus10.0%+ 0.0%5060.0%+ 100.0%525451BAIC10.0%n/a –40.0%+ 100.0%545052KTM10.0%+ 0.0%5730.0%+ 0.0%565253Caterham10.0%n/a –20.0%+ 100.0%5956
Austria May 2024 – models:
PosModelMay-24%/23Apr2024%/23PosFY231VW Golf1,4217.2%+ 239.1%14,6984.5%+ 111.2%132VW Tiguan4422.2%+ 64.3%101,7531.7%+ 8.5%1073Skoda Octavia4412.2%– 41.5%23,5553.4%+ 17.1%214VW Bus3801.9%+ 49.6%91,7811.7%+ 55.3%8145Seat Ibiza3451.7%+ 13.1%82,6812.6%+ 91.4%3126Dacia Duster3261.6%+ 59.0%131,8551.8%+ 42.9%5177Skoda Karoq3101.6%+ 31.4%71,5691.5%+ 8.9%11108BMW X13091.6%– 21.0%51,7571.7%+ 11.6%959Tesla Model Y3081.6%– 51.7%142,5832.5%– 15.3%4210VW Caddy2941.5%– 27.6%121,1871.1%– 28.3%131311Dacia Sandero2931.5%+ 60.1%31,8551.8%+ 22.1%6612Toyota Yaris/Cross2751.4%– 38.9%41,7901.7%– 3.2%7413Skoda Fabia2621.3%+ 8.3%111,4201.4%– 0.4%121614Audi Q32621.3%+ 47.2%191,1121.1%– 5.3%17n/a15BMW i42561.3%+ 48.8%n/a1,0481.0%+ 95.9%18n/a16Seat Leon2521.3%+ 31.3%n/an/an/an/an/an/a17Citroen C32391.2%+ 408.5%n/an/an/an/an/an/a18MG ZS2151.1%+ 156.0%n/an/an/an/an/an/a19VW T-Cross2101.1%– 18.6%61,1311.1%– 5.1%16n/a20Mercedes Bus1971.0%+ 34.0%n/an/an/an/an/an/an/aSeat Ateca1941.0%– 36.4%n/a1,0381.0%– 40.1%199n/aTesla Model 31901.0%+ 27.5%n/a7510.7%+ 10.6%48n/an/aSeat Arona1880.9%– 35.6%181,1861.1%– 27.4%1420n/aKia Ceed1870.9%– 11.8%n/a1,1431.1%+ 41.5%15n/an/aMG 41780.9%+ 122.5%n/a5800.6%+ 90.8%n/an/an/aCupra Born1600.8%– 34.4%n/a5520.5%– 55.8%n/an/an/aAudi Q41490.8%– 53.6%n/a8200.8%– 23.2%n/an/an/aSkoda Kamiq1390.7%– 23.2%151,0341.0%– 9.8%20n/an/aBYD Atto 31360.7%+ 183.3%n/an/an/an/a55n/an/aVolvo EX301310.7%newn/an/an/anewn/a –n/aBYD Seal1100.6%newn/a5240.5%newn/an/a
Source: Statistik Austria


