
Czechia May 2024: Toyota up 40.9%, Hyundai i30 up to #2
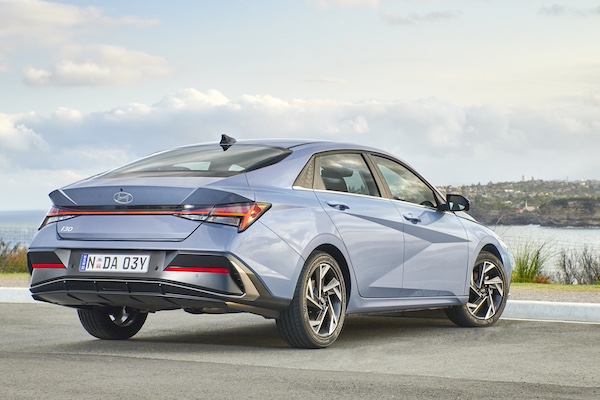
The Hyundai Elantra is up to a record ranking in Czechia in May.
19,736 new cars found a Czech buyer in May, a disappointing -2.8% year-on-year drop. The year-to-date volume remains in positive however at +1.9% and 96,887 sales. Local behemoth Skoda (-13.3%) struggles and falls to 32.2% share vs. 34.4% over the first five months of the year. Hyundai (+0.5%) edges into positive and scores a solid 9.7% share ahead of a euphoric Toyota (+40.9%) at 8.7% of the market. Volkswagen (-27.9%) and Kia (-31.7%) are in deep trouble and round out the Top 5. Volvo (+103.8%) posts a surreal lift at #8 and Dacia (+29.5%) is also in great shape at #6.
The Skoda Octavia (-20.9%) remains ultra dominant at 9.6% share and despite a hefty year-on-year loss. The surprise of the month is delivered by the Hyundai i30 (+41.4%) up three spots on April to land at a record 2nd place, a ranking it last held in April 2022. The rest of the Top 8 is entirely composed of Skodas, with the Kodiaq (+3.4%) leading the way at #3 followed by the Karoq (-11.2%), Scala (+5.8%), Superb (-6.6%), Kamiq (-13.5%) and Fabia (-28%). The Dacia Duster (+130.9%) sports a splendid performance at #9 as do the Toyota RAV4 (+266.4%), MG ZS (+80.3%) and Toyota Corolla (+35.1%) just outside the Top 10.
Previous month: Czechia April 2024: Skoda Kodiaq up to record #2, sales up 6.1%
One year ago: Czechia May 2023: Skoda has 7 models in Top 7 again, Octavia ultra dominant
Full May 2024 Top 50 all brands and Top 303 all models below.
Czechia May 2024 – brands:
PosBrandMay-24%/23Apr2024%/23PosFY231Skoda6,35832.2%– 13.3%133,33534.4%– 2.5%112Hyundai1,9089.7%+ 0.5%39,1329.4%+ 7.4%223Toyota1,7198.7%+ 40.9%28,4198.7%+ 19.4%344Volkswagen1,3406.8%– 27.9%46,2516.5%– 19.6%435Kia8374.2%– 31.7%64,0694.2%– 15.3%556Dacia7643.9%+ 29.5%53,7953.9%+ 5.1%677Mercedes7233.7%– 3.2%73,0793.2%– 19.8%768Volvo5342.7%+ 103.8%92,2382.3%+ 98.2%9149Ford4862.5%– 3.8%102,2132.3%– 15.2%10910BMW4822.4%– 15.4%82,5052.6%+ 1.4%8811Renault4572.3%+ 36.8%131,9702.0%+ 10.2%121212SsangYong4342.2%+ 77.9%121,8211.9%+ 33.0%131313MG4202.1%+ 114.3%181,5451.6%+ 82.2%151814Peugeot3631.8%+ 12.0%112,1272.2%+ 10.8%111015Suzuki2951.5%– 13.2%141,6181.7%+ 16.4%141516Audi2861.4%– 20.6%171,3411.4%– 29.8%171117Citroen 2781.4%+ 45.5%161,3071.3%+ 36.1%182018Opel2771.4%– 12.6%151,4361.5%+ 13.2%161719Tesla2531.3%+ 48.0%217600.8%+ 23.4%222220Lexus2001.0%+ 43.9%199901.0%+ 78.1%202321Mazda1640.8%– 25.8%247450.8%– 20.1%231922Cupra1280.6%– 45.5%228930.9%+ 5.7%212123Honda1150.6%+ 88.5%235610.6%+ 95.5%242824Subaru930.5%+ 32.9%264090.4%+ 27.4%262425Seat910.5%– 68.9%201,0491.1%– 23.7%191626Land Rover900.5%– 5.3%293470.4%– 4.1%282527Mitsubishi880.4%+ 193.3%253810.4%+ 180.1%273228Nissan870.4%+ 93.3%304890.5%+ 143.3%252629Porsche630.3%+ 1.6%282690.3%– 13.2%292730Jeep610.3%+ 56.4%311900.2%+ 40.7%313031Fiat410.2%+ 17.1%272570.3%+ 24.2%302932Mini360.2%– 36.8%321610.2%– 20.7%323133Dodge250.1%+ 108.3%34810.1%+ 80.0%343634Alfa Romeo140.1%+ 55.6%33940.1%– 1.1%333435Ferrari140.1%– 6.7%37510.1%– 16.4%363536DS100.1%– 47.4%35680.1%– 35.2%353337Forthing90.0%+ 28.6%39350.0%+ 400.0%394738Lamborghini80.0%+ 14.3%38370.0%+ 8.8%384039Jaguar70.0%+ 0.0%36510.1%+ 4.1%373740Alpine50.0%+ 150.0%48130.0%+ 160.0%435041Chevrolet30.0%– 25.0%41210.0%+ 40.0%403842SWM30.0%new5360.0%new516543Maserati20.0%– 60.0%42110.0%– 50.0%454144DFSK20.0%– 33.3%5160.0%– 70.0%494245Rolls Royce20.0%– 50.0%5440.0%– 73.3%544446Voyah20.0%new –20.0%new58 –47Bentley10.0%– 50.0%40200.0%+ 25.0%413948Ineos10.0%– 50.0%45190.0%+ 850.0%424349Alpina10.0%+ 0.0%4680.0%– 20.0%464550Aston Martin10.0%– 75.0% –60.0%– 40.0%4846
Czechia May 2024 – models:
PosModelMay-24%/23Apr2024%/23PosFY231Skoda Octavia1,8929.6%– 20.9%110,16310.5%+ 8.4%112Hyundai i309775.0%+ 41.4%54,1304.3%+ 27.2%373Skoda Kodiaq9394.8%+ 3.4%24,0974.2%– 1.4%464Skoda Karoq8504.3%– 11.2%63,7543.9%– 6.9%755Skoda Scala7353.7%+ 5.8%34,2544.4%+ 8.2%236Skoda Superb7233.7%– 6.6%72,8192.9%– 8.9%897Skoda Kamiq6293.2%– 13.5%44,0354.2%– 3.3%548Skoda Fabia5312.7%– 28.0%83,8143.9%– 21.7%629Dacia Duster4632.3%+ 130.3%92,0112.1%+ 38.4%101310Hyundai Tucson4422.2%– 27.7%102,5712.7%– 6.0%9811Toyota RAV44252.2%+ 266.4%121,5941.6%+ 182.1%132312Toyota Corolla3311.7%+ 35.1%111,9862.0%+ 40.5%111213MG ZS3121.6%+ 80.3%191,1801.2%+ 84.4%162114Kia Ceed3021.5%– 30.1%141,6141.7%– 6.0%121115VW Golf2611.3%– 57.4%171,2741.3%– 21.2%141016SsangYong Korando2481.3%+ 26.5%159461.0%+ 7.4%181817VW Tiguan2401.2%+ 38.7%161,0381.1%– 16.7%171518Toyota Proace City2341.2%+ 157.1%138380.9%+ 60.5%223619Kia Sportage2051.0%– 26.8%188750.9%– 8.3%202020Tesla Model Y2051.0%+ 73.7%325040.5%+ 162.5%436021VW Transporter1810.9%+ 9.0%335330.6%+ 8.1%403922Toyota Yaris Cross1760.9%+ 6.0%271,2001.2%– 4.7%151423Volvo XC901590.8%+ 89.3%246880.7%+ 84.9%274924Dacia Jogger1580.8%– 30.4%208900.9%– 19.6%191925Toyota Yaris1570.8%– 15.6%216700.7%– 44.9%281626Hyundai Bayon1460.7%+ 80.2%257280.8%+ 49.5%242927Renault Captur1440.7%+ 65.5%436500.7%+ 59.3%294428Dacia Sandero1380.7%– 12.7%228530.9%– 15.0%211729Volvo XC601350.7%+ 229.3%396010.6%+ 82.7%335330Suzuki S-Cross1340.7%– 2.2%307050.7%+ 7.0%262831Hyundai Kona1330.7%– 12.5%455420.6%– 12.3%383032Toyota Proace1330.7%+ 0.8%296430.7%+ 4.9%302533Kia Stonic1230.6%– 20.1%473790.4%– 22.7%533834Peugeot 20081210.6%+ 26.0%237480.8%+ 50.2%233235VW Caddy1180.6%– 26.7%386180.6%– 12.0%322436Ford Kuga1100.6%+ 32.5%446210.6%+ 0.3%313437Renault Clio 1070.5%+ 37.2%465330.6%+ 3.9%394238Mercedes GLC1040.5%+ 147.6%374320.4%+ 20.0%496239Toyota C-HR1000.5%+ 33.3%405440.6%+ 6.7%372740Mercedes GLE980.5%+ 6.5%613440.4%– 42.9%603341Ford Focus980.5%+ 46.3%723570.4%– 1.7%565942Cupra Formentor970.5%– 48.7%347200.7%+ 14.6%253143Citroen C3970.5%+ 16.9%355310.5%+ 62.9%415444VW Passat900.5%– 11.8%534390.5%– 12.5%474545Hyundai i10900.5%+ 130.8%653810.4%+ 35.1%526646BMW X5890.5%+ 11.3%484650.5%+ 28.1%454347Ford Puma860.4%– 17.3%265730.6%+ 18.9%343548SsangYong Tivoli860.4%+ 1333.3%554380.5%+ 184.4%4812749Citroen Berlingo850.4%+ 4150.0%1671100.1%+ 120.0%13319850Volvo EX30840.4%new1311520.2%new108 –51Hyundai i20820.4%– 51.5%285690.6%– 6.4%353752Kia Proceed810.4%+ 62.0%424800.5%+ 58.9%447353Opel Astra 800.4%+ 35.6%522790.3%+ 61.3%7310054VW Multivan800.4%+ 63.3%413990.4%+ 54.1%516755BMW X1790.4%+ 12.9%632810.3%+ 0.7%727056Suzuki Vitara780.4%– 26.4%315200.5%+ 7.9%424657Opel Crossland X770.4%– 30.0%585610.6%+ 30.2%365658Lexus NX730.4%+ 65.9%563360.3%+ 84.6%619559Mercedes V Class700.4%– 16.7%513020.3%– 35.2%664160VW T-Roc670.3%+ 109.4%1162780.3%+ 6.5%747261MG HS670.3%+ 318.8%1012600.3%+ 40.5%759662Toyota Camry660.3%+ 100.0%782390.2%+ 60.4%8010563Mercedes E Class650.3%+ 261.1%542460.3%+ 211.4%7714264Honda CR-V630.3%+ 53.7%713120.3%+ 97.5%6310265Lexus RX630.3%+ 80.0%603300.3%+ 61.0%628166Peugeot Rifter630.3%+ 687.5%154830.1%– 51.5%15114867VW Polo610.3%+ 22.0%823020.3%+ 21.3%676868Peugeot 308590.3%– 24.4%494310.4%+ 40.8%505869BMW X7580.3%+ 52.6%852860.3%+ 65.3%709070Opel Combo580.3%+ 544.4%961190.1%– 6.3%12116771Skoda Enyaq560.3%– 49.5%503620.4%– 12.3%552672Ford Transit/Tourneo Custom560.3%– 36.4%991570.2%– 62.9%1064873Peugeot 208550.3%– 12.7%364560.5%+ 36.5%465774Mercedes GLS550.3%– 3.5%802130.2%– 25.8%857675Nissan Qashqai550.3%+ 175.0%1502450.3%+ 155.2%789476Audi A6540.3%+ 80.0%1201900.2%– 6.4%938377VW T-Cross510.3%– 27.1%772480.3%– 40.5%766578Mercedes GLB510.3%+ 15.9%862380.2%+ 63.0%8110179SsangYong Torres500.3%new882830.3%new7115480Subaru Outback490.2%+ 113.0%732110.2%+ 91.8%8810781Mazda CX-5480.2%– 23.8%1072160.2%– 16.6%847782Audi A4480.2%+ 433.3%871880.2%+ 111.2%9514783Tesla Model 3460.2%+ 39.4%842340.2%+ 550.0%8211784Kia Xceed450.2%– 40.0%743080.3%– 31.4%645585VW Touran440.2%– 81.7%683030.3%– 55.9%652286Volvo XC40440.2%– 56.0%592880.3%+ 17.6%696487Toyota Aygo X440.2%– 53.7%763560.4%– 16.0%575088VW Taigo440.2%– 43.6%1062120.2%– 51.0%876189Suzuki Ignis440.2%– 6.4%1042070.2%+ 122.6%8912990Renault Megane430.2%– 31.7%891810.2%– 48.1%987991SsangYong Rexton430.2%+ 19.4%1421400.1%– 20.5%11110892Renault Kangoo420.2%+ 100.0%1101160.1%+ 103.5%12616893Volvo V60420.2%+ 223.1%931390.1%+ 172.5%11218994Mitsubishi ASX420.2%+ 740.0%941710.2%+ 2037.5%10218595Ford Transit400.2%+ 37.9%2241100.1%– 7.6%13412396Mercedes CLA380.2%– 42.4%911710.2%– 22.3%1018597Renault Trafic380.2%+ 137.5%1531070.1%+ 78.3%13616398Ford Tourneo Connect370.2%+ 12.1%671730.2%+ 74.7%10011899Renault Austral360.2%+ 50.0%701930.2%+ 91.1%91111100Citroen C5 Aircross350.2%+ 94.4%1451170.1%+ 72.1%122166101Volvo V90350.2%+ 250.0%752040.2%+ 223.8%90131102Mercedes CLE350.2%new147690.1%new161333103Mitsubishi Space Star340.2%+ 47.8%921360.1%+ 21.4%116140104Audi Q3330.2%– 23.3%901750.2%– 42.6%9974105Mercedes Vito320.2%– 45.8%971480.2%– 40.1%10986106BMW 3 Series320.2%– 36.0%692410.2%– 8.4%7980107BMW 5 Series320.2%– 34.7%1051890.2%– 21.9%9489108Mercedes GLA320.2%– 13.5%791690.2%+ 19.9%103109109Audi A3310.2%– 44.6%811910.2%– 5.4%92104110Mazda CX-30310.2%– 40.4%1191370.1%– 22.2%11498111Suzuki Swift300.2%– 26.8%981560.2%+ 48.6%107120112Citroen C4300.2%– 16.7%573520.4%+ 51.1%5897113Kia Sorento300.2%+ 57.9%143860.1%– 20.4%150121114Opel Corsa290.1%– 51.7%1001400.1%– 19.1%11082115Audi A5290.1%+ 107.1%1221030.1%+ 98.1%139188116MG 4290.1%+ 1350.0%180670.1%+ 3250.0%164227117Cupra Leon280.1%– 28.2%1371610.2%– 1.8%105114118BMW 4 Series280.1%– 28.2%1391160.1%– 17.1%123116119Mercedes A Class270.1%– 27.0%1121190.1%– 30.0%120113120VW Touareg270.1%+ 8.0%832130.2%+ 28.3%8687121Volvo S60270.1%+ 800.0%1461120.1%+ 558.8%132172122Ford Tourneo Courier270.1%n/a108920.1%n/a144354123Audi Q8260.1%– 59.4%1321880.2%– 51.0%9652124Range Rover Sport260.1%– 23.5%1261000.1%+ 22.0%140144125Honda HR-V260.1%+ 333.3%1111040.1%+ 316.0%138183126Audi Q7250.1%– 62.1%140890.1%– 73.4%14671127Toyota Highlander250.1%+ 66.7%1131370.1%+ 185.4%115177128Seat Leon240.1%– 40.0%663650.4%+ 247.6%5475129Renault Arkana240.1%– 33.3%1281120.1%– 52.5%13178130Mazda CX-60240.1%– 11.1%1411050.1%– 32.3%137103131Mini Countryman240.1%+ 84.6%159800.1%+ 1.3%154169132Seat Arona230.1%– 71.6%642230.2%– 60.1%8347133Peugeot 408230.1%+ 360.0%2021090.1%+ 28.2%135126134BMW X6220.1%– 52.2%1171160.1%– 6.5%124125135Nissan X-Trail220.1%+ 340.0%1271140.1%+ 533.3%127162136Lexus LBX220.1%new181320.0%new202 –137Seat Ateca210.1%– 82.1%623470.4%– 22.9%5951138Opel Mokka210.1%– 58.8%1332880.3%+ 20.0%6884139Mercedes C Class210.1%– 50.0%1641160.1%– 55.4%12593140VW Arteon210.1%– 47.5%1181850.2%– 47.1%9769141Peugeot 3008210.1%– 19.2%1091210.1%– 52.5%11999142Subaru Forester210.1%+ 320.0%166670.1%+ 39.6%165182143Land Rover Defender200.1%+ 5.3%174670.1%– 36.8%163122144Peugeot 5008190.1%– 57.8%1021640.2%– 34.1%10491145Hyundai Staria190.1%– 57.8%129880.1%– 16.2%148115146Toyota bZ4X190.1%+ 216.7%155440.0%+ 109.5%186209147Jeep Avenger190.1%new156470.0%new183218148Mazda3180.1%– 35.7%1341130.1%– 15.7%130124149Kia Picanto180.1%+ 0.0%1211130.1%+ 52.7%129145150Jeep Compass180.1%+ 50.0%191670.1%+ 81.1%162165151Porsche Cayenne180.1%+ 63.6%135800.1%+ 3.9%155139152Range Rover 170.1%– 5.6%176630.1%+ 16.7%168164153Lexus ES170.1%+ 30.8%951380.1%+ 187.5%113158154Mazda6160.1%– 20.0%169790.1%– 8.1%156149155Citroen C3 Aircross160.1%– 11.1%123990.1%– 19.5%141136156Mercedes G Class160.1%– 11.1%125890.1%– 33.6%147119157Porsche 911160.1%+ 0.0%124730.1%– 1.4%159153158Seat Tarraco160.1%+ 14.3%158830.1%+ 18.6%152143159Ford Mustang Mach-E160.1%+ 166.7%189420.0%+ 110.0%187210160Mercedes Sprinter150.1%– 34.8%171500.1%– 12.3%180170161Fiat 500150.1%+ 15.4%1031130.1%+ 34.5%128141162Fiat Panda150.1%+ 200.0%136590.1%+ 118.5%175207163Kia Niro140.1%– 62.2%144730.1%– 50.7%158130164BMW 7 Series140.1%– 44.0%149910.1%+ 18.2%145159165BMW 2 Series140.1%– 6.7%1301210.1%+ 65.8%118150166Renault Espace140.1%new162620.1%new171246167Jeep Wrangler140.1%n/a203370.0%+ 428.6%196270168BMW X3130.1%– 72.3%1481280.1%– 40.5%11788169Audi Q5130.1%– 63.9%138980.1%– 39.9%142110170Mazda2130.1%– 38.1%160620.1%– 33.3%169156171BMW ix1130.1%+ 62.5%161490.1%+ 53.1%182195172VW ID.7130.1%new220650.1%new166372173Honda ZR-V130.1%new151610.1%new173215174BMW i5130.1%new221280.0%new210279175Hyundai Ioniq 5120.1%– 7.7%175580.1%+ 0.0%176181176Audi Q2120.1%– 7.7%244440.0%+ 57.1%185232177BMW i4120.1%+ 20.0%177490.1%+ 19.5%181178178Mazda MX-5120.1%+ 71.4%246200.0%+ 53.8%235254179VW ID. Buzz120.1%+ 500.0%281240.0%– 55.6%229194180Subaru BRZ110.1%– 26.7%178640.1%+ 18.5%167151181Lexus LC110.1%+ 22.2%215270.0%+ 8.0%213222182Mercedes S Class100.1%– 64.3%157620.1%– 60.8%170106183Honda Civic100.1%+ 25.0%115600.1%– 14.3%174160184BMW X2100.1%+ 100.0%173410.0%+ 156.3%190257185Land Rover Discovery100.1%+ 150.0%186300.0%+ 36.4%207226186Opel GrandLand X90.0%– 52.6%195410.0%– 57.7%191146187Porsche Macan90.0%– 30.8%183420.0%– 23.6%189173188VW California90.0%– 25.0%190250.0%+ 8.7%224233189Mercedes EQA90.0%– 10.0%212270.0%– 15.6%214208190DS 7 Crossback90.0%+ 800.0%241390.0%+ 2.6%194203191Mini 80.0%– 66.7%214450.0%– 42.3%184161192BMW X480.0%– 33.3%184610.1%– 3.2%172175193BMW 1 Series80.0%– 27.3%187330.0%– 35.3%200204194VW ID.380.0%+ 14.3%192320.0%– 54.3%205132195Range Rover Evoque80.0%+ 60.0%216260.0%– 10.3%221225196Citroen e-C480.0%+ 60.0%294100.0%+ 100.0%271271197BMW Z480.0%+ 100.0%198210.0%+ 0.0%233250198Mercedes Citan70.0%– 65.0%114750.1%– 50.3%157133199BMW XM70.0%– 41.7%256260.0%+ 36.8%220184200BMW IX70.0%+ 40.0%226260.0%– 18.8%219201201Porsche Boxster70.0%+ 250.0%248150.0%+ 87.5%244272202Mitsubishi Colt70.0%new163540.1%new179353203Alfa Romeo Giulia70.0%n/a231290.0%+ 314.3%208259204Subaru Crosstrek70.0%new222210.0%new234341205MG 570.0%new –170.0%new240335206Renault Scenic70.0%new –110.0%new269 –207Kia Rio60.0%– 95.7%168570.1%– 88.2%17740208Seat Ibiza60.0%– 85.4%182290.0%– 83.6%209137209Kia EV660.0%– 68.4%207380.0%– 35.6%195176210Citroen C4 X60.0%– 50.0%170710.1%+ 39.2%160179211Ford Mustang60.0%– 45.5%254120.0%– 71.4%261211212Mercedes B Class60.0%– 40.0%185320.0%– 22.0%203196213Audi A760.0%– 14.3%227330.0%– 13.2%199191214Ferrari Roma60.0%+ 200.0%233130.0%+ 30.0%252287215Kia EV960.0%new234330.0%new201241216Lexus UX50.0%– 86.1%152980.1%+ 8.9%143135217Jeep Renegade50.0%– 72.2% –130.0%– 79.0%254171218Volvo C4050.0%– 37.5%225250.0%– 26.5%223214219Porsche Taycan50.0%– 16.7%269150.0%– 31.8%245238220Mercedes EQB50.0%+ 0.0%199270.0%+ 42.1%215221221Toyota GT86/GR8650.0%+ 66.7%204410.0%+ 412.5%192155222Dacia Spring50.0%+ 66.7%240360.0%– 23.4%197192223Mitsubishi Eclipse Cross50.0%+ 150.0%230180.0%+ 38.5%239244224Alpine A110 50.0%+ 150.0%270130.0%+ 160.0%250276225Jaguar F-Pace50.0%+ 400.0%200230.0%+ 9.5%230223226Suzuki Across50.0%+ 400.0% –120.0%+ 200.0%264275227VW ID.440.0%– 63.6%279140.0%– 83.7%249157228Mercedes EQE40.0%– 50.0%193270.0%– 3.6%216187229Range Rover Velar40.0%– 33.3%197270.0%+ 22.7%217212230Mercedes AMG GT40.0%– 20.0%194240.0%+ 9.1%228220231MG EHS40.0%– 20.0%260200.0%+ 5.3%236240232Suzuki Swace40.0%+ 0.0%266150.0%+ 87.5%246290233Porsche Panamera40.0%+ 0.0%263100.0%– 52.4%273228234Hyundai Ioniq 640.0%+ 33.3%242160.0%– 33.3%242206235Audi A140.0%+ 33.3%28590.0%– 55.0%274239236Alfa Romeo Stelvio40.0%+ 300.0%179400.0%+ 2.6%193213237Fiat 60040.0%new249240.0%new227 –238Lexus RZ40.0%new206130.0%new255319239Ferrari Purosangue40.0%new272110.0%new267351240Hyundai Santa Fe30.0%– 96.8%236420.0%– 87.4%18863241Subaru XV30.0%– 88.0%237320.0%– 62.8%204128242Nissan Townstar30.0%– 80.0%238350.0%– 36.4%198199243Mini Cabrio30.0%– 66.7%210220.0%+ 0.0%232251244Mercedes EQS30.0%– 66.7%259110.0%– 66.7%268180245Alfa Romeo Tonale30.0%– 62.5%217240.0%– 50.0%225190246Ford Explorer30.0%– 25.0%208140.0%– 60.0%247231247Nissan Juke30.0%+ 0.0%243870.1%+ 383.3%149230248Land Rover Discovery Sport30.0%+ 0.0%258280.0%– 9.7%211224249Lamborghini Huracan30.0%+ 0.0%245160.0%+ 33.3%243264250Opel Vivaro30.0%+ 0.0% –30.0%– 25.0%304324251Lamborghini Urus30.0%+ 200.0%218140.0%+ 100.0%248283252Mercedes EQT30.0%new25260.0%new283334253BMW 2 Series Active Tourer20.0%– 90.0%196550.1%– 42.1%178152254Fiat Tipo20.0%– 84.6%255300.0%– 53.8%206134255VW ID.520.0%– 84.6%27860.0%– 86.4%284205256Tesla Model X20.0%– 75.0% –70.0%– 30.0%281229257Honda Jazz20.0%– 66.7%209220.0%– 33.3%231216258Audi A820.0%– 66.7%25780.0%– 57.9%276236259BMW 8 Series20.0%– 50.0%211130.0%– 23.5%251237260BMW i720.0%– 50.0%247120.0%– 29.4%259248261Volvo S9020.0%+ 0.0%219280.0%+ 115.4%212247262Porsche Cayman20.0%+ 0.0%201190.0%+ 11.8%238234263Fiat 500X20.0%+ 100.0%188240.0%+ 118.2%226253264Mercedes EQV20.0%+ 100.0%251130.0%+ 85.7%256269265Mercedes T Class20.0%new213130.0%new257280266Ferrari 29620.0%n/a261100.0%+ 42.9%272278267Lexus LM20.0%new –80.0%new278340268Rolls Royce Spectre20.0%new29740.0%new297332269Lamborghini Revuelto20.0%new30330.0%new300 –270Nissan Leaf20.0%n/a30130.0%+ 200.0%301309271Porsche 71820.0%n/a –30.0%n/a302331272Lexus LS20.0%n/a –20.0%+ 100.0%317303273Ford Fiesta10.0%– 96.0%276160.0%– 89.8%241112274Citroen C5 X10.0%– 90.9%277120.0%– 82.6%260174275Mini Clubman10.0%– 90.0%265120.0%– 40.0%263249276DS 410.0%– 85.7%172250.0%– 44.4%222197277Renault Koleos10.0%– 85.7% –30.0%– 92.3%303217278Maserati Grecale10.0%– 80.0%27150.0%– 64.3%287252279Cupra Ateca10.0%– 75.0% –70.0%– 63.2%280256280Jaguar E-Pace10.0%– 66.7%26790.0%+ 28.6%275285281Mazda MX-3010.0%– 50.0%264120.0%+ 71.4%262284282Audi R810.0%– 50.0%29160.0%+ 50.0%282295283Toyota Supra10.0%– 50.0%28350.0%– 44.4%290260284Subaru Solterra10.0%– 50.0% –40.0%– 42.9%298289285BMW iX310.0%– 50.0% –20.0%– 81.8%307291286Jaguar F-Type10.0%+ 0.0%228130.0%+ 85.7%253288287Bentley Continental10.0%+ 0.0%223120.0%+ 200.0%258261288Peugeot Traveller10.0%+ 0.0%25340.0%– 33.3%296265289Audi e-Tron10.0%+ 0.0%29920.0%– 86.7%306274290DFSK Glory 58010.0%+ 0.0%28720.0%– 75.0%308294291Nissan Ariya10.0%+ 0.0% –20.0%+ 0.0%316316292VW Sharan10.0%+ 0.0% –10.0%– 91.7%338297293Toyota Prius10.0%n/a205270.0%n/a218286294Ineos Grenadier10.0%new250190.0%new237242295BMW iX210.0%new23580.0%new277 –296Peugeot 50810.0%n/a26280.0%– 11.1%279245297Subaru Impreza10.0%n/a27450.0%n/a289321298Lexus RC10.0%n/a27540.0%n/a294328299Alpina 310.0%n/a –20.0%+ 0.0%305338300Maserati MC2010.0%n/a28920.0%– 33.3%315311301Renault Rafale10.0%new –10.0%new339 –302Voyah Dream10.0%new –10.0%new340 –303Voyah Free10.0%new –10.0%new341 –
Source: SDA CIA

More Stories
UK Full Year 2025: Ford Puma threepeats at #1, Jaecoo 7 up to #4 in September
This content is for members only. Visit the site and log in/register to read.
Argentina Full Year 2025: Toyota Hilux returns to #1 in market up 48.3%
This content is for members only. Visit the site and log in/register to read.
Sweden Full Year 2025: Volvo XC60 grabs first win, Tesla Model Y down -68.2%
This content is for members only. Visit the site and log in/register to read.
Hyundai Wants Humanoid Robots Building Your Next Car
Hyundai has been inching toward a future where robots do far more than shuttle parts around a factory floor, and...
Stellantis Goes Big in America With $13 Billion Plan for a New Durango and a Midsize Pickup
Stellantis is putting a huge stack of chips on the table in the U.S., announcing a $13 billion investment over...
2026 Honda Civic Type R Pushes Closer to $50K
The Honda Civic Type R has never been the cheap thrill in the hot hatch world, but the latest price...