UK May 2024: 22nd straight month of growth, Kia Sportage in the lead
The Kia Sportage is #1 in the UK For the third time ever.
New car sales in the UK sign a 22nd consecutive month of year-on-year growth in May at +1.7% to 147,678 units. This is the best May result since 2021 but remains -19.6% below the pre-pandemic level of May 2019 (183,724). After 5 months, the year-to-date volume is up 7.1% to 827,500. Once again fleet sales pull the market up at +14% to 86,870 and 58.8% share vs. 52.5% in May 2023 whereas private sales sink -12.9% to 57,453 and 38.9% share vs. 45.4% a year ago. Meanwhile government sales are up 9.5% to 3,355. Year-to-date, the trend is ever clearer with fleets up 24.2% to 494,535 and 59.8% vs. 51.5% over the same period in 2023 and private sales off -11.3% to 315,256 and 38.1% share vs. 46%. Government sales are down -6.3% to 17,709.
Looking at sales by propulsion, petrol recedes -2.1% to 81,058 and 54.9% share vs. 57% a year ago, and diesel skids -16.7% to 9,220 and 6.2% share vs. 7.6%. BEV sales gain 6.2% to 26,031 and 17.6% vs. 16.9% in May 2023. This is mainly due to strong fleet sales at +10.7% while private BEC sales are actually off -2%. HEVs are up 9.6% to 19,503 and 13.2% share vs. 12.3% and PHEV up 31.5% to 11,866 and 8% share vs. 6.2%. Year-to-date, petrol is up 5% to 462,860 and 55.9% share vs. 57.1% over the same period last year, diesel is down -11% to 55,524 and 6.7% vs. 8.1%, BEVs gain 9.7% to 133,062 and 16.1% share vs. 15.7%, HEVs are up 12.6% to 111,136 and 13.4% vs. 12.8% and PHEV soar 31.5% to 64,918 and 7.8% share vs. 6.4% last year.
Over in the brands ranking, Volkswagen (+15.5%) surges to 9.1% share vs. 8.2% so far this year, it is a distant leader this month once again. Audi (-9.6%) is handicapped by a particularly high year-ago result when it ranked #1 for the first time. It still achieves a very solid result at 7.2% share. BMW soars 29% to remain in third place and ranks #2 year-to-date. Kia (-0.7%) is stable and gains one spot on last month to #4 with Mercedes (+33.4%) up three ranks to #5. Ford (-31.4%) is in freefall at #6, that’s not as bad as the 7th place it held in March but still depressing nonetheless. Note Ford still ranked #2 overall over the Full Year 2023 but is #5 year-to-date. In contrast MG (+14.6%) scores another very satisfying result at #7 and 4.9% share, equally its ranking record also reached in January 2023, and its 2nd best share after the 5.6% it also hit in January 2023. Below Hyundai (-2.1%) and Toyota (-17.9%), Skoda (+16.6%) is very strong at #10 vs. #12 year-to-date. Further down, Seat (+81%), Renault (+59.2%), Cupra (+20%) and Honda (+18.3%) impress year-on-year. BYD (+2738.1%) continues to progress and breaks into the UK Top 30 for the first time at #29.
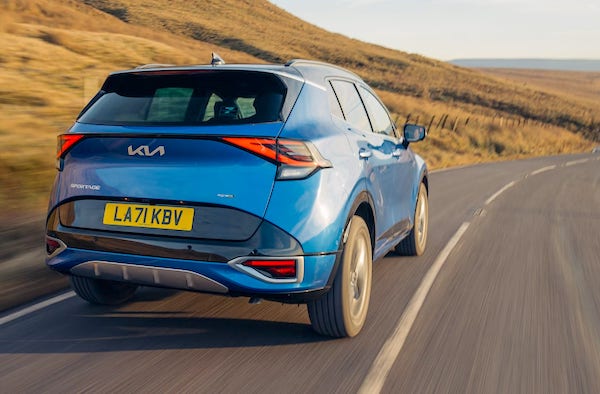
In the models lane, the Kia Sportage (+79.3%) lodges a third monthly in after January 2022 and January 2024, noting that only 2.8% share is enough to take the first spot. The Ford Puma (-8.9%) drops to #2 but easily stays in the YTD pole position while the Kia Sportage advances to #2. The Audi A3 (stable) repeats at #3 which is its ranking record. The VW Golf (+20.5%) confirms its return to shape and ascends to #5 year-to-date vs. #12 over the Full Year 2023. It’s another difficult month for the Vauxhall Corsa (-11.8%) which however reappears both in the monthly Top 10 at #5 and the YTD Top 10 at #10. The VW Polo (+57.2%) signs another excellent month but this is still not enough to enter the YTD Top 10. The MG ZS (+47.3%) also shines in the remainder of the Top 10.
Previous month: UK April 2024: VW Polo surges to #2, Audi A3 breaks ranking record
One year ago: UK May 2023: Audi signs first ever monthly win, Ford Puma #1 YTD
Full May 2024 Top 47 All brands and Top 10 models below.
UK May 2024 – brands:
PosBrandMay-24%/23Apr2024%/23PosFY231Volkswagen13,5039.1%+ 15.5%168,0948.2%+ 5.7%112Audi 10,6737.2%– 9.6%253,3886.5%– 4.5%333BMW 10,3537.0%+ 29.0%356,2806.8%+ 38.4%244Kia8,9176.0%– 0.7%550,0456.0%+ 1.8%465Mercedes 7,7585.3%+ 33.4%842,8735.2%+ 23.8%796Ford 7,5205.1%– 31.4%448,2395.8%– 16.4%527MG7,2234.9%+ 14.6%1135,7324.3%+ 11.6%11118Hyundai7,1074.8%– 2.1%737,2064.5%– 1.9%10109Toyota6,8344.6%– 17.9%640,0494.8%– 14.1%8510Skoda6,6714.5%+ 16.6%931,1083.8%+ 11.1%121211Nissan 6,6024.5%+ 1.8%1045,8055.5%+ 22.7%6812Vauxhall 6,0264.1%– 32.1%1339,0764.7%– 1.3%9713Volvo5,7073.9%+ 18.0%1224,1392.9%+ 18.0%151514Land Rover4,7303.2%+ 39.5%1427,6003.3%+ 18.8%141415Peugeot 4,5043.0%– 12.9%1530,1003.6%+ 17.1%131316Renault3,7982.6%+ 59.2%1622,5852.7%+ 72.1%161817Seat3,5722.4%+ 81.0%1718,1552.2%+ 33.3%171918Tesla3,1522.1%– 8.3%2616,2722.0%– 12.5%191619Dacia2,6911.8%+ 5.9%1813,3491.6%+ 2.3%222220Mini2,6791.8%– 13.6%1917,5802.1%– 6.0%181721Cupra2,2891.5%+ 20.0%2111,2561.4%+ 23.6%242422Mazda2,1711.5%– 4.7%2311,1751.4%– 15.5%252123Citroen2,1001.4%– 4.8%2013,5821.6%– 3.0%212024Suzuki2,0321.4%+ 8.2%2211,2861.4%+ 11.0%232325Honda1,7811.2%+ 18.3%2415,4931.9%+ 28.1%202526Jaguar1,3630.9%+ 1.6%279,4511.1%+ 78.0%262927Lexus1,3400.9%– 8.2%286,5210.8%+ 33.0%292828Porsche1,3150.9%– 31.5%257,5790.9%– 23.1%272629BYD5960.4%+ 2738.1%322,2070.3%+ 2527.4%313830Fiat5230.4%– 44.9%296,9570.8%– 15.1%282731Polestar3140.2%– 69.6%302,0820.3%– 63.7%323032Jeep2970.2%+ 203.1%313,1320.4%+ 153.6%303133Alfa Romeo2340.2%+ 110.8%366820.1%+ 14.2%363534Subaru1820.1%+ 35.8%341,2230.1%+ 53.6%333235Smart1480.1%+ 825.0%339270.1%+ 618.6%344336KGM/SsangYong1310.1%+ 4.8%358730.1%+ 26.2%353437Ora1010.1%+ 206.1%396110.1%+ 136.8%373938Bentley680.0%– 37.6%384090.0%– 38.3%393739Genesis570.0%– 45.2%373730.0%– 33.9%403640DS540.0%– 72.9%404930.1%– 60.6%383341Fisker440.0%new452580.0%new424542Maserati400.0%– 46.7%412390.0%– 47.9%434043Abarth380.0%+ 8.6%433470.0%+ 92.8%414144Ineos250.0%– 86.3%441210.0%– 56.2%454245Alpine190.0%– 45.7%421970.0%+ 38.7%444446Maxus10.0%– 66.7%4630.0%– 57.1%464747Chevrolet00.0%n/a –10.0%n/a4746 –Other British1790.1%– 19.7% –1,2510.2%– 12.9% – – –Other Imports2160.1%+ 57.7% –1,0960.1%+ 58.4% – –
UK May 2024 – models:
PosModelMay-24%/23Apr2024%/23PosFY231Kia Sportage4,2022.8%+ 79.3%620,0262.4%+ 33.7%242Ford Puma3,8122.6%– 8.9%123,2052.8%+ 34.0%113Audi A33,0172.0%– 0.0%316,5202.0%+ 39.2%494VW Golf2,9222.0%+ 20.5%515,5731.9%+ 35.1%5125Vauxhall Corsa2,6711.8%– 11.8%n/a12,9251.6%– 24.2%1036VW Polo2,6691.8%+ 57.2%2n/an/an/an/a167Nissan Qashqai2,6371.8%– 16.0%419,6872.4%+ 17.5%328MG ZS2,6301.8%+ 47.3%n/an/an/an/an/a189Hyundai Tucson2,6131.8%– 3.7%n/an/an/an/an/a610Nissan Juke2,4681.7%– 2.6%n/a15,5381.9%+ 2.7%68n/aVW T-Roc2,2271.5%+ 43.9%713,3231.6%+ 10.5%920n/aMG HS2,0601.4%– 4.4%814,1611.7%+ 39.2%813n/aBMW 1 Series1,9801.3%+ 8.4%n/a14,1901.7%+ 85.2%722
Source: SMMT


