France May 2024: First market decline in 22 months, Toyota (+31.3%) and Opel (+27.9%) stand out
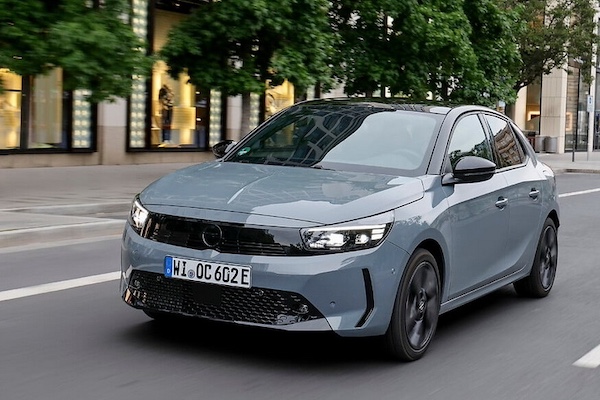
The Opel Corsa signs its first Top 10 finish since August 2020.
In May, the French new car market registers its first year-on-year decline since July 2022 at -2.9% to 141,298 units. This is to be compared to the 193,000 sales of pre-pandemic May 2019. Petrol sales sink -20% to 43,046 units and 31.4% share, overtaken for the first time by HEVs up 40% to 44,396 and 30.7%. PHEVs are off -19.4% to 10,201 and 7.2% share while diesel dives -24.5% to 11,448 and 8.1%. BEVs, despite de demise of Tesla, still grow at +5.4% to 23,887 and 16.9% share. Private sales drop -1.8% to 59,657 and 42.2% share. Among private sales, leases have become the norm. Leases with purchase option are up 15% to 36% of private sales and long term leases soar 42% to 29% share. All in all, leasing corresponds to 65% of private sales in May vs. 50% a year ago in May 2023. Short term rentals gain 2.6% to 22,354 while demo sales are up 1.9% to 16,778.
Renault (+0.4%) is stable to clearly win the brands race with an excellent 18.6% share. Peugeot (-11.8%) is in difficulty at #2 with 13.9% of the market, and sees its gap with Renault increase to 8,500 units over the first five months of the year. Dacia (-15.3%) suffers but stays in 3rd place just above Volkswagen (+5.5%). Toyota (+31.3%) lodges another great performance – the largest gain in the Top 18 – but falls back to #5 vs. #4 year-to-date. Citroen (-9.5%) disappoints again at a low 6th position. The remainder of the Top 10 is entirely in positive, with Opel (+27.9%) being the most dynamic above BMW (+15.8%), Audi (+13.5%) and Ford (+3.2%). As for the bad news, Tesla is off -45.2% to #16 and MG down -65.3% to #25. We welcome Chinese fare Xpeng at #47 with its first 10 French sales.
Model-wise, the Renault Clio (-6.2%) claims its first monthly win of the year despite a year-on-year loss. The Peugeot 208 (+3.1%) is relegated to 2nd place but easily retains the YTD top spot with a 5,600-unit gap. The Dacia Sandero (+4.1%) and Peugeot 2008 (+6.4%) camp on their April ranking at #3 and #4 respectively. The Renault Captur (+13.1%) advances one spot on last month to #5 while the Renault Arkana (-11.2%) surges 7 ranks to #6, the nameplate’s ranking record also reached exactly one year ago in May 2023. The Citroen C3 (-24.9%) and Peugeot 308 (-26.3%) struggle below whereas the Opel Corsa (+65.1%) is the best-selling “foreigner” for the month at #10, overtaking the Toyota Yaris (-3.5%). This is the Corsa’s first incursion inside the French Top 10 since August 2020. The Renault Twingo (+147.4%), Citroen C3 Aircross (+64.2%), VW Golf (+60.3%) and Ford Puma (+28%) all shine below. The Toyota C-HR (+269.9%) is up to #18, its highest ranking since August 2020 (#15). We welcome the VW Tiguan III (#25) and Peugeot 3008 III (#33). The Peugeot 208 (2,662 sales) is the best-selling BEV for the month above the Renault Twingo (1,688) and Renault Megane E-Tech (1,618). The Toyota Yaris (2,539) is the #1 HEV ahead of the Renault Clio (2,229) and Renault Austral (2,124) and the Cupra Formentor (916) is the most popular PHEV above the Mercedes GLC (512) and Citroen C5 Aircross (477).
Previous month: France April 2024: Market up 10.9%, Toyota breaks monthly volume record
One year ago: France May 2023: Renault and Clio in charge again, Arkana up to record #6
Full May 2024 Top 58 All brands and Top 60 models below.
France May 2024 – brands:
PosBrandMay-24%/23Apr2024%/23PosFY231Renault 26,25118.6%+ 0.4%1116,21415.9%+ 4.3%112Peugeot 19,69513.9%– 11.8%2107,75114.7%– 0.2%223Dacia 10,5977.5%– 15.3%362,8198.6%– 3.5%334Volkswagen10,4347.4%+ 5.5%545,3866.2%– 5.3%655Toyota9,8607.0%+ 31.3%454,1887.4%+ 38.1%466Citroen 8,9116.3%– 9.5%653,0677.2%– 1.7%547BMW 5,3463.8%+ 15.8%727,9883.8%+ 26.2%788Audi 4,3103.1%+ 13.5%1019,0332.6%– 1.1%11119Opel 4,2043.0%+ 27.9%1121,2212.9%+ 26.0%81410Ford 4,1783.0%+ 3.2%820,5642.8%– 0.6%91011Mercedes 3,9122.8%+ 10.5%1420,1412.7%+ 18.7%10912Hyundai3,7282.6%+ 4.8%918,7722.6%– 3.3%131213Skoda 3,5472.5%+ 25.0%1216,3862.2%+ 17.3%151614Kia 3,2732.3%– 18.3%1318,8932.6%+ 2.1%121315Fiat 2,8092.0%– 27.7%1717,3922.4%+ 13.6%141516Tesla2,1971.6%– 45.2%1815,6852.1%– 16.0%16717Nissan 2,1911.6%– 25.7%1512,5461.7%– 19.7%171718Suzuki2,1821.5%+ 22.2%1610,8641.5%+ 38.7%182119Seat 2,0081.4%+ 41.0%199,2431.3%+ 15.5%192220Cupra1,6901.2%+ 36.6%216,6320.9%+ 36.4%232421Volvo1,4741.0%+ 24.8%208,9001.2%+ 57.4%202322DS1,3601.0%– 39.6%238,5371.2%– 21.8%212023Mini1,3601.0%– 34.2%248,0081.1%– 25.0%221924Jeep9150.6%+ 20.1%224,5690.6%+ 99.2%252625MG8610.6%– 65.3%256,4550.9%– 28.5%241826Mazda8050.6%+ 16.7%273,3020.5%– 11.1%262527Land Rover5710.4%+ 9.4%262,9420.4%+ 10.3%272728Lexus5190.4%+ 65.3%282,4980.3%+ 77.0%292829Porsche4050.3%+ 83.3%292,5230.3%+ 98.8%283130Alfa Romeo2950.2%+ 19.9%311,8120.2%+ 23.3%313031Mitsubishi2720.2%+ 85.0%321,3770.2%+ 33.4%323432Honda2680.2%+ 11.2%302,0430.3%+ 48.9%302933Alpine2350.2%– 17.8%331,0040.1%+ 55.7%343334Smart1300.1%+ 44.4%359610.1%+ 119.9%353535BYD1290.1%+ 108.1%341,3300.2%+ 1827.5%333836Abarth1030.1%n/a366990.1%n/a363737Ferrari410.0%+ 127.8%381330.0%+ 17.7%404038Jaguar320.0%– 51.5%391760.0%– 49.6%383639Lotus280.0%+ 2700.0%44620.0%+ 933.3%444340Lynk & Co260.0%– 95.4%373480.0%– 78.4%373241Aiways250.0%+ 1150.0%43910.0%+ 46.8%414542VinFast220.0%new55350.0%ne495443Fisker170.0%new40670.0%new434744Lancia150.0%new41700.0%new42 –45Maserati120.0%+ 20.0%42380.0%– 26.9%464246Lamborghini110.0%+ 57.1%47350.0%+ 25.0%484447Xpeng100.0%new –100.0%new55 –48Caterham80.0%– 71.4%45580.0%+ 31.8%454849Aston Martin50.0%+ 66.7%49160.0%– 20.0%524650Secma40.0%+ 0.0%51130.0%– 23.5%535051Subaru30.0%+ 0.0% –170.0%+ 112.5%515252Morgan30.0%+ 50.0%52130.0%+ 44.4%545153Bentley30.0%+ 0.0%5090.0%– 52.6%564954Minimoke20.0%new48370.0%neww476455Seres (ex DFSK)20.0%– 80.0% –240.0%– 71.1%504156McLaren20.0%+ 0.0%5370.0%+ 75.0%575357Leapmotor10.0%– 98.1%461590.0%+ 26.2%393958KTM10.0%n/a –10.0%n/a6468
France May 2024 – models:
PosModelMay-24%/23Apr2024%/23PosFY231Renault Clio7,8935.6%– 6.2%238,9255.3%+ 10.5%212Peugeot 2087,6655.4%+ 3.1%144,5196.1%+ 15.8%123Dacia Sandero5,7764.1%+ 4.1%334,9554.8%+ 21.3%334Peugeot 20085,5733.9%+ 6.4%423,8373.3%+ 4.7%555Renault Captur4,6253.3%+ 13.1%620,6482.8%+ 4.6%666Renault Arkana3,7482.7%– 11.2%139,1841.3%– 28.2%20157Citroen C3 III3,6262.6%– 24.9%525,6073.5%+ 9.5%448Peugeot 308 III2,7762.0%– 26.3%717,6112.4%– 7.2%779Dacia Duster II2,7011.9%– 5.4%1013,6791.9%+ 1.2%91010Opel Corsa2,6371.9%+ 65.1%1711,0401.5%+ 36.9%142511Toyota Yaris2,5611.8%– 3.5%814,4432.0%+ 35.3%81612Renault Twingo2,4691.7%+ 147.4%1211,2571.5%+ 75.0%132813Ford Puma2,3011.6%+ 28.0%159,9071.4%+ 16.6%162014Renault Austral2,2871.6%– 27.0%1112,1951.7%– 7.3%111315VW T-Roc2,1141.5%+ 3.1%187,7681.1%– 8.5%232116Citroen C3 Aircross2,0841.5%+ 64.2%349,8181.3%+ 7.0%172217Toyota Yaris Cross2,0781.5%+ 5.1%912,9931.8%+ 9.9%101118Toyota C-HR II1,7311.2%+ 269.9%326,2420.9%+ 33.7%323519Dacia Jogger1,7251.2%– 21.8%1410,8301.5%+ 6.7%151820Renault Megane E-Tech1,6181.1%+ 10.3%208,0991.1%+ 13.9%222721VW Golf1,5821.1%+ 60.3%276,9931.0%+ 42.7%243422VW Polo1,5591.1%– 32.0%256,8410.9%– 40.6%251723Hyundai Tucson1,4861.1%+ 2.6%226,7750.9%– 12.5%262624Tesla Model Y1,4511.0%– 46.4%299,3601.3%– 30.2%19825VW Tiguan III (est)1,3651.0%newn/a1,5650.2%new93 –26Kia Sportage1,3190.9%+ 40.3%366,3700.9%+ 19.8%303627Citroen C4 III1,3140.9%– 17.6%218,7311.2%+ 7.3%213028Citroen C5 Aircross1,2430.9%– 8.9%396,7320.9%– 28.8%282429BMW X11,1640.8%+ 21.1%306,7400.9%+ 63.0%273930VW ID.31,1440.8%+ 208.4%592,6180.4%+ 37.3%728531VW T-Cross1,1180.8%+ 82.1%316,6150.9%+ 33.0%294432Fiat 5001,1100.8%– 68.3%1611,4171.6%– 12.6%12933Peugeot 3008 III1,0440.7%new1252,0200.3%new8822634Toyota Corolla1,0310.7%+ 16.9%266,1720.8%+ 39.9%334235Cupra Formentor1,0260.7%+ 30.4%553,9500.5%+ 24.4%505336Toyota Aygo X1,0150.7%+ 12.0%196,3140.9%+ 42.3%313837Renault Espace1,0120.7%+ 988.2%384,6510.6%+ 2023.7%417438Nissan Qashqai9910.7%– 42.5%245,9360.8%– 27.7%352939Peugeot 5008 II9840.7%– 46.8%535,7750.8%– 22.7%363240Seat Ibiza9740.7%+ 204.4%374,3790.6%+ 37.3%447041Audi Q39680.7%+ 28.4%424,2000.6%+ 8.0%474742BMW iX19320.7%+ 403.8%584,1830.6%+ 570.4%4810043Nissan Juke9310.7%+ 46.4%454,7700.7%+ 24.8%374544Hyundai Kona9270.7%+ 7.9%284,7690.7%– 0.6%384145Peugeot 3008 II9020.6%– 68.1%239,5821.3%– 34.3%181246Opel Mokka8600.6%+ 45.8%513,9400.5%– 3.3%515147BMW Série 18530.6%– 8.1%434,4210.6%+ 1.0%434648Toyota RAV48140.6%+ 113.1%353,8850.5%+ 91.9%536549Suzuki Swift8080.6%+ 9.2%524,6780.6%+ 28.8%404850Skoda Fabia8000.6%+ 25.4%483,5830.5%+ 17.8%565851Ford Kuga7670.5%– 34.9%444,5050.6%– 18.7%423752Tesla Model 37630.5%– 31.3%626,0900.8%+ 30.7%341953VW Taigo6750.5%– 11.2%403,5910.5%– 16.0%555054Kia Picanto6620.5%– 1.9%473,1430.4%+ 35.9%626955Seat Arona6590.5%+ 81.5%642,8580.4%+ 14.1%698856Audi Q26580.5%+ 63.3%652,6150.4%+ 6.6%737357Audi A36540.5%– 2.1%543,6710.5%+ 8.6%545658Suzuki Vitara6430.5%+ 67.0%572,8890.4%+ 93.1%679259Jeep Avenger6420.5%+ 92.2%413,0760.4%+ 821.0%6413360Mercedes GLA6280.4%– 12.0%613,9690.5%+ 2.8%4940
Source: AAA Data, PFA


