
Spain May 2024: Rental sales push market up 3.4%, Citroen C3 best-seller for the first time
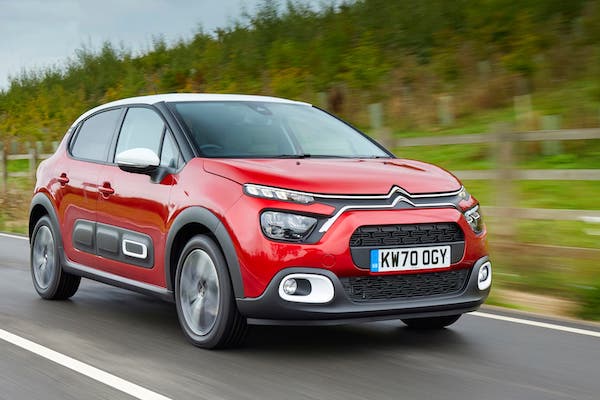
Dealerships rush to register the outgoing generation of Citroen C3
New car sales in Spain gain 3.4% year-on-year in May to 95,158 units, leading to a year-to-date tally up 6.8% to 431,884. The 5 months figure however remains -23% below the same period in pre-pandemic 2019. Notably, 9,180 rechargeable vehicles (BEV+PHEV) were registered, a -11.9% year-on-year loss to 9.6% share two percentage points below its year-ago level. Year-to-date rechargeable sales increase by 3.5% to 45,154 units or 10.4% share vs. 10.8% over the same period in 2023. For May, private sales augment 2.5% to 37,421, company sales drop -10.9% to 30,138 while rental cars account for the majority of the overall lift at +27.1% to 27,599. Year-to-date, private sales are up 8% to 178,583, company sales down -12.2% to 143,316 and rental sales soar 45.3% to 109,985. In terms of regions, Madrid (+10.5%) scores the 2nd largest gain, and given it accounts for 51.2% of the market it almost single-handedly pushes the overall sales up. Baleares is the most dynamic at +27.7%.
In the brands ranking, Toyota (+4.4%) remains ultra dominant at 8.6% share, almost two percentage points above the #2, Hyundai (+11.6%). Peugeot (-6.6%) is in difficulty year-on-year but rallies back up four spots on April to #3. It advances to #4 year-to-date and distances Volkswagen (-4.6%), Renault (-6.3%) and Kia (-15.2%) all losing ground. Seat (+4.4%) edges past the market growth but ranks at a lowly #7 vs. #2 year-to-date. Once again Citroen (+22.5%) is in great shape at #8 followed by Dacia (+3.8%) and Mercedes (+6.7%). BMW (+35.5%), Nissan (+64.3%), Volvo (+55%) and Ssangyong (+856.9%) stand out below. Chinese Omoda is up to #25 with 0.8% share.
Model-wise, the Citroen C3 (+505.8%) brilliantly takes the lead for the first time in the nameplate’s history in Spain. This performance doesn’t signal a sudden surge of popularity but rather the large amount of registrations of the outgoing generation which doesn’t meet the upcoming GSR2 EU safety norms. The Peugeot 2008 (+104.8%) surges 19 spots on last month to #2, toppling the Dacia Sandero (-10.2%) and Renault Clio (-15.7%). The Hyundai Tucson (+12.1%) is up four ranks to #5 ahead of the Toyota Corolla (-1.8%) and Opel Corsa (+2.9%). The Seat Ibiza (+34.9%) soars year-on-year but drops six spots on last month to #8. The Kia Sportage (-0.6%) is stable in 9th place while the MG ZS (-12.8%) skids to #10. Below, notice the Toyota RAV4 (+191.7%), BMW X1 (+115.7%), Ford Focus (+77.9%) and Nissan Qashqai (+60.6%) all in excellent shape.
Previous month: Spain April 2024: Citroen C3, Toyota Yaris outstanding in market up 23.1%
One year ago: Spain May 2023: Dacia Sandero #1, MG ZS repeats at #6
Full May 2024 Top 58 All brands and Top 310 All models below.
Spain May 2024 – brands:
PosBrandMay-24%/23Apr2024%/23PosFY231Toyota8,1878.6%+ 4.4%140,0949.3%+ 17.5%112Hyundai6,4336.8%+ 11.6%426,5396.1%+ 12.2%543Peugeot6,2496.6%– 6.6%726,8766.2%– 9.7%464Volkswagen6,2406.6%– 4.6%327,5316.4%– 1.6%335Renault6,2186.5%– 6.3%524,7515.7%+ 2.7%776Kia5,2825.6%– 15.2%826,0046.0%– 7.3%627Seat5,0735.3%+ 4.4%227,9376.5%– 1.7%258Citroen4,9925.2%+ 22.5%920,4124.7%+ 8.6%9109Dacia4,7064.9%+ 3.8%621,7215.0%+ 12.1%8810Mercedes4,1754.4%+ 6.7%1019,0234.4%+ 9.4%10911BMW4,1464.4%+ 35.5%1118,8484.4%+ 47.9%111212Opel3,3903.6%+ 7.1%1413,3773.1%– 7.6%151613Audi3,3623.5%– 18.9%1315,4583.6%– 12.1%121114Ford3,3403.5%+ 19.4%1711,2032.6%– 22.7%171415Skoda2,8853.0%– 1.8%1214,9113.5%+ 14.7%141316Nissan2,5722.7%+ 64.3%1815,0933.5%+ 57.1%131717MG2,4892.6%– 11.0%1611,6972.7%+ 38.9%161518Cupra2,0952.2%– 5.8%158,9032.1%– 2.7%181919Fiat1,6341.7%– 16.8%207,9541.8%– 21.9%191820Volvo1,5611.6%+ 55.0%197,6701.8%+ 65.4%202121Mazda1,3901.5%+ 10.8%216,6631.5%+ 4.8%212022Jeep1,2261.3%+ 17.1%225,1701.2%+ 39.0%232323SsangYong1,1771.2%+ 856.9%242,7740.6%+ 314.6%263524Tesla1,1121.2%– 4.1%235,6061.3%+ 57.8%222225Lexus8220.9%– 1.6%253,4510.8%+ 16.2%242526Omoda7600.8%+ 75900.0%281,5120.4%+ 75600.0%334527Suzuki5330.6%– 18.9%312,7090.6%+ 10.7%272628Mini5110.5%– 41.2%263,3200.8%– 6.7%252429DS3660.4%+ 2.2%272,0380.5%+ 9.2%292830Porsche3650.4%+ 17.0%291,9740.5%+ 28.4%303031Alfa Romeo3290.3%+ 35.4%321,6600.4%+ 8.4%313232Honda2980.3%+ 131.0%301,6290.4%+ 84.7%323333Mitsubishi2810.3%– 28.7%352,6440.6%+ 58.7%282734Land Rover2750.3%+ 2.2%331,3990.3%– 0.8%343135BYD2030.2%+ 625.0%349210.2%+ 1605.6%353936Subaru950.1%– 57.8%365240.1%– 38.5%373437Smart940.1%+ 67.9%385460.1%+ 135.3%363738Lynk & Co890.1%– 90.5%374400.1%– 82.1%382939Maserati310.0%– 18.4%411390.0%– 33.2%404240Evo300.0%+ 1400.0%421310.0%+ 2520.0%414641Jaguar250.0%– 66.2%391730.0%– 43.1%394042Abarth230.0%– 54.9%441010.0%– 32.2%434343Dongfeng Sokon (DFSK)200.0%+ 0.0%40960.0%– 15.0%444444SWM170.0%– 60.5%46470.0%– 44.7%454145Polestar150.0%– 85.0%431030.0%– 58.6%423846Alpine80.0%+ 166.7%51290.0%+ 45.0%495147Ferrari60.0%– 14.3%48370.0%– 2.6%474848Lamborghini50.0%+ 0.0%52210.0%– 22.2%525249Voyah50.0%new –50.0%new556450Aston Martin40.0%+ 33.3%47260.0%+ 85.7%505351Yudo30.0%new45390.0%new465852Bentley30.0%– 57.1%49260.0%+ 4.0%514953Ineos20.0%– 81.8%50350.0%+ 218.2%484754BAIC20.0%new –20.0%new59 –55Zhidou10.0%– 75.0% –40.0%– 63.6%565456Skywell10.0%new5430.0%new586757McLaren10.0%n/a –20.0%+ 100.0%615658Genesis10.0%new –10.0%new64 –
Spain May 2024 – models:
PosModelMay-24%/23Apr2024%/23PosFY231Citroen C3 2,8233.0%+ 505.8%58,7342.0%+ 103.4%8182Peugeot 20082,7132.9%+ 104.8%218,8262.0%+ 0.9%653Dacia Sandero2,5272.7%– 10.2%113,0683.0%+ 15.6%114Renault Clio2,0212.1%– 15.7%38,7032.0%+ 38.3%9115Hyundai Tucson1,9872.1%+ 12.1%99,1692.1%+ 17.6%466Toyota Corolla1,9452.0%– 1.8%810,1432.3%+ 29.5%237Opel Corsa1,9102.0%+ 2.9%107,6981.8%– 9.5%11158Seat Ibiza1,8592.0%+ 34.9%29,2022.1%+ 21.0%3109Kia Sportage1,8191.9%– 0.6%157,4341.7%– 5.8%13810MG ZS1,6851.8%– 12.8%118,4332.0%+ 89.2%10411Toyota Yaris1,6281.7%+ 6.1%67,5281.7%+ 36.5%122012Seat Arona1,6161.7%– 18.8%49,0912.1%– 22.3%5213VW T-Roc1,5321.6%– 3.5%76,6841.5%– 4.8%15914Toyota C-HR1,4211.5%– 10.1%306,0761.4%– 33.6%19715Nissan Qashqai1,3941.5%+ 60.6%238,7382.0%+ 46.0%71216Toyota RAV41,3741.4%+ 191.7%166,0951.4%+ 112.4%174317Ford Focus1,3501.4%+ 77.9%822,8310.7%– 24.7%574718Hyundai i201,3241.4%+ 35.4%195,1361.2%+ 20.8%252719Fiat 5001,2951.4%– 12.6%365,9091.4%– 20.9%201320Hyundai Kona1,2811.3%+ 11.5%185,1141.2%+ 20.3%272321Audi Q31,2801.3%+ 52.9%294,6681.1%+ 7.2%312822VW Taigo1,2741.3%+ 27.7%553,6770.9%– 5.9%413623Renault Captur1,2671.3%– 16.5%176,4041.5%+ 11.5%161624BMW X11,1951.3%+ 115.7%264,7031.1%+ 71.0%303825Dacia Duster1,1741.2%+ 15.2%245,0271.2%– 3.1%281926Ford Kuga1,0961.2%+ 41.6%343,6330.8%– 19.5%423127Cupra Leon1,0941.1%+ 72.3%323,3220.8%+ 37.8%475528Renault Austral1,0711.1%– 0.6%314,0260.9%– 0.7%363929VW T-Cross1,0501.1%– 10.7%125,6831.3%+ 5.9%213030Renault Arkana1,0501.1%+ 24.7%623,1670.7%– 28.4%523231Peugeot 2081,0401.1%– 52.3%206,0941.4%– 9.2%181732Kia Stonic1,0391.1%+ 3.8%415,2861.2%+ 3.9%232233Peugeot 30081,0151.1%– 27.2%225,2091.2%– 16.8%242534Dacia Jogger9531.0%+ 55.2%593,1970.7%+ 60.3%515435Toyota Yaris Cross9401.0%– 46.2%146,8701.6%+ 4.0%141436Cupra Formentor8890.9%– 38.8%135,1191.2%– 13.7%262637Hyundai i308690.9%+ 29.1%502,9070.7%+ 10.6%555838VW Tiguan8590.9%– 17.5%284,0110.9%– 13.5%383339Citroen C48410.9%– 32.2%434,7951.1%– 23.2%292440Skoda Fabia8260.9%+ 112.9%512,9510.7%+ 97.4%547841Seat Ateca8140.9%– 8.4%523,2140.7%– 54.2%502142Skoda Kamiq8050.8%+ 63.3%354,0260.9%+ 20.8%374143Nissan Juke8040.8%+ 106.7%444,5901.1%+ 186.2%326344Mercedes GLA8020.8%+ 5.9%383,7650.9%+ 51.4%395045Tesla Model 37920.8%+ 37.3%543,4380.8%+ 246.9%465746Kia Niro7890.8%– 3.8%464,3751.0%+ 10.4%333547Ford Puma7820.8%– 14.3%274,2381.0%+ 13.2%342948BMW 1-Series7700.8%+ 61.4%483,1330.7%+ 55.6%537249Peugeot 3087670.8%– 14.8%403,5190.8%– 6.8%445250Omoda 57530.8%+ 75200.0%691,4900.3%+ 74400.0%8523451Volvo XC407440.8%+ 89.3%373,6190.8%+ 73.7%434952VW Polo6750.7%– 14.6%672,8360.7%– 4.0%564253Mercedes GLC6740.7%+ 7.2%333,7200.9%+ 13.2%404054Jeep Avenger6560.7%– 4.8%662,7160.6%+ 165.8%606655Audi A36440.7%– 27.1%573,2710.8%– 3.1%484456Toyota Aygo X6200.7%+ 110.2%611,8480.4%+ 105.6%719657Seat Leon6120.6%+ 61.5%255,3351.2%+ 269.2%225358Citroen C3 Aircross6070.6%– 46.2%394,1781.0%– 3.1%353459Kia Ceed6000.6%+ 4.5%492,8240.7%+ 5.9%584660SsangYong Tivoli/Grand5990.6%+ 698.7%471,6940.4%+ 388.2%7514261VW Golf5800.6%+ 9.8%423,2420.8%+ 44.0%495662Hyundai i105510.6%+ 9.1%791,7240.4%+ 0.9%747363Opel Crossland5500.6%+ 27.9%831,6740.4%– 3.1%788664Mercedes A Class5450.6%– 30.4%532,6410.6%+ 2.0%624865MG HS/eHS5420.6%+ 38.3%642,0470.5%– 12.1%666166Kia Xceed5140.5%– 47.7%563,4440.8%– 11.4%453767Mazda CX-304810.5%+ 51.3%752,1440.5%+ 39.5%647768Audi A14810.5%– 34.6%771,7880.4%– 35.8%735969Citroen C5 Aircross4700.5%– 53.7%731,6880.4%– 45.6%766070Peugeot 50084610.5%– 18.8%762,0440.5%– 28.7%677671Opel Mokka4520.5%+ 10.5%601,9590.5%+ 14.6%697472Mercedes C Class4020.4%– 5.0%891,6860.4%– 10.7%778073Audi Q23990.4%– 22.5%452,6960.6%+ 22.9%616474Lexus LBX3900.4%new948180.2%new114 –75Skoda Karoq3790.4%– 47.0%632,7560.6%– 11.5%594576Volvo EX303670.4%neww909970.2%new10424977Nissan X-Trail3580.4%+ 39.8%951,6000.4%+ 80.0%839778Skoda Octavia3480.4%– 24.2%712,2360.5%+ 36.2%637979BMW 3-Series3310.3%+ 87.0%781,6430.4%+ 138.1%8110280SsangYong Korando/C3003290.3%+ 897.0%1376360.1%+ 170.6%12718681BMW X33220.3%+ 1.6%701,6710.4%+ 29.3%797582Tesla Model Y3140.3%– 41.4%842,1090.5%– 12.2%655183Hyundai Bayon3020.3%– 40.8%812,0370.5%+ 0.3%686584Mercedes CLA2990.3%+ 47.3%911,2430.3%– 18.6%918885BMW X22990.3%+ 13.3%1051,2160.3%+ 21.7%9210086Mazda CX-52970.3%– 33.7%871,6130.4%– 10.7%826987Kia Picanto2940.3%+ 13.5%681,5140.4%+ 8.3%848388Jeep Compass2880.3%+ 61.8%801,1390.3%– 24.8%969389Opel Grandland2880.3%+ 5.5%989750.2%– 6.3%10510590Mini Hatch (est)2830.3%– 41.2%741,8370.4%– 6.8%726791Renault Megane2790.3%– 59.3%921,0270.2%– 66.1%1036292Lexus NX2750.3%+ 15.5%881,4320.3%+ 45.8%879893Mazda32640.3%+ 20.5%1021,2470.3%– 8.1%909194Jeep Renegade2610.3%+ 56.3%1071,2020.3%+ 11.6%949095Mercedes V Class2540.3%+ 25.7%859140.2%+ 3.3%10911096Volvo XC602470.3%– 34.8%581,8940.4%+ 18.8%707197Fiat Panda2440.3%– 28.2%721,6440.4%+ 26.9%808198Alfa Romeo Tonale2430.3%+ 50.0%1031,1880.3%+ 15.2%9511299Skoda Kodiaq2290.2%– 57.0%939690.2%– 32.7%10785100Renault Espace2250.2%+ 462.5%969720.2%+ 1196.0%106127101BMW 2-Series2220.2%– 25.0%1011,3930.3%+ 28.7%8892102DS 7 Crossback2180.2%+ 36.3%991,2150.3%+ 40.1%93104103Mercedes B Class2120.2%+ 73.8%1285850.1%+ 28.6%129139104BMW X42080.2%+ 2.5%1068660.2%+ 14.6%111109105Citroen C4 X2080.2%+ 112.2%1138470.2%+ 73.6%112128106Renault Rafale1940.2%new2422180.1%new175309107Opel Astra1900.2%– 3.6%1201,0700.2%– 28.2%10099108BMW 4-Series1900.2%– 21.2%1101,0330.2%+ 0.5%102106109Ssangyong Torres1900.2%new1972740.1%new161227110Mercedes GLE1880.2%– 17.9%1088920.2%– 29.5%110101111MG 41750.2%– 60.1%971,0750.2%– 23.1%9989112Mercedes GLB1750.2%– 21.5%1049160.2%– 25.4%10894113Seat Tarraco1720.2%– 23.9%861,0950.3%+ 70.6%98111114Mazda21650.2%– 0.6%1217940.2%+ 2.5%117114115Mini Countryman (est)1640.2%– 41.0%1001,0630.2%– 6.7%10195116Mercedes EQA1580.2%+ 146.9%1225790.1%+ 112.1%130135117Audi Q51570.2%– 70.3%1291,1240.3%– 43.3%9768118Skoda Scala1560.2%– 35.8%651,4440.3%– 2.4%8687119Suzuki Vitara1520.2%– 20.4%1417980.2%– 13.4%116103120Audi A41520.2%+ 22.6%1146390.1%+ 1.3%125116121Peugeot 4081490.2%– 45.2%1128000.2%– 12.9%115107122Mitsubishi ASX1420.1%– 18.4%1161,3040.3%+ 272.6%89122123BMW X51420.1%+ 3.6%1356440.1%+ 21.7%123125124Porsche Macan1330.1%+ 24.3%1196990.2%+ 18.7%118136125Mercedes CLE1250.1%new1175570.1%new131253126Mercedes E Class1250.1%+ 101.6%1184950.1%+ 37.1%135158127Volvo XC901150.1%+ 40.2%1156830.2%+ 56.7%119124128Skoda Enyaq1150.1%+ 74.2%1703480.1%+ 47.5%148169129Honda HR-V1120.1%+ 558.8%1385110.1%+ 119.3%133144130Kia EV61120.1%+ 38.3%1513110.1%– 20.5%157137131BMW ix11090.1%+ 19.8%1266360.1%+ 176.5%126141132Mazda CX-601040.1%+ 73.3%1395060.1%– 12.9%134118133Peugeot 5081040.1%+ 108.0%1433840.1%– 21.0%144140134Suzuki Jimny1020.1%+ 56.9%1563400.1%+ 31.3%149177135Toyota Corolla Cross1010.1%+ 3266.7%1256410.1%+ 21266.7%124185136VW ID.41010.1%– 1.9%1313180.1%+ 9.7%155134137Renault Scenic990.1%+ 395.0% –1140.0%– 4.2%209231138Porsche Cayenne930.1%– 13.1%1426060.1%+ 26.8%128146139BYD Atto 3930.1%+ 287.5%1233930.1%+ 793.2%143195140Lynk & Co 01890.1%– 90.5%1324400.1%– 82.1%13882141Lexus UX880.1%– 80.4%1098330.2%– 46.4%11384142Suzuki Swift870.1%+ 13.0%1454070.1%+ 38.9%141161143Kia Sorento860.1%+ 19.4%1276480.2%+ 111.1%120123144DS 4850.1%– 45.9%1244590.1%– 38.4%136132145Suzuki SX4 S-Cross830.1%– 50.9%1556470.1%+ 1.6%121121146Ford Mustang Mach-E810.1%+ 72.3%1493390.1%– 7.4%150157147Porsche 911790.1%+ 92.7%1363980.1%+ 106.2%142187148Alfa Romeo Stelvio770.1%+ 8.5%1304290.1%– 6.9%139138149Toyota Land Cruiser770.1%– 59.5%1663580.1%– 61.5%145117150Suzuki Ignis770.1%– 49.7%1923550.1%+ 27.7%147168151Audi A6770.1%– 18.9%1532700.1%– 25.2%162154152MG 3750.1%new –750.0%new228 –153Cupra Born740.1%– 36.2%1522700.1%– 53.4%163131154Honda Civic720.1%+ 140.0%1334490.1%+ 126.8%137183155Range Rover Evoque710.1%+ 24.6%1752760.1%– 37.3%160151156BMW X6700.1%+ 20.7%1623340.1%+ 27.0%152171157BMW ix2700.1%new1692310.1%new171 –158DS 3 Crossback630.1%+ 70.3%1113550.1%+ 58.5%146181159Land Rover Defender610.1%+ 60.5%1602990.1%+ 40.4%158170160Mitsubishi Colt590.1%new1816460.1%new122248161BMW 5-Series590.1%– 7.8%1473200.1%+ 1.3%154179162SsangYong Rexton590.1%+ 293.3%1461700.0%+ 93.2%189204163Audi Q4580.1%– 39.6%1643170.1%– 45.1%156120164Mercedes EQE570.1%+ 119.2%1682670.1%+ 110.2%165156165Range Rover Sport (est)550.1%– 31.3%1503370.1%+ 22.1%151160166BYD Seal530.1%new1402580.1%new167302167Dacia Spring520.1%– 40.2%1344290.1%– 50.8%140108168Smart #1520.1%+ 271.4%1592810.1%+ 1378.9%159167169Audi A5520.1%– 47.5%1482670.1%– 28.4%164155170Subaru Legacy510.1%– 22.7%1801600.0%– 18.8%194184171Mini Cabrio (est)500.1%– 41.2%1583240.1%– 6.6%153149172BMW i4500.1%– 13.8%1832250.1%+ 1.4%172162173Honda ZR-V490.1%new1842550.1%new170223174Mercedes T Class490.1%– 22.2%1652060.0%– 43.9%178153175VW Touran470.0%– 47.8%1822610.1%– 32.4%166145176Mercedes EQB460.0%+ 53.3%1872040.0%– 15.7%179166177Mitsubishi Eclipse Cross450.0%– 28.6%2141650.0%– 77.5%192129178VW Passat440.0%– 40.5%1932580.1%– 33.7%168150179Range Rover Velar440.0%+ 100.0%1721930.0%+ 12.9%182199180Citroen C5 X430.0%– 65.9%1781800.0%– 73.5%187126181Hyundai Ioniq5430.0%+ 0.0%2031260.0%– 58.4%205178182Smart #3420.0%new1881880.0%new183364183Mazda MX-5420.0%+ 7.7%1541550.0%+ 13.1%197205184Fiat 500X400.0%– 59.2%1892570.1%– 75.9%169115185BYD Dolphin380.0%new1712240.1%new174236186VW ID.3360.0%– 10.0%1862080.0%– 1.4%177163187Hyundai Santa Fe360.0%– 65.0%1902020.0%– 52.5%180148188Cupra Ateca360.0%+ 100.0%1771370.0%– 36.0%202194189Volvo S60360.0%+ 176.9%207970.0%+ 79.6%216240190Mitsubishi Space Star350.0%– 77.7%1735290.1%– 9.3%132130191Mazda MX-30330.0%n/a1741830.0%+ 863.2%185219192Honda Jazz330.0%+ 32.0%1611650.0%– 4.1%191203193Lexus RX330.0%– 46.8%2001380.0%– 18.8%201191194Fiat Tipo330.0%– 28.3%213590.0%– 83.4%236159195Range Rover (est)320.0%– 31.9%1791980.0%+ 20.7%181189196Suzuki Swace310.0%n/a2231580.0%+ 251.1%195193197Honda CR-V310.0%– 39.2%2781520.0%– 41.5%198172198BMW X7300.0%+ 42.9%1961450.0%+ 81.3%199221199Maserati Grecale300.0%– 3.2%2061170.0%– 26.9%207202200Porsche Taycan300.0%+ 50.0%234720.0%– 32.1%229197201Toyota bZ4X290.0%+ 866.7%2041760.0%+ 166.7%188229202Subaru Crosstrek290.0%new1571630.0%new193299203Lexus ES270.0%– 67.1%1631830.0%– 26.2%184176204Skoda Superb270.0%– 35.7%1671810.0%– 36.5%186165205Audi Q7270.0%– 59.7%2311050.0%– 57.5%211174206Mercedes S Class260.0%+ 4.0%2091180.0%+ 18.0%206222207Toyota Highlander250.0%+ 1150.0%2011440.0%+ 311.4%200225208VW Touareg240.0%+ 60.0%1991360.0%+ 28.3%203180209Hyundai Ioniq6240.0%+ 118.2%272460.0%– 43.9%247242210Abarth 500230.0%– 54.9%2251010.0%– 32.2%214198211Toyota GR86220.0%+ 15.8%1941170.0%+ 82.8%208201212Fiat 600220.0%new239860.0%new222283213Volvo C40200.0%– 70.1%1852090.0%+ 11.2%176173214Volvo V60200.0%– 51.2%2151300.0%– 27.4%204192215Jaguar F-Pace200.0%– 61.5%1951020.0%– 34.6%213206216Ford Mustang190.0%+ 46.2%240630.0%– 47.9%233213217BMW Z4180.0%+ 157.1%2101010.0%+ 98.0%215250218BYD Seal U180.0%new235280.0%new266 –219Audi Q8150.0%– 88.7%2082240.1%– 58.1%173133220Polestar 2150.0%– 85.0%2051030.0%– 58.6%212164221Mini Clubman (est)150.0%– 40.0%211960.0%– 6.8%217216222Hyundai Staria150.0%– 25.0%227760.0%– 38.7%226212223Kia Proceed150.0%– 44.4%229550.0%– 45.5%241230224Mercedes G Class140.0%+ 0.0%217930.0%+ 55.0%220237225Porsche Boxster140.0%+ 55.6%219920.0%+ 135.9%221256226Jeep Wrangler140.0%+ 7.7%176760.0%– 25.5%227226227Porsche Cayman140.0%+ 180.0%218660.0%+ 153.8%232265228Kia EV9130.0%new212710.0%new231244229VW ID.5130.0%– 74.5%220600.0%– 43.4%235235230BMW ix3130.0%– 13.3%228570.0%– 58.4%237209231EVO5130.0%new –390.0%new252282232SWM G01130.0%– 69.8%256370.0%– 52.6%256175233Audi A7130.0%+ 85.7%243350.0%– 22.2%259251234Land Rover Discovery Sport120.0%– 52.0%216940.0%– 34.7%218211235BMW 7-Series110.0%– 63.3%1911570.0%+ 22.7%196215236Nissan Leaf110.0%– 26.7%2021090.0%– 19.9%210220237BMW i5110.0%new198600.0%new234276238Renault Zoe110.0%– 54.2%246560.0%– 68.9%239196239Mercedes EQS110.0%– 45.0%258360.0%– 52.0%258210240Volvo V90110.0%+ 0.0%268270.0%– 50.9%267243241Subaru Forester100.0%– 75.6%1441660.0%– 20.2%190188242BMW 8-Series100.0%+ 100.0%262390.0%+ 11.4%251263243DFSK 500100.0%+ 25.0%255360.0%– 23.4%257233244BMW IX 90.0%– 71.9%238760.0%– 29.0%225207245MG Marvel90.0%– 70.0%253510.0%– 74.6%244200246Alfa Romeo Giulia90.0%– 10.0%237430.0%+ 7.5%248245247Alpine A11080.0%+ 166.7%264290.0%+ 45.0%265272248BMW XM70.0%– 22.2%221540.0%+ 170.0%242260249Mercedes GLS70.0%– 22.2%233530.0%+ 39.5%243262250EVO370.0%+ 250.0%236470.0%+ 840.0%246281251Jeep Grand Cherokee70.0%n/a247370.0%+ 1133.3%255264252Omoda E570.0%new222240.0%new271 –253Ford Bronco60.0%new241480.0%new245311254EVO760.0%neww190.0%new280328255Nissan Ariya50.0%– 70.6%261560.0%– 39.8%238232256Jaguar E-Pace50.0%– 70.6%232550.0%– 50.5%240218257DFSK 58050.0%– 37.5%224350.0%– 10.3%260252258Audi A850.0%– 50.0%267210.0%– 32.3%273273259Ford Explorer50.0%– 37.5%250210.0%– 74.4%274246260Lexus RZ50.0%+ 150.0%283210.0%+ 425.0%275274261Voyah Free50.0%new –50.0%new312356262Tesla Model X40.0%– 85.7%248330.0%– 60.7%263238263EVO440.0%new249260.0%new268278264Mazda640.0%+ 0.0%294210.0%– 85.5%276214265Mercedes AMG GT40.0%+ 100.0%273200.0%+ 81.8%278292266DFSK ix540.0%+ 33.3%269190.0%– 13.6%279277267SWM G01F40.0%n/a260100.0%+ 42.9%295313268Ferrari 296 GTS40.0%+ 100.0%30190.0%+ 350.0%297329269Toyota Camry30.0%– 81.3%244940.0%– 30.9%219228270VW ID.730.0%new279720.0%new230 –271Yudo K330.0%new230390.0%new253339272Subaru Solterra30.0%+ 50.0%265240.0%+ 50.0%272285273MG 530.0%– 25.0%274160.0%– 55.6%284270274Lamborghini Huracan30.0%n/a28990.0%+ 0.0%299305275VW Arteon20.0%– 95.7%252850.0%– 59.1%223182276Porsche Panamera20.0%– 91.3%226410.0%– 61.3%250224277Cupra Tavascan20.0%– 33.3% –370.0%+ 236.4%254288278Ineos Grenadier20.0%– 81.8%254350.0%+ 218.2%261258279Tesla Model S20.0%– 89.5%271260.0%– 65.8%269247280Lexus LM20.0%new282190.0%new281322281Mercedes SL20.0%– 77.8%257160.0%– 50.0%283266282Aston Martin DB1220.0%new251140.0%new286354283Lamborghini Urus20.0%– 60.0% –110.0%– 38.9%291291284Bentley Bentayga20.0%– 33.3%297100.0%+ 42.9%293295285Lexus LC20.0%+ 100.0% –50.0%– 16.7%311321286Toyota Supra20.0%+ 100.0% –40.0%– 55.6%318303287Subaru Impreza20.0%– 33.3% –20.0%– 85.7%334296288Kia Rio10.0%– 99.8%292420.0%– 98.2%24970289Renault Twingo10.0%– 96.3%280350.0%– 64.3%262208290Ford Fiesta10.0%– 99.6%263300.0%– 96.9%264113291Honda E:NY110.0%new281240.0%new270330292Audi TT10.0%– 80.0%293200.0%+ 11.1%277275293BYD Han10.0%– 50.0%295140.0%+ 366.7%287306294Volvo S9010.0%– 95.2%275140.0%– 70.8%288257295Bentley Continental10.0%– 66.7%270120.0%+ 9.1%290289296Maserati Levante10.0%+ 0.0%296100.0%– 67.7%294280297Ferrari Roma10.0%+ 0.0%29890.0%+ 28.6%298304298Aston Martin DBX10.0%– 50.0%28780.0%+ 0.0%301293299DFSK Seres 310.0%+ 0.0%30060.0%+ 20.0%306290300Aston Martin V8 Vantage10.0%+ 0.0%30240.0%+ 33.3%313325301Suzuki Across10.0%– 50.0%30340.0%– 69.2%317268302Zhidou D210.0%– 75.0% –40.0%– 63.6%319298303Audi e-Tron10.0%– 87.5% –30.0%– 95.2%320261304Ferrari SF9010.0%n/a31020.0%+ 0.0%326319305McLaren 750S10.0%new –20.0%new330 –306Skywell BE1110.0%new –20.0%new332 –307BAIC AS10.0%new –10.0%new336 –308BAIC AT10.0%new –10.0%new337 –309Genesis GV8010.0%new –10.0%new342 –310Hyundai Genesis10.0%n/a –10.0%n/a353362
Source: ANFAC

More Stories
Hungary Full Year 2025: Suzuki S-Cross signs third win in past four years
This content is for members only. Visit the site and log in/register to read.
Czechia Full Year 2025: Skoda Octavia and Kamiq dominate strong market (+7.4%)
This content is for members only. Visit the site and log in/register to read.
Switzerland Full Year 2025: First win for the VW Tiguan
This content is for members only. Visit the site and log in/register to read.
Germany Full Year 2025: VW Golf celebrates 45 straight years at #1
This content is for members only. Visit the site and log in/register to read.
Portugal Full Year 2025: Renault Clio snaps last minute first win in 5 years
This content is for members only. Visit the site and log in/register to read.
Norway Full Year 2025: Record market (+39.5%), Tesla and Model Y at all time high
This content is for members only. Visit the site and log in/register to read.