Belgium April 2024: Dacia breaks ranking and share records
Dacia ranks #4 in Belgium in April, a record.
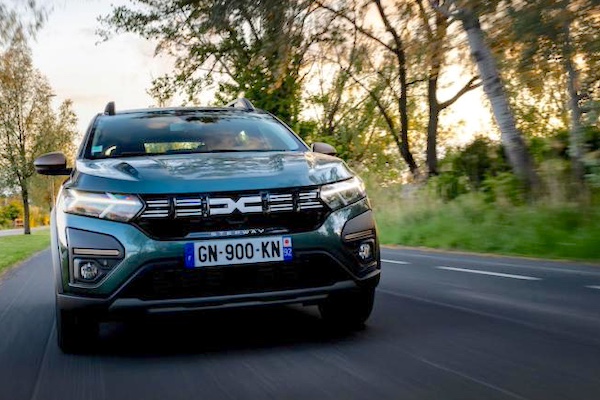
39,699 new cars found a buyer in Belgium in April, stable year-on-year (-0.4%). The YTD volume is up 2% to 174,839. This month Volkswagen (+16.1%) reclaims the brands top spot for the first time since last September with 10.6% share. It however remains well below BMW (-6.1%) in the YTD order, trailing by almost 3,000 sales. Audi (+8.5%) is solid at #3 but it’s Dacia (+44.8%) that posts the largest YoY gain near the top, reaching a record 4th place with a record 7.3% share. Its previous bests were #5 in August 2019 and December 2017 and 6.2% share in August 2029. Dacia doesn’t break its volume record though, its highest remaining the 2,929 units hit in June 2023. Volvo (+52.8%) and Toyota (+35.1%) are the other great performers in the remainder of the Top 10.
Previous month: Belgium March/Q1 2024: Tesla Model Y and Volvo XC40 on top
One year ago: Belgium April 2023: Skoda, Dacia shine in market up 40.4%
Full April 2024 Top 62 All brands ranking below.
Belgium April 2024 – brands:
PosBrandApr-24%/23Mar2024%/23PosFY231Volkswagen4,22510.6%+ 16.1%215,3308.8%+ 4.4%222BMW4,00010.1%– 6.1%118,24310.4%+ 4.7%113Audi3,2458.2%+ 8.5%314,1928.1%+ 22.0%334Dacia2,8827.3%+ 44.8%710,2275.8%+ 36.7%795Mercedes2,7216.9%– 6.2%412,6207.2%+ 0.1%446Toyota2,4326.1%+ 35.1%810,3145.9%+ 16.1%677Volvo2,4146.1%+ 52.8%610,9336.3%+ 41.2%588Renault2,0235.1%– 16.4%98,1624.7%– 12.1%969Skoda1,5643.9%+ 0.6%117,1564.1%+ 8.9%111110Kia1,5003.8%– 1.7%106,9484.0%+ 16.2%121011Hyundai1,3553.4%+ 73.5%135,2843.0%+ 24.7%131612Tesla1,2763.2%+ 47.0%58,4954.9%+ 59.3%81313Peugeot1,1512.9%– 59.2%157,1974.1%– 44.2%10514Citroen1,0372.6%– 14.7%124,8872.8%– 10.9%141415Opel9202.3%– 28.6%163,9352.3%– 39.5%161516Ford 8222.1%– 40.9%144,8362.8%– 22.7%151217Nissan8002.0%– 10.6%173,8432.2%– 1.9%171718Mazda6881.7%+ 18.4%192,5551.5%+ 16.0%181919Seat6321.6%+ 2.9%182,5231.4%– 17.4%192020Land Rover5711.4%+ 1.4%212,4451.4%+ 6.8%202221Suzuki5011.3%+ 8.4%202,2841.3%+ 40.3%212522Porsche3971.0%+ 28.1%221,5270.9%– 3.0%222623MG2830.7%+ 35.4%241,0690.6%– 8.2%262324Fiat2810.7%– 25.3%261,1390.7%– 44.5%242125Cupra2150.5%– 41.9%251,1040.6%– 14.6%252426Mini2140.5%– 78.2%231,4290.8%– 53.9%231827Jeep2000.5%– 2.4%287990.5%– 18.6%282728Polestar1960.5%– 12.5%296830.4%+ 20.9%292829BYD1560.4%+ 262.8%305790.3%+ 261.9%303630Honda1530.4%+ 282.5%278240.5%+ 118.6%273131DS1310.3%– 44.5%334720.3%– 46.1%322932SsangYong/KG Mobility1190.3%+ 25.3%315200.3%+ 8.8%313333Alfa Romeo1090.3%– 39.8%344360.2%– 25.2%343034Lexus990.2%+ 25.3%324580.3%+ 47.3%333435Smart670.2%+ 737.5%352180.1%+ 626.7%354236Jaguar430.1%– 37.7%362090.1%– 36.3%363537Lynk & Co350.1%– 76.7%541340.1%– 81.3%373238Lotus300.1%+ 275.0%371030.1%+ 296.2%383839Subaru280.1%+ 16.7%381020.1%– 41.0%393740Alpine270.1%+ 68.8%39820.0%+ 57.7%403941Maserati190.0%+ 11.8%45440.0%– 26.7%434042Ferrari150.0%+ 36.4%41550.0%– 3.5%424343Tripod140.0%+ 55.6%40580.0%+ 152.2%414744Fisker130.0%new46340.0%new486245BAIC120.0%+ 140.0%50430.0%+ 126.3%444646Maxus120.0%n/a56160.0%+ 1500.0%535347Aston Martin110.0%+ 83.3%48280.0%+ 47.4%504948Lamborghini100.0%+ 42.9%42380.0%+ 46.2%464849Forthing90.0%new43400.0%new455550DFSK80.0%– 50.0%49240.0%– 61.9%514151Bentley60.0%– 25.0%44360.0%– 28.0%474452FAW60.0%n/a –110.0%+ 266.7%556553Allied Vehicles50.0%– 28.6%51320.0%+ 39.1%494554NIO40.0%n/a –70.0%+ 600.0%576355Mitsubishi30.0%n/a47200.0%n/a525156Rolls-Royce30.0%n/a52110.0%+ 450.0%545857Alpina20.0%+ 0.0%5390.0%+ 0.0%565458Tremonia10.0%new –60.0%new597459SWM10.0%+ 0.0%5740.0%+ 100.0%615660Ineos10.0%– 75.0% –30.0%– 40.0%625261Chevrolet10.0%n/a –10.0%– 85.7%725762Morgan10.0%n/a –10.0%– 50.0%7361
Source: FEBIAC


