Australia April 2024: Another record market, Toyota RAV4 and Ford Everest at all-time high
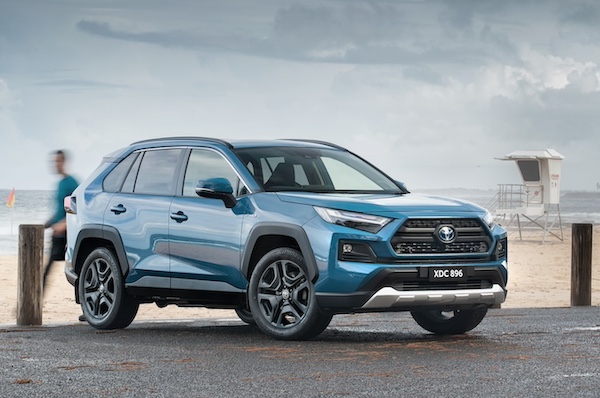
The Toyota RAV4 is the best-selling vehicle in Australia for the third time ever.
The Australian new vehicle market breaks its April record at 97,202 units, up a whopping 18.3% year-on-year and eclipsing the previous best of 92,347 established in 2021. This is the 10th monthly record over the past 12 months. The year-to-date tally is now up 14.4% to an all-time high 401,654. It’s important to note that volumes reflect deliveries, not orders and in fact most of the cars delivered this month were ordered last year or even in 2022. Private sales grow 12.8% to 48,943 units, while business sales jump 27.8% to 35,914, rental sales edge up 7.3% to 4,879 and government sales are up 38.9% to 3,126. SUVs climb 17.6% to 54,135 and 55.7% of the market in April vs. 56% a year ago and 52.3% in 2022, Light Commercials are up 25.6% to 21.423 and 22% share vs. 20.8% last year and 24.2% in April 2022 and Passenger cars secure a 17.8% share vs. 18.5% in 2023 and 19.1% in 2022 with sales up 14% to 17,314.
Looking at sales by state and region, all of them post double-digit gains, with New South Wales up 16.9% to 29,263, Victoria up 19.2% to 26,492, Queensland up 14.8% to 20,872, Western Australia up 18.1% to 9,806, South Australia up 33.5% to 6,789, Tasmania up 31.9% to 1,677, Australian Capital Territory up 14.5% to 1,444 and Northern Territory up 12.9% to 859. Petrol sales recede -4.3% to 40,565, diesel is up 21.9% to 28,336, HEVs surge 194.5% to 16,466, BEVs notably drop -5.1% to 6,194 due to a lull in Tesla sales and PHEVs soar 138.5% to 1,300. As far as country of production is concerned, Japan (+35.9%) maintains its lead with 30,320 sales ahead of Thailand (+44.5%) at 22,956, China (-2%) at 13,159, South Korea (-4.1%) at 12,426 and Germany (+3.4%) at 3,179.
Brand-wise, Toyota (+72.7%) compensates for a supply-constrained year-ago result with 21.4% share vs. 19.2% so far this year. For the first time, hybrid sales account or more than 50% of Toyota sales at 10,972, lodging its first ever five-figure result. Ford (+71.3%) is equally impressive and ranks #2 for the third time in the past 5 months. Mazda (+5.4%) and Kia (+7.3%) are more discreet while Mitsubishi (+19.7%) shines and Hyundai (-9.5%) sinks, ensuring the Top 6 brands are in the same order as YTD. GWM (+50.3%) manages its second Top 10 finish of the year at #9 with Isuzu Ute (+46.6%) also showing fantastic growth at #7. MG (+9.2%) seems to have plateaued as sales are up just 2.3% YTD. Subaru (+29.3%) rounds out the Top 10 in strong fashion. The rest of the Top 20 has four outstanding performers: Suzuki (+40.7%), Honda (+34%), Audi (+32%) and BYD (+26.1%). Tesla sales are down -43.5%.
The Toyota RAV4 (+166.5%) slips into first place overall for the third time ever after July and August 2020. The nameplate also breaks its volume record (5,857) established just last month, and its share record (6%). At 5,504 sales, the Hybrid variant accounts for 94% of the RAV4 volume for the month and has seen its delivery time slashed from 2 years to 6 months. After a 5-month run at #1, the Ford Ranger (+56.1%) is relegated to 2nd place but still posts an impressive year-on-year lift. The Toyota Hilux (+33.1%) is up one spot on last month to #3 while the Ford Everest (+254.5%) breaks its ranking (#4), volume (2,400) and share (2.5%) records. Other fine performers in the Top 10 include the Toyota Corolla (+165.1%) and Camry (+226.3%). The Toyota Corolla Cross (+185.7%) breaks into the Top 20 for the first time at #19. Notice also the BYD Seal up to #34.
Previous month: Australia March 2024: Ford up to #2 brand, Everest breaks ranking record
One year ago: Australia April 2023: Ford Ranger reclaims lead, Tesla, Nissan, VW impress
Full April 2024 Top 47 All brands and Top 40 models below.
Australia April 2024 – brands:
PosBrandApr-24%/23Mar2024%/23PosFY231Toyota 20,77121.4%+ 72.7%177,00919.2%+ 45.4%112Ford 8,6488.9%+ 71.3%231,3237.8%+ 29.6%233Mazda 7,3017.5%+ 5.4%331,0627.7%– 3.7%324Kia 6,6536.8%+ 7.3%525,5716.4%+ 3.9%445Mitsubishi5,3145.5%+ 19.7%425,5026.3%+ 21.0%566Hyundai 5,1855.3%– 9.5%723,0355.7%+ 2.8%657Isuzu Ute4,2564.4%+ 46.6%917,0574.2%+ 28.6%8108MG3,7813.9%+ 9.2%1016,2104.0%+ 2.3%979GWM3,3303.4%+ 50.3%1213,5313.4%+ 30.0%121310Subaru 3,2463.3%+ 29.3%1113,8823.5%– 1.0%11911Nissan 2,9053.0%– 3.5%817,1984.3%+ 50.4%71212Volkswagen2,8382.9%– 4.0%1311,7502.9%– 1.3%131113Tesla2,0772.1%– 43.5%614,8663.7%+ 5.6%10814BMW2,0742.1%+ 18.5%147,9182.0%+ 11.0%141515Mercedes2,0572.1%– 17.3%166,9701.7%– 24.1%151416Suzuki 1,6221.7%+ 40.7%156,9141.7%+ 26.6%161817Audi1,4111.5%+ 32.0%204,9291.2%– 16.1%201718BYD1,4101.5%+ 26.1%185,8911.5%+ 83.2%172119Honda 1,1911.2%+ 34.0%175,8741.5%+ 21.7%182020LDV1,1781.2%– 18.0%195,7231.4%– 11.5%191621Lexus1,0691.1%– 16.1%214,0571.0%+ 11.9%211922Volvo7280.7%– 30.3%242,6170.7%– 30.8%222223Land Rover6010.6%– 31.9%222,3360.6%+ 24.9%242324Chery5850.6%+ 37.6%252,4980.6%+ 487.8%232925Skoda4750.5%– 4.6%262,0280.5%– 17.8%262526Ssangyong4610.5%– 4.9%281,8290.5%– 6.6%282827Renault4030.4%– 36.8%271,8610.5%– 29.2%272428Porsche3690.4%– 7.5%232,2290.6%+ 22.5%252729Chevrolet3620.4%+ 54.7%301,2550.3%+ 37.3%303330Ram3240.3%– 44.2%291,3640.3%– 38.5%292631Mini2340.2%– 1.7%311,0570.3%– 8.1%313132Jeep 2100.2%– 39.7%329400.2%– 40.0%323033Fiat1780.2%+ 24.5%365140.1%– 20.4%353634Peugeot1750.2%– 4.9%346690.2%+ 9.9%343435Cupra1700.2%+ 6.9%337490.2%– 22.5%333236Genesis1350.1%– 15.6%354700.1%+ 5.6%363737Alfa Romeo570.1%+ 137.5%392650.1%+ 113.7%383838Jaguar570.1%+ 62.9%372540.1%+ 75.2%394039Maserati290.0%– 50.0%401300.0%– 0.8%403940Lotus150.0%+ 650.0%41740.0%+ 164.3%414541Lamborghini150.0%+ 400.0%44610.0%+ 110.3%434142Bentley120.0%n/a45580.0%+ 1.8%444243McLaren110.0%n/a47210.0%+ 5.0%474744Ferrari90.0%– 18.2%42630.0%– 4.5%424445Aston Martin90.0%– 43.8%43500.0%– 2.0%454646Citroen90.0%– 66.7%46380.0%– 46.5%464347Rolls-Royce40.0%+ 33.3%48130.0%+ 30.0%4848
Australia April 2024 – models:
PosModelApr-24%/23Mar2024%/23Pos1Toyota RAV45,8576.0%+ 166.5%215,9814.0%+ 98.5%32Ford Ranger5,5695.7%+ 56.1%121,3305.3%+ 23.3%13Toyota Hilux4,6934.8%+ 33.1%417,1834.3%+ 6.2%24Ford Everest2,4002.5%+ 254.5%76,8991.7%+ 89.3%105Isuzu D-Max2,3802.4%+ 31.6%610,3272.6%+ 23.4%46Toyota Corolla2,0972.2%+ 165.1%138,5082.1%+ 106.7%67Isuzu MU-X1,8761.9%+ 71.3%156,7301.7%+ 37.5%148Toyota Camry1,8731.9%+ 226.3%166,3071.6%+ 234.4%169Mitsubishi Outlander1,8481.9%+ 1.0%58,8982.2%+ 13.5%510MG ZS1,7071.8%+ 7.5%127,9982.0%+ 9.2%811Kia Sportage1,6991.7%+ 97.8%116,8281.7%+ 62.3%1212Mazda CX-51,6291.7%+ 31.1%107,1251.8%– 10.4%913Hyundai Tucson1,5481.6%– 7.7%196,2331.6%+ 1.0%1714Kia Cerato1,4541.5%+ 181.2%244,7851.2%+ 187.6%2315Mazda CX-31,4161.5%+ 64.7%205,6391.4%+ 5.9%1916Hyundai Kona1,3031.3%+ 123.1%185,3021.3%+ 105.0%2017Mitsubishi Triton1,2871.3%+ 36.0%146,1611.5%+ 19.7%1818Nissan X-Trail1,2191.3%+ 13.3%86,8171.7%+ 86.9%1319Toyota Corolla Cross1,1801.2%+ 185.7%443,5940.9%+ 91.1%3420Toyota Land Cruiser Wagon1,1691.2%+ 40.8%96,3691.6%+ 76.2%1521Tesla Model Y1,1661.2%– 44.3%38,0012.0%+ 52.0%722Mazda BT-501,1371.2%– 14.9%215,0811.3%– 3.3%2123GWM Haval Jolion1,1011.1%+ 53.3%234,5611.1%+ 34.9%2424Kia Sorento1,0541.1%+ 29.5%323,6060.9%– 9.4%3325Mitsubishi ASX9781.0%+ 27.5%264,0861.0%+ 23.4%2626Subaru Outback9481.0%+ 26.1%353,5040.9%– 8.5%3527Mazda CX-309271.0%– 28.2%333,8581.0%+ 2.3%2928Subaru Forester9160.9%+ 4.1%224,4991.1%– 23.0%2529Tesla Model 39110.9%– 42.4%176,8651.7%– 22.2%1130Mazda38930.9%+ 5.7%363,6080.9%+ 12.6%3231MG 38900.9%– 22.0%313,7790.9%– 31.8%3032Suzuki Jimny8620.9%+ 142.8%403,0370.8%+ 65.0%3833Subaru Crosstrek8180.8%+ 1503.9%283,9311.0%+ 7607.8%2834BYD Seal8110.8%new692,3840.6%new4735Toyota Land Cruiser PU/CC8010.8%+ 25.4%343,9341.0%+ 33.3%2736Hyundai i307850.8%– 61.3%304,9051.2%– 24.9%2237VW T-Roc7620.8%+ 12.2%482,4810.6%+ 2.9%4538GWM Haval H67580.8%+ 22.3%412,9610.7%+ 10.4%4039VW Amarok7290.7%+ 373.4%423,0030.7%+ 270.7%3940Toyota Yaris Cross7140.7%+ 138.0%602,5820.6%+ 35.0%43
Source: VFACTS

