France January 2024: Dacia smashes share record, ends month just 914 sales below Renault
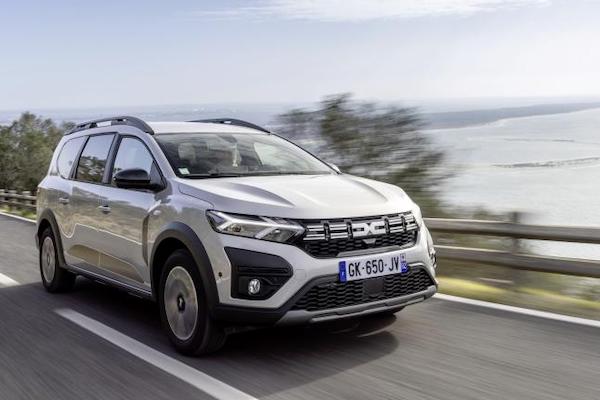
First French Top 10 finish for the Dacia Jogger.
The French new car market is up 9.2% year-on-year in January to 122,285 units. Petrol sales edge down -3.7% to 41,753 and 34.1% share vs. 38.7% a year ago, diesel is off -23.3% to 9,623 and 7.9% share vs. 11.2% in January 2023, HEVs shoot up 29.8% to 33,786 and 27.6% share vs. 23.2%, PHEVs are up 2.4% to 10,545 and 8.6% share vs. 9.2% and BEVs are up 36.6% to 20,017 and 16.4% share vs. 13.1% a year ago.
Peugeot (+15.4%) reclaims the lead of the brands charts for the first time since March 2023 with a splendid 16.7% share. Its advantage over archenemy Renault (-13.2%) widens to almost 5,600 sales for the month. Meanwhile Dacia (+20.7%) shatters its market share record at 11.4% vs. a previous best of 10.5% hit in April 2023. This means Renault only sells 914 units more than Dacia this month, the lowest ever margin in French history. Will a time come when Dacia actually outsells Renault in France? Toyota (+19.2%) is up one spot on December to #4 with 8.5% share, outselling Citroen (+20.7%) which rallies back up to #5 after a horrendous month of December (#10). Volkswagen (-30.6%) pays for its particularly good result last month and falls to #6. The rest of the Top 10 all outpace the market, with Opel at +38.1%, Fiat at +36.2%, BMW at +34.8% and Kia at +10.6%. Tesla is up 320.8% to #12.
Model-wise, the Peugeot 208 (+41.1%) scores its first monthly win since last September with a very strong 6.8% share, its best since the 7% of October 2022. The Dacia Sandero (+5.5%) stays in 2nd place with 5.7% share while last year’s winner the Renault Clio (+17.4%) falls to #3. The Citroen C3 (+61.2%) scores the largest gain in the Top 8 to return to the 4th place it held over the Full Year 2023. The Peugeot 2008 (-1.4%) is shy but back up to #5 ahead of the Peugeot 308 (+24.2%) and Toyota Yaris (+44.7%), both outstanding. The Toyota Yaris Cross (+13.4%) is back up four spots on December to #8. The Dacia Jogger (+74.9%) breaks into the French Top 10 for the very first time, with its previous best being #12 hit in June 2022, April 2023 and September 2023. The Dacia Duster (+57.3%) rounds out the Top 10.
Previous post: France Full Year 2023: Renault and Clio back in charge, Tesla up to #7
One year ago: France January 2023: Dacia breaks share record, Sandero repeats at #1 in market up 8.9%
Full January 2024 Top 54 All brands and Top 100 models below.
France January 2024 – brands:
PosBrandJan-24%/23DecFY231Peugeot 20,41016.7%+ 15.4%222Renault 14,84412.1%– 13.2%113Dacia 13,93011.4%+ 20.7%434Toyota10,3358.5%+ 19.2%565Citroen 9,9028.1%+ 20.7%1046Volkswagen5,7234.7%– 30.6%357BMW 4,1523.4%+ 34.8%788Opel 3,9513.2%+ 38.1%18149Kia 3,7933.1%+ 10.6%141310Fiat 3,2052.6%+ 36.2%161511Ford 3,1322.6%+ 4.1%121012Tesla3,1182.5%+ 320.8%6713Hyundai3,0532.5%– 5.0%131214Audi 2,7232.2%– 5.2%111115Nissan 2,3511.9%+ 0.6%171716DS1,9831.6%– 0.9%242017Mercedes 1,8501.5%– 16.3%8918Suzuki1,7981.5%+ 55.4%202119Skoda 1,7631.4%– 21.1%151620Mini1,4781.2%+ 2.0%191921MG1,2701.0%– 27.1%91822Volvo1,2191.0%+ 11.8%222323Seat 9290.8%– 28.7%212224Cupra7330.6%+ 89.4%232425Jeep5930.5%+ 38.2%282626Land Rover5410.4%+ 49.9%272727Mazda4540.4%+ 0.9%252528Lexus4360.4%+ 48.3%262829BYD4270.3%new363830Alfa Romeo3860.3%+ 57.6%313031Porsche3490.3%+ 89.7%323132Smart3420.3%+ 317.1%343533Honda3190.3%+ 19.5%292934Mitsubishi2910.2%+ 40.6%353435Lynk & Co1300.1%– 54.1%403236Abarth1050.1%n/a333737Leapmotor910.1%+ 4450.0%373938Alpine730.1%– 9.9%303339Jaguar320.0%+ 18.5%383640Seres (ex DFSK)120.0%– 63.6%394141Maserati80.0%+ 166.7%414242Aiways80.0%– 77.8% –4543Ferrari70.0%– 53.3%424044Lotus70.0%+ 600.0%464345VinFast50.0%new515446Fisker40.0%new454747Morgan40.0%+ 300.0%475148Subaru40.0%n/a505249McLaren30.0%n/a545350Lamborghini10.0%– 80.0%434451Aston Martin10.0%– 50.0%444652Caterham10.0%– 66.7%484853Chevrolet10.0%n/a565654Devalliet10.0%n/a5858
France January 2024 – models:
PosModelJan-24%/23DecFY231Peugeot 2088,3726.8%+ 41.1%322Dacia Sandero6,9245.7%+ 5.5%233Renault Clio5,8344.8%+ 17.4%114Citroen C34,9854.1%+ 61.2%845Peugeot 20083,8803.2%– 1.4%1156Peugeot 308 III3,8323.1%+ 24.2%1077Toyota Yaris3,1482.6%+ 44.7%9168Toyota Yaris Cross2,7472.2%+ 13.4%12119Dacia Jogger2,5702.1%+ 74.9%311810Dacia Duster2,4992.0%+ 57.3%151011Peugeot 3008 II2,4782.0%– 8.3%241212Renault Captur2,4492.0%– 26.3%7613Citroen C3 Aircross2,0491.7%+ 49.2%422214Dacia Spring1,9371.6%+ 1.4%171415Fiat 5001,9281.6%+ 4.7%13916Opel Corsa1,8231.5%+ 40.7%322517Tesla Model 31,6231.3%+ 483.8%41918Tesla Model Y1,4771.2%+ 248.3%5819Ford Puma1,4331.2%+ 24.1%222020Renault Austral1,3961.1%– 11.8%211321Toyota C-HR1,3391.1%+ 8.5%623522Citroen C4 III1,3301.1%+ 19.3%503023Citroen C5 Aircross1,3201.1%– 33.2%522424Mini Hatch1,2521.0%+ 71.5%263325Renault Arkana1,2161.0%– 42.2%271526Renault Twingo1,2021.0%+ 5.3%232827VW Polo1,1781.0%– 36.7%141728VW Golf1,1540.9%+ 51.0%183429Hyundai Tucson1,1200.9%– 13.6%302630Toyota Aygo X1,1140.9%– 11.7%333831Kia Sportage1,1020.9%+ 1.6%363632Peugeot 50081,0670.9%+ 7.6%453233Renault Megane E-Tech1,0630.9%– 29.4%292734Toyota Corolla1,0600.9%+ 6.2%384235Nissan Juke1,0050.8%+ 104.3%534536Suzuki Swift9880.8%+ 74.9%594837Nissan Qashqai9750.8%– 18.2%372938Kia Niro9310.8%+ 132.8%565239MG49240.8%+ 34.7%62340BMW X18900.7%+ 223.6%253941BMW Série 18380.7%+ 12.2%354642VW Tiguan7980.7%– 6.9%283143VW T-Roc7490.6%– 47.5%202144Hyundai Kona7480.6%+ 2.6%474145DS 47360.6%– 19.3%815446Opel Mokka7270.6%– 22.7%695147Ford Kuga7120.6%+ 37.5%403748DS 76740.6%– 1.9%915549Opel Crossland6610.5%+ 176.6%717750Toyota RAV46250.5%+ 71.2%616551Audi A35910.5%+ 24.4%495652DS 3/Crossback5560.5%+ 42.9%1147853Kia Stonic5520.5%+ 45.3%1098454Fiat 500X5220.4%+ 1142.9%13411755VW Taigo4890.4%– 52.3%435056Kia Picanto4880.4%+ 18.4%806957Audi Q34830.4%– 18.3%484758BMW iX14670.4%+ 498.7%5110059Renault Espace4550.4%+ 4450.0%347460Ford Focus4510.4%+ 2.0%1008261Fiat 6004450.4%new11217162BMW Série 2 (incl. Tourer)4360.4%+ 22.5%446363Peugeot 4084350.4%– 9.9%785964Cupra Formentor4110.3%+ 61.8%575365Opel Astra4040.3%+ 208.4%13010266Renault Megane IV4030.3%– 56.9%854367Hyundai i203900.3%+ 16.8%766668Volvo XC603850.3%+ 65.9%678669Audi Q23770.3%+ 60.4%757370VW T-Cross3560.3%– 72.1%414471Jeep Avenger3450.3%new11913372Skoda Octavia 3440.3%+ 9.6%606873Suzuki Ignis3380.3%+ 131.5%1219674Renault Trafic3340.3%+ 39.2%587575Alfa Romeo Tonale3320.3%+ 45.6%12710776BYD Atto 33280.3%new19223177Suzuki Vitara3160.3%+ 40.4%799278Hyundai Bayon3120.3%+ 124.5%939779Ford Fiesta3090.3%– 57.6%1018080Volvo EX303070.3%new25831981Skoda Fabia3050.2%– 36.1%655882Fiat Panda3010.2%– 2.6%10210383Porsche Cayenne 2900.2%+ 119.7%29715484Mercedes Classe A2860.2%+ 19.2%396085BMW X32860.2%– 29.0%648186Volvo XC402810.2%– 50.5%686787Opel Grandland2800.2%+ 26.7%1108388Skoda Kamiq2740.2%– 42.2%666489Renault Zoe2740.2%– 57.6%947290Kia Ceed2710.2%+ 51.4%12211291BMW Série 32570.2%– 32.0%899192Seat Ibiza2560.2%– 61.5%737093Skoda Enyaq2530.2%+ 48.0%879394BMW X52500.2%+ 88.0%8810995Audi Q52440.2%– 36.5%747996Kia EV62410.2%+ 1.7%11811097Mercedes GLA2360.2%– 48.1%1940
Source: PFA, AAA

